CHAPTER 1. The Services Sector in Africa: Emerging Trends
27
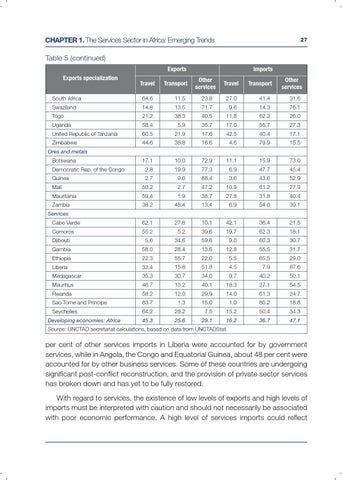
Table 5 (continued) Exports Exports specialization
Travel
Transport
Imports Other services
Travel
Transport
Other services
South Africa
64.6
11.5
23.8
27.0
41.4
31.6
Swaziland
14.8
13.5
71.7
9.6
14.3
76.1
Togo
21.2
38.3
40.5
11.8
62.2
26.0
Uganda
58.4
5.9
35.7
17.0
55.7
27.3
United Republic of Tanzania
60.5
21.9
17.6
42.5
40.4
17.1
Zimbabwe
44.6
38.8
16.6
4.6
79.9
15.5
Ores and metals Botswana Democratic Rep. of the Congo Guinea Mali
17.1
10.0
72.9
11.1
15.9
73.0
2.8
19.9
77.3
6.9
47.7
45.4
2.7
9.0
88.4
3.6
43.6
52.9
50.2
2.7
47.2
10.9
61.2
27.9
Mauritania
59.4
1.9
38.7
27.8
31.8
40.4
Zambia
38.2
48.4
13.4
6.9
54.0
39.1
Cabo Verde
62.1
27.8
10.1
42.1
36.4
21.5
Comoros
55.2
5.2
39.6
19.7
62.3
18.1
Services
Djibouti
5.6
34.6
59.8
9.0
60.3
30.7
Gambia
58.0
28.4
13.6
12.8
55.5
31.7 29.0
Ethiopia
22.3
55.7
22.0
5.5
65.5
Liberia
32.4
15.8
51.8
4.5
7.9
87.6
Madagascar
35.3
30.7
34.0
9.7
40.2
50.1
Mauritius
46.7
13.2
40.1
18.3
27.1
54.5
Rwanda
58.2
12.0
29.9
14.0
61.3
24.7
Sao Tome and Principe
83.7
1.3
15.0
1.0
80.2
18.8
Seychelles
64.2
28.2
7.5
15.2
50.4
34.3
45.3
25.6
29.1
16.2
36.7
47.1
Developing economies: Africa
Source: UNCTAD secretariat calculations, based on data from UNCTADStat.
per cent of other services imports in Liberia were accounted for by government services, while in Angola, the Congo and Equatorial Guinea, about 48 per cent were accounted for by other business services. Some of these countries are undergoing significant post-conflict reconstruction, and the provision of private sector services has broken down and has yet to be fully restored. With regard to services, the existence of low levels of exports and high levels of imports must be interpreted with caution and should not necessarily be associated with poor economic performance. A high level of services imports could reflect