Economic Development in Africa Report 2015
26
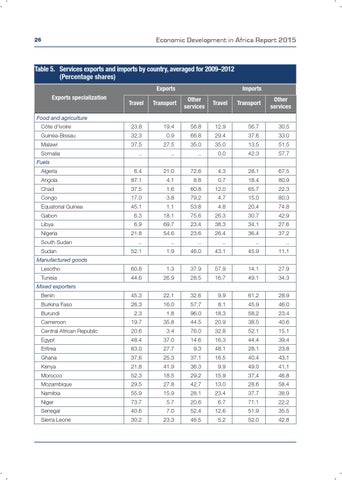
Table 5. Services exports and imports by country, averaged for 2009–2012 (Percentage shares) Exports Exports specialization
Travel
Transport
Imports Other services
Travel
Transport
Other services
Food and agriculture CĂ´te d'Ivoire
23.8
19.4
56.8
12.9
56.7
30.5
Guinea-Bissau
32.3
0.9
66.8
29.4
37.6
33.0
Malawi
37.5
27.5
35.0
35.0
13.5
51.5
..
..
..
0.0
42.3
57.7
Algeria
6.4
21.0
72.6
4.3
28.1
67.5
Angola
87.1
4.1
8.8
0.7
18.4
80.9
Somalia Fuels
Chad
37.5
1.6
60.8
12.0
65.7
22.3
Congo
17.0
3.8
79.2
4.7
15.0
80.3
Equatorial Guinea
45.1
1.1
53.8
4.8
20.4
74.8
6.3
18.1
75.6
26.3
30.7
42.9
Gabon Libya Nigeria South Sudan Sudan
6.9
69.7
23.4
38.3
34.1
27.6
21.8
54.6
23.6
26.4
36.4
37.2
..
..
..
..
..
..
52.1
1.9
46.0
43.1
45.9
11.1
Manufactured goods Lesotho
60.8
1.3
37.9
57.9
14.1
27.9
Tunisia
44.6
26.9
28.5
16.7
49.1
34.3
Benin
45.3
22.1
32.6
9.9
61.2
28.9
Burkina Faso
26.3
16.0
57.7
8.1
45.9
46.0
Mixed exporters
Burundi Cameroon
2.3
1.8
96.0
18.3
58.2
23.4
19.7
35.8
44.5
20.9
38.5
40.6
Central African Republic
20.6
3.4
76.0
32.8
52.1
15.1
Egypt
48.4
37.0
14.6
16.3
44.4
39.4
Eritrea
63.0
27.7
9.3
48.1
28.1
23.8
Ghana
37.6
25.3
37.1
16.5
40.4
43.1
Kenya
21.8
41.9
36.3
9.9
49.0
41.1
Morocco
52.3
18.5
29.2
15.9
37.4
46.8
Mozambique
29.5
27.8
42.7
13.0
28.6
58.4
Namibia
55.9
15.9
28.1
23.4
37.7
38.9
Niger
73.7
5.7
20.6
6.7
71.1
22.2
Senegal
40.6
7.0
52.4
12.6
51.9
35.5
Sierra Leone
30.2
23.3
46.5
5.2
52.0
42.8