CHAPTER 1. The Services Sector in Africa: Emerging Trends
19
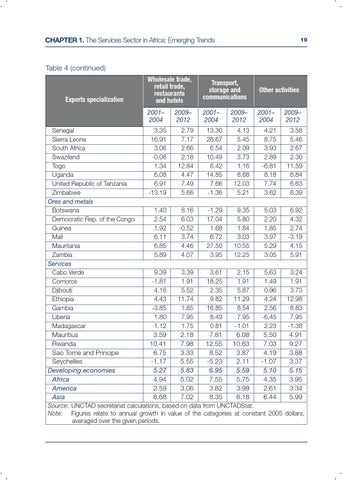
Table 4 (continued)
Exports specialization
Wholesale trade, retail trade, restaurants and hotels
Transport, storage and communications
Other activities
2001– 2004
2001– 2004
2009– 2012
2001– 2004
2009– 2012
2009– 2012
Senegal Sierra Leone South Africa Swaziland Togo Uganda United Republic of Tanzania Zimbabwe Ores and metals Botswana Democratic Rep. of the Congo Guinea Mali Mauritania Zambia Services Cabo Verde Comoros Djibouti Ethiopia Gambia Liberia Madagascar
3.35 16.91 3.06 -0.08 1.34 6.08 6.91 -13.19
2.79 7.17 2.66 2.18 12.84 4.47 7.49 5.66
13.30 26.67 6.54 10.49 6.42 14.85 7.66 -1.36
4.13 5.45 2.09 3.73 1.16 8.68 12.03 5.21
4.21 8.75 3.93 2.89 -6.81 8.18 7.74 3.62
3.58 5.46 2.67 2.30 11.59 6.84 6.63 8.39
1.40 2.54 1.92 6.11 6.85 5.89
8.16 6.03 -0.52 3.74 4.46 4.07
-1.29 17.04 1.68 6.72 27.50 3.95
9.35 5.80 1.84 3.03 10.55 12.25
5.03 2.20 1.85 3.97 5.29 3.05
6.92 4.32 2.74 -3.19 4.15 5.91
9.39 -1.81 4.16 4.43 -3.85 1.80 1.12
3.39 1.91 5.52 11.74 1.85 7.95 1.75
3.61 18.25 2.35 9.82 16.85 8.49 0.81
2.15 1.91 5.87 11.29 8.54 7.95 -1.01
5.63 1.49 0.96 4.24 2.56 -6.45 2.23
3.24 1.91 3.73 12.98 8.83 7.95 -1.38
Mauritius Rwanda Sao Tome and Principe Seychelles Developing economies Africa America Asia
3.59 10.41 6.75 -1.17 5.27 4.94 2.59 6.68
2.18 7.98 3.33 5.55 5.83 5.02 3.06 7.02
7.81 12.55 8.52 -5.23 6.95 7.55 3.82 8.35
6.08 10.63 3.87 2.11 5.59 5.75 3.99 6.18
5.50 7.03 4.19 -1.07 5.10 4.35 2.61 6.44
4.91 9.27 3.88 3.37 5.15 3.95 3.34 5.99
Source: UNCTAD secretariat calculations, based on data from UNCTADStat. Note: Figures relate to annual growth in value of the categories at constant 2005 dollars, averaged over the given periods.