Economic Development in Africa Report 2015
16
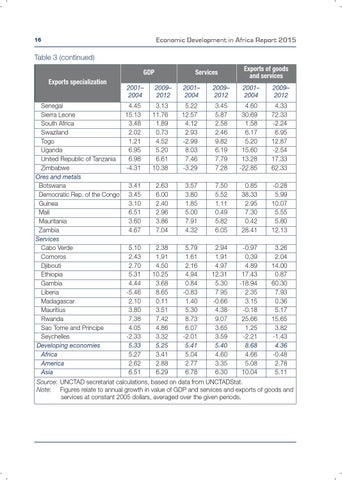
Table 3 (continued) GDP Exports specialization
2001– 2004
Senegal 4.45 Sierra Leone 15.13 South Africa 3.48 Swaziland 2.02 Togo 1.21 Uganda 6.95 United Republic of Tanzania 6.98 Zimbabwe -4.31 Ores and metals Botswana 3.41 Democratic Rep. of the Congo 3.45 Guinea 3.10 Mali 6.51 Mauritania 3.60 Zambia 4.67 Services Cabo Verde 5.10 Comoros 2.43 Djibouti 2.70 Ethiopia 5.31 Gambia 4.44 Liberia -5.46 Madagascar 2.10 Mauritius 3.80 Rwanda 7.38 Sao Tome and Principe 4.05 Seychelles -2.33 Developing economies 5.33 5.27 Africa 2.62 America 6.51 Asia
Services 2009– 2012
2001– 2004
2009– 2012
Exports of goods and services 2001– 2004
2009– 2012
3.13 11.76 1.89 0.73 4.52 5.20 6.61 10.38
5.22 12.57 4.12 2.93 -2.99 8.03 7.46 -3.29
3.45 5.87 2.58 2.46 9.82 6.19 7.79 7.28
4.60 30.69 1.58 6.17 5.20 15.60 13.28 -22.85
4.33 72.33 -2.24 6.95 12.87 -2.54 17.33 62.33
2.63 6.00 2.40 2.96 3.86 7.04
3.57 3.80 1.85 5.00 7.91 4.32
7.50 5.52 1.11 0.49 5.82 6.05
0.85 38.33 2.95 7.30 0.42 28.41
-0.28 5.99 10.07 5.55 5.80 12.13
2.38 1.91 4.50 10.25 3.68 8.65 0.11 3.51 7.42 4.86 3.32 5.25 3.41 2.88 6.29
5.79 1.61 2.16 4.94 0.84 -0.83 1.40 5.30 8.73 6.07 -2.01 5.41 5.04 2.77 6.78
2.94 1.91 4.97 12.31 5.30 7.95 -0.66 4.38 9.07 3.65 3.59 5.40 4.60 3.35 6.30
-0.97 0.39 4.89 17.43 -18.94 2.35 3.15 -0.18 25.66 1.25 -2.21 8.68 4.66 5.08 10.04
3.26 2.04 14.00 0.87 60.30 7.93 0.36 5.17 15.65 3.82 -1.43 4.36 -0.48 2.78 5.11
Source: UNCTAD secretariat calculations, based on data from UNCTADStat. Note: Figures relate to annual growth in value of GDP and services and exports of goods and services at constant 2005 dollars, averaged over the given periods.