CHAPTER 1. The Services Sector in Africa: Emerging Trends
15
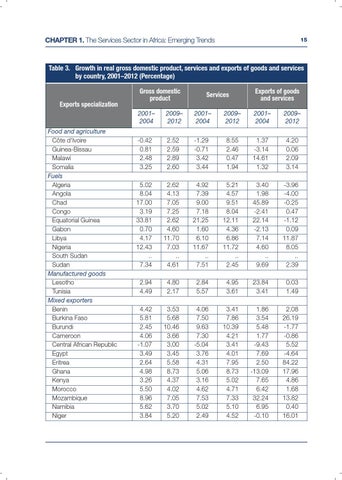
Table 3. Growth in real gross domestic product, services and exports of goods and services by country, 2001–2012 (Percentage)
Exports specialization
Food and agriculture Côte d'Ivoire Guinea-Bissau Malawi Somalia Fuels Algeria Angola Chad Congo Equatorial Guinea Gabon Libya Nigeria South Sudan Sudan Manufactured goods Lesotho Tunisia Mixed exporters Benin Burkina Faso Burundi Cameroon Central African Republic Egypt Eritrea Ghana Kenya Morocco Mozambique Namibia Niger
Gross domestic product
Services
Exports of goods and services
2001– 2004
2009– 2012
2001– 2004
2009– 2012
2001– 2004
2009– 2012
-0.42 0.81 2.48 3.25
2.52 2.59 2.89 2.60
-1.29 -0.71 3.42 3.44
8.55 2.46 0.47 1.94
1.37 -3.14 14.61 1.32
4.20 0.06 2.09 3.14
5.02 8.04 17.00 3.19 33.81 0.70 4.17 12.43 .. 7.34
2.62 4.13 7.05 7.25 2.62 4.60 11.70 7.03 .. 4.61
4.92 7.39 9.00 7.18 21.25 1.60 6.10 11.67 .. 7.51
5.21 4.57 9.51 8.04 12.11 4.36 6.86 11.72 .. 2.45
3.40 1.98 45.89 -2.41 22.14 -2.13 7.14 4.60 .. 9.69
-3.96 -4.00 -0.25 0.47 -1.12 0.09 11.87 8.05 .. 2.39
2.94 4.49
4.80 2.17
2.84 5.57
4.95 3.61
23.84 3.41
0.03 1.49
4.42 5.81 2.45 4.06 -1.07 3.49 2.64 4.98 3.26 5.50 8.96 5.62 3.84
3.53 5.68 10.46 3.66 3.00 3.45 5.58 8.73 4.37 4.02 7.05 3.70 5.20
4.06 7.50 9.63 7.30 -5.04 3.76 4.31 5.06 3.16 4.62 7.53 5.02 2.49
3.41 7.86 10.39 4.21 3.41 4.01 7.95 8.73 5.02 4.71 7.33 5.10 4.52
1.86 3.54 5.48 1.77 -9.43 7.69 2.50 -13.09 7.65 6.42 32.24 6.95 -0.10
2.08 26.19 -1.77 -0.86 5.52 -4.64 84.22 17.96 4.86 1.68 13.82 0.40 16.01