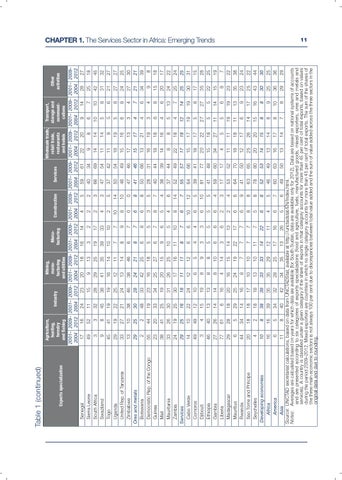
Agriculture, Mining, Wholesale trade, Transport, hunting, manuManuretail trade, storage and Other Industry Construction Services forestry facturing facturing restaurants communiactivities Exports specialization and fishing and utilities and hotels cations 2001– 2009– 2001– 2009– 2001– 2009– 2001– 2009– 2001– 2009– 2001– 2009– 2001– 2009– 2001– 2009– 2001– 2009– 2004 2012 2004 2012 2004 2012 2004 2012 2004 2012 2004 2012 2004 2012 2004 2012 2004 2012 Senegal 17 16 24 23 20 18 16 14 4 5 59 61 22 20 9 14 28 27 Sierra Leone 49 52 11 15 9 13 3 2 2 2 40 34 9 8 6 7 25 18 South Africa 3 3 32 28 29 25 19 17 2 3 66 69 14 14 10 10 42 45 31 32 Swaziland 9 8 45 38 41 35 39 33 4 3 47 54 11 14 5 8 Togo 45 41 19 19 16 14 10 10 2 5 37 42 11 9 5 6 21 27 Uganda 29 19 22 25 12 11 7 7 10 14 50 54 18 19 5 8 27 27 United Rep. of Tanzania 33 27 21 24 13 14 8 9 8 10 46 49 15 16 6 8 24 25 Zimbabwe 13 10 38 46 38 46 6 7 0 0 47 46 17 13 3 4 27 30 Ores and metals 29 25 30 28 24 21 8 7 6 8 41 46 15 17 4 7 21 21 Botswana 2 2 48 33 42 25 6 8 6 8 50 66 13 21 4 6 34 39 Democratic Rep. of the Congo 55 44 19 23 16 18 5 5 3 5 28 31 16 19 3 4 9 8 Guinea 23 20 33 34 25 27 6 7 8 7 40 44 18 18 6 8 15 18 Mali 38 41 25 19 20 15 9 6 5 4 38 39 14 16 4 6 20 17 Mauritania 33 26 30 31 26 25 10 5 4 6 37 44 8 8 5 13 24 22 Zambia 24 19 25 30 17 16 11 10 8 14 52 49 22 18 4 7 25 24 Services 29 25 16 18 11 11 8 7 6 7 55 57 17 18 12 14 25 25 Cabo Verde 14 10 22 24 12 12 6 6 10 12 64 66 15 17 19 19 30 31 Comoros 49 49 12 10 6 5 4 4 6 5 39 41 18 17 5 8 17 15 Djibouti 3 4 15 19 8 9 3 3 6 10 81 77 20 22 27 27 35 28 Ethiopia 46 40 13 13 8 8 5 5 5 5 41 48 15 18 5 5 22 25 Gambia 27 26 14 14 8 10 6 6 6 4 59 60 34 27 11 14 15 19 Liberia 77 61 6 16 4 14 3 6 2 3 17 17 4 5 5 6 8 7 Madagascar 29 28 18 20 16 15 14 13 2 4 53 52 11 11 19 19 23 22 Mauritius 6 5 29 25 24 19 22 17 6 6 64 70 18 18 11 13 35 38 Rwanda 44 34 14 16 8 7 7 7 6 9 41 50 12 17 6 9 23 24 Sao Tome and Principe 20 18 18 17 10 10 7 7 8 8 63 65 25 26 14 17 25 22 Seychelles 4 2 18 18 13 10 11 7 5 8 78 80 20 20 15 16 43 44 Developing economies 10 8 38 39 33 33 14 22 6 6 52 53 14 15 8 8 30 30 16 16 39 35 35 29 12 11 4 5 46 49 13 14 8 9 25 25 Africa 6 5 34 32 28 25 17 16 6 7 60 63 16 17 8 10 36 36 America 11 8 40 42 34 35 13 26 5 6 49 50 13 14 7 8 29 29 Asia Source: UNCTAD secretariat calculations, based on data from UNCTADStat, available at http://unctadstat/EN/Index.html. Notes: Averages are calculated based on years for which data are available (for South Sudan, data are available only for 2012). Data are based on national systems of accounts and are presented according to six categories of exports specializations (food and agriculture, fuels, manufactured goods, mixed exporters, ores and metals and services). A country is classified under a given category if the share of exports in that category accounts for more than 45 per cent of total exports, based on values during the period 2009–2012. Mixed exporters are countries in which no single category accounts for more than 45 per cent of total exports. The sum of the shares of the three main economic sectors is not always 100 per cent due to discrepancies between total value added and the sum of value added across the three sectors in the original data and due to rounding.
Table 1 (continued) CHAPTER 1. The Services Sector in Africa: Emerging Trends 11