Food and agriculture Côte d'Ivoire Guinea-Bissau Malawi Somalia Fuels Algeria Angola Chad Congo Equatorial Guinea Gabon Libya Nigeria South Sudan Sudan Manufactured goods Lesotho Tunisia Mixed exporters Benin Burkina Faso Burundi Cameroon Central African Republic Egypt Eritrea Ghana Kenya Morocco Mozambique Namibia Niger
Exports specialization
Industry
Mining, manufacturing and utilities Manufacturing Construction
Services
Wholesale trade, Transport, retail trade, storage and restaurants communiand hotels cations Other activities
41 25 42 37 62 14 8 8 29 5 3 4 2 32 .. 38 10 10 10 27 36 39 43 20 54 15 14 32 27 15 28 12 45
39 26 43 26 60 13 10 9 22 4 1 4 2 32 9 34 9 8 9 26 35 40 38 22 53 13 17 27 23 16 27 7 48
15 24 16 14 7 60 60 71 31 74 96 61 76 47 .. 20 31 32 30 24 14 17 17 35 14 37 23 20 19 27 24 28 12
18 18 14 32 7 52 50 65 41 70 89 55 63 32 27 24 30 34 26 24 14 16 15 28 15 39 23 24 20 25 22 27 12
12 21 14 10 3 57 53 67 30 71 94 59 72 46 .. 16 25 26 25 19 10 12 14 32 10 33 12 15 14 21 20 25 10
15 16 12 27 3 46 41 59 40 67 85 52 58 30 12 19 25 28 21 18 9 11 11 24 10 33 8 16 14 18 19 23 10
10 16 13 8 2 4 5 4 8 4 0 4 5 3 .. 8 19 20 18 13 9 11 12 19 6 17 10 11 12 16 15 13 6
13 12 11 25 2 5 5 5 6 5 0 6 4 3 5 8 17 17 16 11 8 6 9 17 7 17 6 9 12 14 13 14 6
3 2 2 3 4 3 7 3 1 3 1 2 4 2 .. 4 6 6 5 4 4 5 3 3 4 4 11 5 4 6 3 3 2
3 2 2 5 4 5 10 6 1 4 4 3 5 2 15 5 5 6 5 6 5 5 4 3 4 6 16 9 5 7 3 4 3
43 51 42 48 31 25 32 21 30 22 3 35 22 22 .. 43 58 58 59 49 49 44 40 46 32 48 64 48 54 58 49 60 43
46 59 44 50 32 34 41 23 30 23 3 39 30 31 76 43 62 58 65 51 51 44 47 49 32 50 60 49 58 59 51 65 40
14 12 21 13 10 10 10 11 14 6 1 15 3 11 .. 16 12 8 15 15 18 11 19 22 12 14 21 11 11 14 14 13 15
16 13 21 20 11 12 14 14 14 7 1 17 5 18 16 15 11 9 14 15 18 15 21 22 13 15 19 11 14 13 16 15 14
7 8 4 6 9 5 8 3 2 4 0 6 3 2 .. 12 8 5 11 7 8 5 3 5 4 10 13 15 11 6 11 5 7
8 9 5 6 10 7 10 4 2 5 0 6 5 6 20 13 12 9 15 9 9 5 5 8 6 13 12 16 14 8 13 7 6
23 32 17 30 12 11 14 7 14 11 2 14 15 9 .. 15 38 44 33 27 23 28 18 19 15 23 30 21 32 37 24 42 21
23 36 17 24 12 14 16 5 13 11 3 15 20 8 39 15 39 41 36 26 24 24 21 20 12 21 28 22 30 38 22 43 19
2001– 2009– 2001– 2009– 2001– 2009– 2001– 2009– 2001– 2009– 2001– 2009– 2001– 2009– 2001– 2009– 2001– 2009– 2004 2012 2004 2012 2004 2012 2004 2012 2004 2012 2004 2012 2004 2012 2004 2012 2004 2012
Agriculture, hunting, forestry and fishing
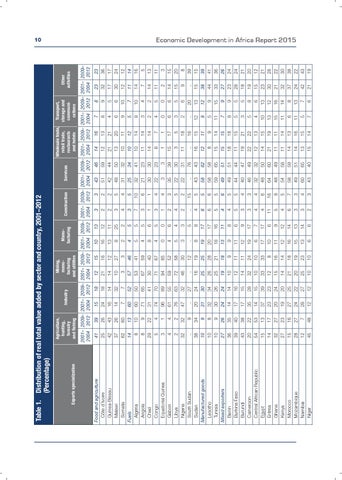
Table 1. Distribution of real total value added by sector and country, 2001–2012 (Percentage) 10
Economic Development in Africa Report 2015