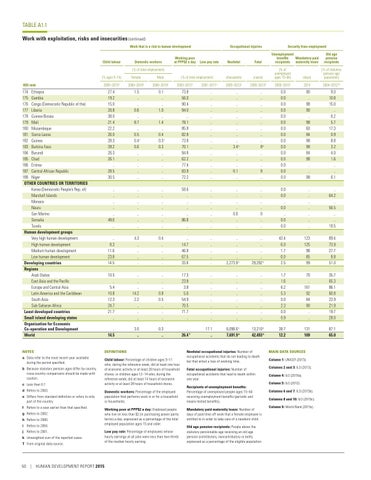
TABLE A1.1 Work with exploitation, risks and insecurities (continued) Work that is a risk to human development
Child labour
Domestic workers
Working poor at PPP$2 a day
Occupational injuries
Low pay rate
HDI rank
Female
Male
2005–2013a
2000–2010a
2000–2010a
174 Ethiopia 175 Gambia 176 Congo (Democratic Republic of the) 177 Liberia 178 Guinea-Bissau 179 Mali 180 Mozambique 181 Sierra Leone 182 Guinea 183 Burkina Faso 184 Burundi 185 Chad 186 Eritrea 187 Central African Republic 188 Niger OTHER COUNTRIES OR TERRITORIES Korea (Democratic People’s Rep. of) Marshall Islands Monaco Nauru San Marino Somalia Tuvalu Human development groups Very high human development High human development Medium human development Low human development Developing countries Regions Arab States East Asia and the Pacific Europe and Central Asia Latin America and the Caribbean South Asia Sub-Saharan Africa Least developed countries Small island developing states Organisation for Economic Co‑operation and Development World
(% of total employment) 2003–2012a
Fatal
(thousands)
(cases)
(% of unemployed ages 15–64)
(days)
(% of statutory pension age population)
2005–2013a
2005–2013a
2005–2013a
2014
2004–2012a,b
27.4 19.2 15.0 20.8 38.0 21.4 22.2 26.0 28.3 39.2 26.3 26.1 .. 28.5 30.5
1.5 .. .. 0.6 .. 8.7 .. 0.5 0.4 f 0.6 .. .. .. .. ..
0.1 .. .. 1.0 .. 1.4 .. 0.4 0.3 f 0.3 .. .. .. .. ..
73.8 56.0 90.4 94.0 .. 78.1 85.8 82.8 73.8 70.1 94.8 62.2 77.4 83.9 72.2
.. .. .. .. .. .. .. .. .. .. .. .. .. .. ..
.. .. .. .. .. .. .. .. .. 3.4 h .. .. .. 0.1 ..
.. .. .. .. .. .. .. .. .. 8h .. .. .. 9 ..
0.0 0.0 0.0 0.0 0.0 0.0 0.0 0.0 0.0 0.0 0.0 0.0 0.0 0.0 0.0
90 .. 98 90 .. 98 60 84 98 98 84 98 .. .. 98
9.0 10.8 15.0 .. 6.2 5.7 17.3 0.9 8.8 3.2 4.0 1.6 .. .. 6.1
.. .. .. .. .. 49.0 ..
.. .. .. .. .. .. ..
.. .. .. .. .. .. ..
59.6 .. .. .. .. 86.8 ..
.. .. .. .. .. .. ..
.. .. .. .. 0.6 .. ..
.. .. .. .. 0 .. ..
0.0 0.0 .. 0.0 .. 0.0 0.0
.. .. .. .. .. .. ..
.. 64.2 .. 56.5 .. .. 19.5
.. 8.3 11.6 23.8 14.5
4.3 .. .. .. ..
0.4 .. .. .. ..
.. 14.7 46.9 67.5 33.8
.. .. .. .. ..
43.4 6.0 1.7 0.0 2.5
123 125 98 85 99
89.4 73.9 27.7 9.8 51.0
10.5 .. 5.4 10.8 12.3 24.7 21.7 ..
.. .. .. 14.2 2.2 .. .. ..
.. .. .. 0.8 0.5 .. .. ..
17.3 23.8 3.8 5.6 54.9 70.5 71.7 ..
.. .. .. .. .. .. .. ..
1.7 1.6 6.2 5.3 0.0 2.3 0.0 0.9
70 .. 161 92 84 90 .. ..
35.7 65.3 86.1 60.8 23.9 21.9 19.7 28.0
.. 14.5
3.0 ..
0.3 ..
.. 26.4 T
38.7 12.2
131 109
87.1 65.0
NOTES
DEFINITIONS
a Data refer to the most recent year available during the period specified.
Child labour: Percentage of children ages 5–11 who, during the reference week, did at least one hour of economic activity or at least 28 hours of household chores, or children ages 12–14 who, during the reference week, did at least 14 hours of economic activity or at least 28 hours of household chores.
b Because statutory pension ages differ by country, cross-country comparisons should be made with caution. c Less than 0.1 d Refers to 2003. e Differs from standard definition or refers to only part of the country. f Refers to a year earlier than that specified. g Refers to 2002. h Refers to 2000. i Refers to 2004. j Refers to 2001. k Unweighted sum of the reported cases. T From original data source.
50 | HUMAN DEVELOPMENT REPORT 2015
Domestic workers: Percentage of the employed population that performs work in or for a household or households. Working poor at PPP$2 a day: Employed people who live on less than $2 (in purchasing power parity terms) a day, expressed as a percentage of the total employed population ages 15 and older. Low pay rate: Percentage of employees whose hourly earnings at all jobs were less than two-thirds of the median hourly earning.
2001–2011a
Old age pension recipients
Nonfatal
(% of total employment) (% ages 5–14)
Security from employment Unemployment benefits Mandatory paid recipients maternity leave
17.1 ..
.. .. .. .. 2,273.9 k
.. .. .. .. 29,292 k
.. .. .. .. .. .. .. .. 6,098.6 k 7,691.9 k
.. .. .. .. .. .. .. .. 13,210 k 42,493 k
Nonfatal occupational injuries: Number of occupational accidents that do not leading to death but that entail a loss of working time.
MAIN DATA SOURCES
Fatal occupational injuries: Number of occupational accidents that lead to death within one year.
Columns 2 and 3: ILO (2013).
Recipients of unemployment benefits: Percentage of unemployed people ages 15–64 receiving unemployment benefits (periodic and means-tested benefits). Mandatory paid maternity leave: Number of days of paid time off work that a female employee is entitled to in order to take care of a newborn child. Old age pension recipients: People above the statutory pensionable age receiving an old age pension (contributory, noncontributory or both), expressed as a percentage of the eligible population.
Column 1: UNICEF (2015).
Column 4: ILO (2015a). Column 5: ILO (2012). Columns 6 and 7: ILO (2015b). Columns 8 and 10: ILO (2015c). Column 9: World Bank (2015c).