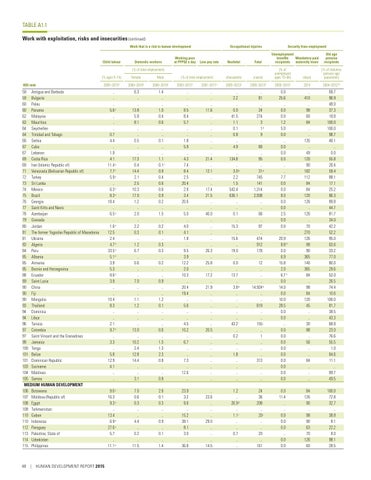
TABLE A1.1 Work with exploitation, risks and insecurities (continued) Work that is a risk to human development
Child labour
Domestic workers
Working poor at PPP$2 a day
Occupational injuries
Low pay rate
HDI rank
Old age pension recipients
Nonfatal
Fatal
(thousands)
(cases)
(% of unemployed ages 15–64)
(days)
(% of statutory pension age population)
(% of total employment) (% ages 5–14)
Female
Male
2005–2013a
2000–2010a
2000–2010a
2003–2012a
2001–2011a
2005–2013a
2005–2013a
2005–2013a
2014
2004–2012a,b
.. .. .. 5.6 e .. .. .. 0.7 4.4 .. 1.9 4.1 11.4 e 7.7 f 5.9 e .. 6.3 e 8.3 e 18.4 .. 6.5 e .. 1.6 e 12.5 2.4 4.7 e 33.5 e 5.1 e 3.9 5.3 8.6 e 3.9 .. .. 10.4 8.3 .. .. 2.1 9.7 e .. 3.3 .. 5.8 12.9 4.1 .. ..
6.3 .. .. 13.8 5.9 8.1 .. .. 0.5 .. .. 17.3 0.4 14.4 2.1 2.5 10.3 17.0 1.2 .. 2.0 .. 2.2 0.3 .. 1.2 6.7 .. 0.6 .. .. 7.0 .. .. 1.1 1.2 .. .. .. 13.0 .. 10.2 2.4 12.8 14.4 .. .. 3.1
1.4 .. .. 1.0 0.4 0.6 .. .. 0.1 .. .. 1.1 0.1 c 0.9 0.4 0.6 0.6 0.9 0.2 .. 1.5 .. 0.2 0.1 .. 0.3 0.3 .. 0.2 .. .. 0.9 .. .. 1.2 0.1 .. .. .. 0.6 .. 1.5 1.3 2.3 0.8 .. .. 0.8
.. .. .. 8.5 8.4 5.7 .. .. 1.8 5.9 .. 4.3 7.4 8.4 2.5 20.4 2.8 3.4 20.6 .. 5.0 .. 4.0 4.1 1.8 .. 9.5 3.9 12.2 2.0 10.3 .. 20.4 19.4 .. 5.6 .. .. 4.5 10.2 .. 6.7 .. .. 7.3 .. 12.6 ..
.. .. .. 11.6 .. .. .. .. .. .. .. 21.4 .. 12.1 .. .. 17.4 21.5 .. .. 40.0 .. .. .. .. .. 26.3 .. 25.8 .. 17.2 .. 21.9 .. .. .. .. .. .. 20.5 .. .. .. .. .. .. .. ..
.. 2.2 .. 0.0 41.5 1.1 0.1 0.8 .. 4.9 .. 134.8 .. 3.0 g 2.2 1.5 542.4 636.1 .. .. 0.1 .. 15.3 .. 15.6 .. 19.0 .. 0.0 .. 13.7 .. 3.8 g .. .. .. .. .. 43.2 i .. 0.2 .. .. 1.8 .. .. .. ..
.. 81 .. 24 274 3 1d 9 .. 88 .. 95 .. 31 g 745 141 1,314 2,938 .. .. 66 .. 87 .. 474 912 178 .. 12 .. .. .. 14,924 g .. .. 619 .. .. 155 i .. 1 .. .. .. 313 .. .. ..
0.0 25.6 .. 0.0 0.0 1.2 5.0 0.0 .. 0.0 0.0 0.0 .. .. 7.7 0.0 0.0 8.0 0.0 0.0 2.5 0.0 0.0 .. 20.9 8.8 d 0.0 6.9 15.8 2.0 6.7 h 0.0 14.0 0.0 10.0 28.5 0.0 0.0 .. 0.0 0.0 0.0 0.0 0.0 0.0 0.0 0.0 0.0
.. 410 .. 98 60 84 .. .. 135 .. 49 120 90 182 112 84 84 120 126 .. 126 .. 70 270 126 98 90 365 140 365 84 .. 98 84 120 45 .. .. 30 98 .. 56 .. .. 84 .. .. ..
69.7 96.9 48.0 37.3 19.8 100.0 100.0 98.7 46.1 .. 0.0 55.8 26.4 59.4 88.1 17.1 25.2 86.3 89.8 44.7 81.7 34.0 42.2 52.2 95.0 63.6 33.2 77.0 80.0 29.6 53.0 26.5 74.4 10.6 100.0 81.7 38.5 43.3 68.8 23.0 76.6 55.5 1.0 64.6 11.1 .. 99.7 49.5
9.0 e 16.3 9.3 e .. 13.4 6.9 e 27.6 e 5.7 .. 11.1 e
7.0 0.6 0.3 .. .. 4.4 .. 0.2 .. 11.5
2.6 0.1 0.3 .. .. 0.9 .. 0.1 .. 1.4
23.9 3.2 9.6 .. 15.2 38.1 8.1 3.0 .. 36.8
.. 23.6 .. .. .. 29.0 .. .. .. 14.5
1.2 .. 26.9 d .. 1.1 j .. .. 0.7 .. ..
24 36 208 .. 20 j .. .. 20 .. 161
0.0 11.4 .. .. 0.0 0.0 0.0 .. 0.0 0.0
84 126 90 .. 98 90 63 70 126 60
100.0 72.8 32.7 .. 38.8 8.1 22.2 8.0 98.1 28.5
58 Antigua and Barbuda 59 Bulgaria 60 Palau 60 Panama 62 Malaysia 63 Mauritius 64 Seychelles 64 Trinidad and Tobago 66 Serbia 67 Cuba 67 Lebanon 69 Costa Rica 69 Iran (Islamic Republic of) 71 Venezuela (Bolivarian Republic of) 72 Turkey 73 Sri Lanka 74 Mexico 75 Brazil 76 Georgia 77 Saint Kitts and Nevis 78 Azerbaijan 79 Grenada 80 Jordan 81 The former Yugoslav Republic of Macedonia 81 Ukraine 83 Algeria 84 Peru 85 Albania 85 Armenia 85 Bosnia and Herzegovina 88 Ecuador 89 Saint Lucia 90 China 90 Fiji 90 Mongolia 93 Thailand 94 Dominica 94 Libya 96 Tunisia 97 Colombia 97 Saint Vincent and the Grenadines 99 Jamaica 100 Tonga 101 Belize 101 Dominican Republic 103 Suriname 104 Maldives 105 Samoa MEDIUM HUMAN DEVELOPMENT 106 Botswana 107 Moldova (Republic of) 108 Egypt 109 Turkmenistan 110 Gabon 110 Indonesia 112 Paraguay 113 Palestine, State of 114 Uzbekistan 115 Philippines
48 | HUMAN DEVELOPMENT REPORT 2015
(% of total employment)
Security from employment Unemployment benefits Mandatory paid recipients maternity leave