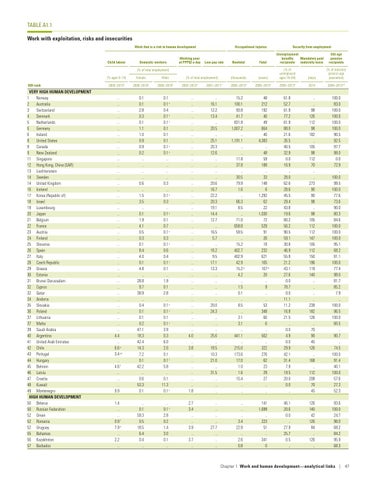
TABLE A1.1 Work with exploitation, risks and insecurities Work that is a risk to human development
Child labour
Domestic workers
Working poor at PPP$2 a day
Occupational injuries
Low pay rate
VERY HIGH HUMAN DEVELOPMENT 1 Norway 2 Australia 3 Switzerland 4 Denmark 5 Netherlands 6 Germany 6 Ireland 8 United States 9 Canada 9 New Zealand 11 Singapore 12 Hong Kong, China (SAR) 13 Liechtenstein 14 Sweden 14 United Kingdom 16 Iceland 17 Korea (Republic of) 18 Israel 19 Luxembourg 20 Japan 21 Belgium 22 France 23 Austria 24 Finland 25 Slovenia 26 Spain 27 Italy 28 Czech Republic 29 Greece 30 Estonia 31 Brunei Darussalam 32 Cyprus 32 Qatar 34 Andorra 35 Slovakia 36 Poland 37 Lithuania 37 Malta 39 Saudi Arabia 40 Argentina 41 United Arab Emirates 42 Chile 43 Portugal 44 Hungary 45 Bahrain 46 Latvia 47 Croatia 48 Kuwait 49 Montenegro HIGH HUMAN DEVELOPMENT 50 Belarus 50 Russian Federation 52 Oman 52 Romania 52 Uruguay 55 Bahamas 56 Kazakhstan 57 Barbados
Fatal
(thousands)
(cases)
(% of unemployed ages 15–64)
(days)
(% of statutory pension age population)
2001–2011a
2005–2013a
2005–2013a
2005–2013a
2014
2004–2012a,b
15.2 100.1 93.8 41.7 831.8 1,007.2 .. 1,191.1 .. .. 11.8 37.8 .. 30.5 79.9 1.6 .. 66.3 8.5 .. 71.0 658.8 59.5 .. 15.2 402.7 402.9 42.9 15.2 d 4.2 .. 1.5 0.1 .. 8.5 .. 3.1 3.1 .. 441.1 .. 215.0 173.6 17.0 1.0 1.6 15.4 .. ..
48 212 192 40 49 664 40 4,383 .. 48 59 188 .. 33 148 6 1,292 62 22 1,030 72 529 91 26 18 232 621 105 107 d 20 .. 9 .. .. 53 348 60 6 .. 562 .. 322 276 62 23 29 27 .. ..
61.8 52.7 61.9 77.2 61.9 88.0 21.6 26.5 40.5 32.9 0.0 16.9 .. 28.0 62.6 28.6 45.5 29.4 43.8 19.6 80.2 56.2 90.5 59.1 30.8 46.9 55.8 21.2 43.1 27.6 0.0 78.7 0.0 11.1 11.2 16.8 21.5 .. 0.0 4.9 0.0 29.9 42.1 31.4 7.9 19.5 20.0 0.0 ..
.. .. 98 126 112 98 182 .. 105 98 112 70 .. .. 273 90 90 98 .. 98 105 112 112 147 105 112 150 196 119 140 .. .. .. .. 238 182 126 .. 70 90 45 126 .. 168 .. 112 208 70 45
100.0 83.0 100.0 100.0 100.0 100.0 90.5 92.5 97.7 98.0 0.0 72.9 .. 100.0 99.5 100.0 77.6 73.6 90.0 80.3 84.6 100.0 100.0 100.0 95.1 68.2 81.1 100.0 77.4 98.0 81.7 85.2 7.9 .. 100.0 96.5 100.0 60.5 .. 90.7 .. 74.5 100.0 91.4 40.1 100.0 57.6 27.3 52.3
141 1,699 .. 223 51 .. 341 0
46.1 20.6 0.0 .. 27.9 25.7 0.5 ..
126 140 42 126 84 .. 126 ..
93.6 100.0 24.7 98.0 68.2 84.2 95.9 68.3
(% ages 5–14)
Female
Male
(% of total employment)
2005–2013a
2000–2010a
2000–2010a
.. .. .. .. .. .. .. .. .. .. .. .. .. .. .. .. .. .. .. .. .. .. .. .. .. .. .. .. .. .. .. .. .. .. .. .. .. .. .. 4.4 .. 6.6 e 3.4 e,f .. 4.6 f .. .. .. 9.9
0.1 0.1 2.8 0.3 0.1 1.1 1.0 0.9 0.9 0.2 .. .. .. .. 0.6 .. 1.5 3.5 .. 0.1 1.9 4.1 0.5 0.3 0.1 8.4 4.0 0.1 4.8 .. 28.8 9.7 38.9 .. 0.4 0.1 0.1 0.2 47.1 18.3 42.4 14.3 7.2 0.1 42.2 .. 0.6 53.3 0.1
0.1 0.1 c 0.4 0.1 c 0.1 c 0.1 0.1 0.1 0.1 c 0.1 c .. .. .. .. 0.3 .. 0.1 c 0.3 .. 0.1 c 0.1 0.7 0.1 c 0.3 0.1 c 0.6 0.4 0.1 c 0.1 .. 1.9 0.1 2.8 .. 0.1 c 0.1 c 0.1 0.1 c 3.9 0.3 6.0 2.0 0.1 0.1 c 5.8 .. 0.1 11.3 0.1 c
.. .. .. .. .. .. .. .. .. .. .. .. .. .. .. .. .. .. .. .. .. .. .. .. .. .. .. .. .. .. .. .. .. .. .. .. .. .. .. 4.0 .. 3.8 .. .. .. .. .. .. 1.8
.. 16.1 12.2 13.4 .. 20.5 .. 25.1 20.3 12.6 .. .. .. .. 20.6 16.7 22.2 20.3 19.1 14.4 12.7 .. 16.5 5.7 .. 16.2 9.5 17.1 13.3 .. .. .. .. .. 20.0 24.3 .. .. .. 25.6 .. 18.5 10.3 21.0 .. 31.5 .. .. ..
1.4 .. .. 0.9 f 7.9 e .. 2.2 ..
.. 0.1 59.3 0.5 18.5 6.4 0.4 ..
.. 0.1 c 2.8 0.2 1.4 3.0 0.1 ..
2.7 3.4 .. .. 3.9 .. 3.7 ..
.. .. .. .. 27.7 .. .. ..
2003–2012a
Old age pension recipients
Nonfatal
(% of total employment)
HDI rank
Security from employment Unemployment benefits Mandatory paid recipients maternity leave
.. .. .. 3.4 22.9 .. 2.6 0.8
Chapter 1 Work and human development—analytical links | 47