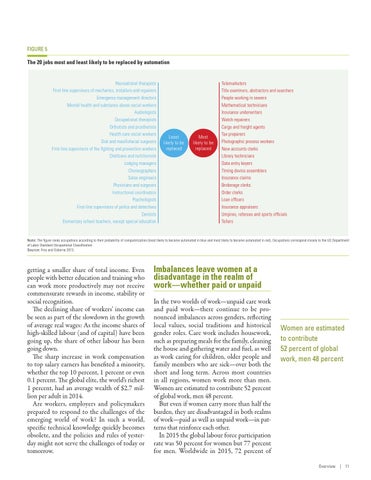
FIGURE 5 The 20 jobs most and least likely to be replaced by automation
Recreational therapists First-line supervisors of mechanics, installers and repairers Emergency management directors Mental health and substance abuse social workers Audiologists Occupational therapists Orthotists and prosthetists Health care social workers Oral and maxillofacial surgeons First-line supervisors of fire fighting and prevention workers Dietitians and nutritionists Lodging managers Choreographers Sales engineers Physicians and surgeons Instructional coordinators
Psychologists First-line supervisors of police and detectives Dentists Elementary school teachers, except special education
Least likely to be replaced
Most likely to be replaced
Telemarketers Title examiners, abstractors and searchers People working in sewers Mathematical technicians Insurance underwriters Watch repairers Cargo and freight agents Tax preparers Photographic process workers New accounts clerks Library technicians Data entry keyers Timing device assemblers Insurance claims Brokerage clerks Order clerks Loan officers Insurance appraisers Umpires, referees and sports officials Tellers
Note: The figure ranks occupations according to their probability of computerization (least likely to become automated in blue and most likely to become automated in red). Occupations correspond closely to the US Department of Labor Standard Occupational Classification. Source: Frey and Osborne 2013.
getting a smaller share of total income. Even people with better education and training who can work more productively may not receive commensurate rewards in income, stability or social recognition. The declining share of workers’ income can be seen as part of the slowdown in the growth of average real wages: As the income shares of high-skilled labour (and of capital) have been going up, the share of other labour has been going down. The sharp increase in work compensation to top salary earners has benefited a minority, whether the top 10 percent, 1 percent or even 0.1 percent. The global elite, the world’s richest 1 percent, had an average wealth of $2.7 million per adult in 2014. Are workers, employers and policymakers prepared to respond to the challenges of the emerging world of work? In such a world, specific technical knowledge quickly becomes obsolete, and the policies and rules of yesterday might not serve the challenges of today or tomorrow.
Imbalances leave women at a disadvantage in the realm of work— whether paid or unpaid In the two worlds of work—unpaid care work and paid work—there continue to be pronounced imbalances across genders, reflecting local values, social traditions and historical gender roles. Care work includes housework, such as preparing meals for the family, cleaning the house and gathering water and fuel, as well as work caring for children, older people and family members who are sick—over both the short and long term. Across most countries in all regions, women work more than men. Women are estimated to contribute 52 percent of global work, men 48 percent. But even if women carry more than half the burden, they are disadvantaged in both realms of work—paid as well as unpaid work—in patterns that reinforce each other. In 2015 the global labour force participation rate was 50 percent for women but 77 percent for men. Worldwide in 2015, 72 percent of
Women are estimated to contribute 52 percent of global work, men 48 percent
Overview | 11