Net Zero in Texas:
The Role of Workforce Development
Authored by

White Paper Contributors


Ramanan Krishnamoorti is the Vice President of Energy and Innovation at the University of Houston. He has served as chair of the Cullen College of Engineering’s chemical and biomolecular engineering department, and associate dean of research for the Cullen College of Engineering. He is a professor of chemical and biomolecular engineering, with affiliated appointments as a professor of petroleum engineering, and chemistry. Dr. Krishnamoorti obtained his bachelor’s degree in chemical engineering from the Indian Institute of Technology Madras and doctoral degree in chemical engineering from Princeton University.
Suryanarayanan Radhakrishnan is the Managing Director of UH Energy. Previously, he served as a Clinical Assistant Professor in Decision and Information Sciences at the University of Houston’s C.T. Bauer College of Business. Before joining the University of Houston, he had worked for 36 years for Shell in various positions in Planning, Strategy, Marketing, and Business Management. At UH Energy, he has been involved in the development of UH Energy’s strategy, working closely with the Energy Advisory Board. Dr. Radhakrishnan holds a bachelor’s degree in mechanical engineering from Osmania University, India; a master’s degree in Industrial Engineering from Oklahoma State University, and a doctoral degree in Business Administration from the University of Houston.
Aparajita Datta is a researcher at UH Energy and a Ph.D. candidate in Political Science at the University of Houston. She studies the burdens and disparities in program participation, and the resultant impacts on racial equity, energy justice, and climate policymaking. Her dissertation evaluates the policy feedback effects of means-tested home energy assistance programs. Aparajita holds a bachelor's in computer science and engineering from the University of Petroleum and Energy Studies, India, and master’s degrees in energy management from the C. T. Bauer College of Business, in public policy from the Hobby School of Public Affairs, and political science from the College of Liberal Arts and Social Sciences at the University of Houston.
Acknowledgements
We thank the Cullen Trust for Higher Education for their generous support of the Net Zero Texas by 2050 research initiative. The project benefited immensely from discussions with and feedback from Corbin J. Robertson. We thank our Co-PIs for the CCUS, Transportation, Workforce Development, and Financial Incentives segments of the project. Many thanks to Chuck McConnell, Connor Thompson, and Greg Bean. We are grateful to Ed Bailey for his support in publishing this work.
Executive Summary
The energy industry has an outsized impact on the Texas economy. The transition to a net-zero Texas by 2050 will impact the state’s workforce and all sectors of the economy. In this study, we address the consequences of different transition scenarios and the required development of the workforce. We quantify their impact on the Texas energy workforce, and the economy through the earnings, output, and value-added to the state. We address workforce development in current energy industry sectors and in new and emerging sectors and technologies that can support a net-zero transition. Our main findings are:
a. Business-as-usual is not an option.
The continuation of a business-as-usual pathway will result in a disadvantage for the state’s workforce and economy. The workforce will shrink across all sectors and lead to economic losses for the state if a net-zero strategy is not pursued. The greatest impact will be on coal and natural gas jobs, with about 80,000 jobs lost between now and 2050. Pursuing alternate decarbonization pathways will also shrink the coal and natural gas jobs; however, gains in renewables, biomass, hydrogen, CCUS, and CDR will offset the loss.
b. The cost of inaction is significant.
New full-time equivalent jobs and direct, indirect, and induced economic impacts decline by 90-95% between 2022 (baseline scenario) and 2050 for a business-as-usual pathway.
c. An all-of-the-above strategy will bring the most workforce benefits to Texas.
The state stands to gain the most in workforce development and economic impacts under scenarios where an all-of-theabove strategy is adopted as against prioritizing capacity additions in either renewables and storage or liquids fuels and CCUS. The highest gains for the workforce and economy are achieved when capacity additions in renewables are balanced with that of liquid fuels, biomass, hydrogen, CCUS, and CDR. On average, such a strategy will add 1300 full-time equivalent jobs per GW (equivalent) of capacity addition.
d. CCUS can transform the energy workforce.
The CCUS sector can grow to support five times the current oil and gas workforce in the state if it receives policy support and incentives that allowed early gains in oil and gas in the 1940s through 1980s and wind energy since the early 2000s.
e. Reskilling and upskilling must be prioritized. The sector can be supported with a highly skilled workforce from the coal, oil, and natural gas sectors where jobs will be lost through the transition. Ensuring transferability of skills, reskilling, and upskilling will ensure that the highly skilled workforce is not under-utilized and the economic decline from the lost jobs can be minimized.
f. Policies exist; implementation is inadequate. While federal and state policies and incentives provide support for workforce development, aligning the skills of the future workforce with the changing needs of the industry, focusing on growing the middle-skills jobs, and a pipeline that can connect Texas to the jobs that align with their skills and present pathways for upward mobility are generally lacking.
g. Coordinated efforts are essential.
Supporting a net-zero Texas with the right workforce to preserve and grow the state’s competitive advantage and ensure that the energy transition is equitable will require coordinated efforts from the workforce, educators, employers, and policymakers in the state.
Net Zero in Texas: The Role of Workforce Development
Chapter 1: Introduction
Texas’ annual GDP was over $2.5 trillion in the 4th quarter of 2023 (Figure 1). This represented a 6 percent year-over-year growth and a 38% growth as compared to the 4th quarter of 2019 (Fig 1). Texas’ economy is second in the U.S. after California. The state’s diverse and strong economy helped its recovery from the pandemic-induced downturn in 2020. In May 2024, the unemployment rate was 4% and the state added 42,000 nonagricultural jobs in the month, bringing the total number of jobs in the state to 14.65 million.1

Figure 1. Texas GDP (not seasonally adjusted) between 1997 and 2023, in billion dollars. Data source: Federal Reserve Bank of St. Louis2
The energy industry has an outsized impact on the Texas economy. The state leads the nation in energy production (1/4th of the national) and consumption (1/7th of the national). In 2022, the state accounted for 12% of the nation’s total electricity generation, almost double that of the second-highest electricity-producing state, Florida. Texas was also the largest producer of oil (42%), and natural gas (marketed) (27%), and led the nation in the number of crude oil refineries and refining capacity (about 33% of the nation's refining capacity).3 Texas produced about 26% of all U.S. wind-powered electricity generation in 2021, leading the nation in wind energy for the 17th year in a row. The state’s industrial sector consumes the most total end-use energy (about 60%) and is followed by the transportation sector (about 30%).
According to the U.S. Energy and Employment Jobs Report, the energy industry in the state had 936,476 traditional roles in 2022, representing about 7% of the state’s total jobs, and 11.5% of the nation’s traditional energy jobs.4 Of these, 64,570 jobs were in electric power generation, 302,744 were in fuels, and 203,777 were in transmission, distribution, and storage. Additionally, Texas had 164,470 jobs in energy efficiency which accounted for 7.4% of all U.S. energy efficiency jobs, and 200,916 jobs in motor vehicles which accounted for 7.7% of all U.S. motor vehicle jobs. Between 2021 and 2022, energy jobs in the state increased by 6.3%, or 55,785 jobs (Figure 2).5

Figure 2. Energy employment in Texas by major technology application, 2020-2022. Source: 2023 USEER State Report: Texas
Additionally, in 2022, Texas had nearly 15,000 solar jobs, which represents 4% of all U.S. solar jobs. This share is expected to grow many-fold with a projected 30-fold increase in installed solar capacity in the state by 2030.6 The Solar Energy Industry Association projects that prices have fallen by over 50% in the last 10 years and the state’s current investments in solar of nearly $18 billion, Texas will grow to be the largest solar producer in the nation over the next 5 years.7 The state also supports over 26,000 wind jobs, which accounts for about 21% of all U.S. wind jobs.8
Net Zero in Texas: The Role of Workforce Development
Table 1. Employment in low-carbon energy industry segments in Texas and the U.S. Data source: E2
While the energy workforce in the state has been impacted by many boom-and-bust cycles and geopolitical changes, the energy transition is reshaping the energy workforce, unlike any other previous change. The challenges of the energy transition and decarbonization have been compounded by rapid technology transformation and technology obsolescence as well as shifts in employee perceptions and generational changes that have led to a loss of loyalty and engagement.9
The rest of this chapter provides an overview of how the energy industry and workforce in Texas have evolved. We analyze the drivers that have caused transformations in the state’s energy workforce and its economic impact in the past and how they compare against the industry’s current state to set up the scope of the challenge and the unique opportunities for workforce development in the energy industry in a net zero Texas by 2050. We identify how the state’s energy workforce will change under different decarbonization scenarios, how these compare to business-as-usual, and how the changes in the workforce impact the state’s economy.

Chapter 2 discusses the role of federal stimuli for the energy transition through the 2021 Infrastructure Investment and Jobs Act and the 2022 Inflation Reduction Act on the energy industry and workforce, the unique provisions for workforce development, and state-level priorities that can bolster federal priorities.

Chapter 3 highlights state-level policies, regulations, and laws in support of workforce development in Texas, with examples of key enablers that have been successful in Texas in the past, and discusses marketbased forces of workforce retention, reskilling and upskilling, license-to-operate issues, ESG reporting, and risks and liabilities for the industry.

Chapter 4 details the methodology for the analyses, along with the assumptions and caveats to each approach, and discusses the results and policy implications for workforce development, reskilling, upskilling, and to ensure that Texas can preserve its competitive advantage and grow its economy by 2050.
1.1 Evolution of the Energy Industry and its Impact on the Texas Economy
Texas’s abundant natural resources have allowed the state to dominate energy production in the nation and the world. The prominence of the energy industry in Texas can be largely attributed to the oil and gas industry and its rapid growth since the first oilfield was discovered in Spindletop in 1901. In 1940, Texas became the largest oil-producing state in the country and one of the largest oil-producing regions globally.10 By 1980, the oil and gas industry accounted for more than 15% of the Texas GDP and 5% of the state’s employment (Figure 3). This share of employment peaked in 1980 and has remained lower since the oil price crash in 1986.

Figure 3. The share of the oil and gas industry in Texas jobs and Texas GDP. The share of the jobs peaked in 1980. Source: Federal Reserve Bank of Dallas.
Recovery from the crash was slow through the 1990s and the industry’s challenges were compounded by the slow discovery of new deposits and the decline of larger oil fields. This resulted in greater reliance on oil imports and an increase in downstream activity in the state with the growth of petrochemicals and refining capacity (Figure 4). Currently, Texas has 34 operable refineries of which all are operating and account for a third of the total U.S. refining capacity.11
Oil prices recovered, and new jobs and skills were added with new technologies like hydraulic fracturing and horizontal drilling in the mid-2000s in the Barnett shale field, and the activities expanded to the Permian Basin and the Eagle Ford Shale Play.
Overall, the state’s economy has followed price swings for crude oil. Figure 5a presents the relative job growth in Texas, calculated as the difference between the year-over-year percentage change in U.S. payroll employment and Texas payroll employment, against the WTI price of a barrel of oil between 1968 and 2020. Figure 5b highlights
Net Zero in Texas: The Role of Workforce Development
that oil and gas extraction, support activities for mining, natural gas distribution, petroleum and coal products manufacturing, pipeline transportation, and gasoline station industries lost 21% or 76,300 jobs in Texas between September 2019 and September 2020.12
The Federal Reserve Bank of Dallas’ quantification of how the energy industry in Texas has evolved and how it compares against the rest of the nation is presented in Figure 6.7 The evolution is measured as the squared differences of the percentage share of state-level and national employment by industry across 20 broad industry classifications,2 such that higher values denote the state’s industry mix is closer to the national average. As Figure 6 indicates, the measure, calculated as 1 minus the squared sum of the absolute differences in job shares across the industries, will be closer to 1 if a state has the same job shares as the country’s average. Contrastingly, the value will be closer to zero if a state’s jobs are in a few key industries. The difference between Texas and the national average decreased from the mid-1980s to the mid-2000s and increased after the shale boom. The differential has been fairly steady over the last few years as the state has diversified its tech sector and renewable power industry.

Figure 4. Texas’ annual operable and operating crude oil distillation capacity in barrels per calendar year.
Data source: U.S. EIA.1

Figure 5a. Year-over-year job growth in Texas relative to the national average and the real WTI price of a barrel of oil between 1968 and 2020.
Source: Federal Reserve Bank of Dallas.


Figure 5b. Changes in Texas oil and gas employment indexed to January 2021, compared with statewide and national nonfarm employment (left), and Texas oil and gas employment, in thousands, compared to statewide nonfarm employment. The dashed red line indicates that if the peak in jobs from April 2022 holds as the plateau for this latest cycle, then the employment trends will resemble previous cycles of boom and bust in the industry.

Figure 6. The differential between Texas and the U.S. average industry mix and comparisons with California and New York. The difference for Texas narrowed from the mid-1980s to the mid-2000s and then widened following the shale boom. California is more diversified than Texas, while New York is less diversified than Texas, compared to the national index. Source: Federal Reserve Bank of Dallas.
Some of this diversification can be attributed to the chemicals manufacturing and petrochemicals sector. The chemical industry (excluding pharmaceuticals) in the state supplied 13% of chemicals worldwide, contributing $486 billion to the U.S. GDP, $125 billion in exports, and adding trade $28 billion in trade surplus, largely enabled by the accessible feedstock produced in the state, the infrastructure in the Gulf Coast, and the specialized workforce.13 Table 2 details the sector’s economic impact in the state and the country, where the location quotient indicates that basic chemical production is ~2.7 times more concentrated in Texas than in the U.S., with high employment and high average wage.
We expect the growth in renewable energy during the energy transition will significantly impact the energy workforce in Texas. The growth of renewables in the state over the last decade has lowered the carbon intensity of the Texas electricity mix.14 Electricity generation from renewables will remain one of the most impactful means to reduce the GHG footprint. Figures 7a and 7b highlight how the state’s electricity mix changed between 2010 and 2020, and capacity addition in the U.S. and across ISO/RTO regions by fuel type in 2021.
2. The economic impact of chemical manufacturing in Texas and the U.S. Source: Texas Comptroller of Public Accounts.
Table

Figure 7a. Annual electricity generation, by fuel type and net generation, in Texas between 2001-2021 in thousand GWh. Source: EIA

Figure 7b. Annual energy generation from wind and solar (utilityscale) based electricity generation in Texas, 2001-2020 in thousand GWh. Source: EIA
Coal and natural gas constitute more than 60% of the fuel mix. At the same time, Texas already produces more electricity from wind energy and natural gas than any other U.S. state. Of the 8,139 MW of new capacity additions in 2021, wind, solar, and natural gas contributed 42%, 40%, and 13%, respectively. While the Texas grid will add more renewable capacity, the challenges of grid management and frequent extreme weather events posing reliability concerns are likely to persist in the absence of new investments in infrastructure, short-duration energy storage, longduration storage, and grid resilience.15
1.2 Wages in the Energy Industry
Wages in the energy industry are predominantly determined by the characteristics of the role such as skills and experience level, required education, employee safety and location of the job, and general economic factors like labor market competition or union representation for the industry. According to the U.S. Energy and Employment Report’s Wage Report supplement of 2020, the energy workforce earns higher wages than those compared to the national median in other sectors of the economy (~19 in 2019). Table 3 presents the national average wages in the energy industry, total employment by industry, and a comparison against the national median. Appendix A provides further details by job function, industry, segment, and comparisons against the national average.
Table 3. National average wages in the energy industry, total employment by industry, and national median wages in 2019. Data source: U.S. Energy and Employment Report 2020
Overall, the energy industry’s median hourly wage is $25.60 in the U.S., which is 34% higher than the national median hourly wage. Transmission, distribution, and storage workers earn nearly $31 per hour or 66% above the national median wage, and hydroelectric power generation workers earn about $27 per hour or 41% above the national median wage. Across industry segments, utility
employees and mining and extraction workers earn $41 and $36 per hour, respectively. These are amongst the highest premiums compared to the national median hourly wage. Across industries, the nuclear, electric power transmission and distribution, natural gas, and coal industries support the highest wage premiums compared to the national median wage (50-66%). In contrast, the lowest premiums are in energy storage, energy efficiency, solar, and wind (27-26%), but are still at least 25% higher than the national median hourly wages.
1.3 The Future of the Energy Workforce in Texas
Rapid technological changes, automation, efficient processes, and the growth of new industries have resulted in a demand for new skill sets. The existing energy workforce has largely been unable to acquire these skills as company training programs have been discontinued due to rapid turnovers in companies or have not kept pace with the energy transition. The potential new energy workforce has also suffered from a lack of reskilling and upskilling opportunities and a gap in the transferability of their technical and vocational skills to the evolving jobs in the energy sector. As a result, over 80% of energy companies in Texas have reported hiring difficulties in 2021.16 Additionally, an aging energy workforce and the pandemic-induced shifts in the workplace have led to a wave of retirements. These have been particularly prominent in the high and middle-skill jobs in the energy industry.
Between 2012 and 2019, Texas lost high-wage jobs at an annual rate of 2.4%, even though high-wage jobs in the U.S. grew at an annual rate of 2.3%.17 Among the younger workforce, many do not want to work for the energy industry due to the industry’s environmental impact, uncertainty around career growth, the perception that the industry is not doing enough for the energy transition, and beliefs that the industry is aging as the top five reasons for their views. At the same time, the younger workforce also reports that they are skeptical because they have never had an opportunity to interact with industry professionals, and their opinions are based on general perception.18 A recent UH research study19 found that students in Houston who wish to pursue a career in the energy industry are twice as likely to prefer working for a renewable energy company that is recognized as being an ESG3 leader and that the students are willing to take a lower salary than working for an oil drilling company that is criticized for not meeting ESG standards. As a result, the energy industry is not only facing increased pressure from investors, stakeholders, and the government to address workforce development, rethink workforce reskilling and upskilling, and address the skills gap in the industry, given a combination of technological, economic, and social drivers, but the future workforce is demanding change for the industry to attract, retain and build a supply chain of talent.
Findings from the ninth annual “Gaps in the Energy Workforce Pipeline” survey of the Center for Energy Workforce Development (CEWD) highlighted that the energy industry is driving its workforce development efforts by:20
• Implementing company-specific workforce development strategies, with a commitment to strategic workforce planning.
• Focusing training programs for occupations tied to the sectors will be essential to meet the skills gap and support the energy transition.
• Expanding career awareness initiatives to build awareness of energy careers among youth, low-income students, women, military, and transitioning workers and create stronger visibility.
• Setting clear career pathways for growth within the company, to reduce turnover within the first 5 years.
• Supporting State Energy Workforce Consortia to build partnerships between energy employers and local education, labor, and government entities to develop secondary and postsecondary programs specific to skilled energy jobs.
• Building diversity, equity, and inclusion into workforce pathways at every step.
Gains or losses in jobs and the overall impact on the current and future energy workforce will be determined by the energy transition pathway that Texas chooses and the regulations and policies that are introduced by the state’s leadership to upskill, reskill, and strengthen the workforce.
Texas lost high-wage jobs at an annual rate of
2.4% even though high-wage jobs in the U.S. grew at an annual rate of 2.3% between 2012 and 2019.
Chapter 2: Federal Priorities for the Energy Workforce
The Infrastructure Investment and Jobs Act of 2021, also known as the Bipartisan Infrastructure Bill, spearheaded a series of projects and plans to help the nation decarbonize its energy mix, and lower emissions while supporting good-paying, union jobs. Since its passage, the White House has reported that Texas will directly benefit from IIJA21 by:
1. Repairing and rebuilding roads and bridges: Based on IIJA’s formula funding alone, Texas would expect to receive $26.9 billion for federal-aid highway apportioned programs and $537 million for bridge replacement and repairs over five years. Texas can also compete for the $12.5 billion Bridge Investment Program for economically significant bridges and nearly $16 billion in national funding in the bill dedicated to major projects that will deliver substantial economic benefits to communities.
2. Improving healthy, sustainable transportation options: Based on formula funding alone, Texas would expect to receive $3.3 billion over five years to improve public transportation options across the state.
3. Building a network of EV chargers: Texas would expect to receive $408 million over five years to support the expansion of an EV charging network in the state. Texas can also apply for the $2.5 billion in grant funding dedicated to EV charging in the bill.
4. Preparing the infrastructure for the impacts of climate change, cyber-attacks, and extreme weather events: Texas will expect to receive $53 million over five years to protect against wildfires and $42 million to protect against cyberattacks. Texans will also benefit from the bill’s $3.5 billion national investment in weatherization.
Additionally, the National Governor’s Association has reported that IIJA will allow states to obligate funds from four programs authorized by the Fixing America’s Surface Transportation Act (FAST Act) toward workforce development activities, including support for pre-apprenticeship and apprenticeship programs and opportunities for on-the-job training.22
With IIJA, the State Digital Equity Capacity Grant Program will provide $60 million in statewide funding to develop Digital Equity Plans to ensure residents can attain the skills needed to participate equitably in the digital economy. Eligible entities that may receive support from the Digital Equity Competitive Grant Program include institutions of higher education, medical or health providers, local education agencies, and workforce training providers.
IIJA has also advanced the State Human Capital Plans. These encourage states to submit voluntary five-year plans that outline the immediate and long-term workforce in transportation
and public infrastructure. These may include the role of workforce development boards and state workforce agencies in implementation and a human capital management strategy aligned with the state’s transportation mission and goals.
The Act has also provisioned specific wage and labor considerations including wages following the local prevailing cost of living, intensifying efforts to recruit, train, and upskill traditionally underrepresented communities, including minorities and women, and increasing opportunities for sharing best practices and data collection. IIJA also recognizes the workforce challenges that the energy industry was facing before the passage of the Act and the investments spurred by the Act may exaggerate some of these challenges. Therefore, the Act recommends that the Secretary of Energy must establish the “21st Century Energy Workforce Advisory Board”,23 including experts from economics or workforce development, relevant traditional energy industries or emerging energy industries including energy efficiency, secondary or postsecondary education, energy workforce development or apprenticeship programs of States or units of local government, relevant organized labor organizations, and underrepresented groups, including racial and ethnic minorities, women, veterans, and socioeconomically disadvantaged individuals.
The Advisory Board will provide recommendations to the U.S. Department of Energy to:
• Meet current and future industry and labor needs of the energy sector
• Provide opportunities for students to become qualified for placement in traditional and emerging energy sector jobs
• Utilize the agency’s technical expertise to support the workforce activities related to energy jobs of other Federal agencies
• Carry out the Equity in Energy Initiative and other DOE workforce priorities
• Develop plans to support and retrain displaced and unemployed energy sector workers
• Prioritize education and job training for underrepresented groups
IHS Markit’s analysis of the economic impact of additional transportation infrastructure spending in IIJA found that Texas is one of five states receiving the greatest economic impacts from the proposed additional infrastructure investments. These investments would translate into a $5,400 million increase in GDP, a $1,900 million increase in disposable income, a $2,000 million increase in consumer spending, and a $930 million increase in state and local tax receipts. The investments in public transit from IIJA will result in a $1,300 million increase in the state’s GDP, a $580 million increase in disposable income, a $527 million increase in consumer spending, and $244 million in state and local tax receipts.24
The U.S. Congress passed the Inflation Reduction Act in August 2022. The White House Reported that the Act will benefit the energy workforce in Texas by creating jobs that pay prevailing wages and an estimated $66.5 billion of investment in large-scale low-carbon power generation and storage to Texas between now and 2030. IRA includes credits and bonuses for companies that pay a prevailing wage.25 The wage provisions will apply to:26
• Alternative Fuel Refueling Property Credit (§30C)
• Production Tax Credit (§45, §45Y)
• Credit for Carbon Oxide Sequestration (§45Q)
• Credit for Production of Clean Hydrogen (§45V)
• Clean Fuel Production Credit (§45Z)
• Investment Tax Credit (§48, §48E)
• Advanced Energy Project Credit (§48C)
• Energy Efficient Commercial Buildings Deduction (§179D)
• New Energy Efficient Home Credit (§45L)
• Zero-Emission Nuclear Power Production Credit (§45U)
By incentivizing apprenticeships, the Act creates a pipeline for training and employment pathways into high-quality jobs, diversifies the workforce, and ensures access to the jobs created by IRA. To meet the apprenticeship requirements, employers must ensure that 10% of the total hours worked on a project is performed by registered apprentices in 2022 and 2023, while the requirement increases to 15% in 2024.27 With its Apprenticeship Ambassador Initiative, IRA will create 460 new apprenticeship programs by next year and address setting, monitoring, and enforcing workplace harassment policies, demographic participation goals, and local hiring ordinances.
Net Zero in Texas: The Role of Workforce Development
For this, IRA requires the U.S. Department of the Treasury to issue guidance on how contractors will show that they paid the prevailing wage and what constitutes a good-faith effort to hire apprentices, while the U.S. Department of Labor must establish appropriate classification guidelines to ensure that state and local laws do not undercut the legislation.
The investments that will directly support the energy workforce are summarized below.
1. American Energy Security and Domestic Manufacturing
• Production tax credits to accelerate U.S. manufacturing of solar panels, wind turbines, batteries, and critical minerals processing, estimated to invest $30 billion
• $10 billion investment tax credit to build clean technology manufacturing facilities, like facilities that make electric vehicles, wind turbines, and solar panels
• $500 million in the Defense Production Act for heat pumps and critical minerals processing
• $2 billion in grants to retool existing auto manufacturing facilities to manufacture clean vehicles
• $20 billion in loans to build new clean vehicle manufacturing facilities
• $2 billion for National Labs to accelerate breakthrough energy research
2. Decarbonization of the Economy
• $30 billion in targeted grant and loan programs for states and electric utilities to accelerate the transition to clean electricity
• $6 billion for a new Advanced Industrial Facilities Deployment Program to reduce emissions from the largest industrial emitters like chemical, steel, and cement plants
• $9 billion for Federal procurement of American-made clean technologies to create a stable market for clean products, including $3 billion for the U.S. Postal Service to purchase zero-emission vehicles
• $27 billion clean energy technology accelerator to support the deployment of technologies to reduce emissions, especially in disadvantaged communities
3. Investing in Communities and Environmental Justice
• Environmental and Climate Justice Block Grants, funded at $3 billion, invest in community-led projects in disadvantaged communities and community capacity-building centers to address disproportionate environmental and public health harms related to pollution and climate change
• $3 billion to support neighborhood equity, safety, and affordable transportation access with 4 competitive grants to reconnect communities divided by existing infrastructure barriers, mitigate negative impacts of transportation facilities or construction projects on disadvantaged or underserved communities, and support equitable transportation planning and community engagement activities
• $3 billion to support the purchase and installation of zero-emission equipment and technology at ports
• $1 billion for clean heavy-duty vehicles, like school and transit buses and garbage trucks
Additionally, the federal government also sought to establish mechanisms, consistent with applicable law, to prioritize grantmaking, federal loan programs, technical assistance, financing, procurement, or other existing programs to support and revitalize the economies of coal and power plant communities.28 The initial report by the National Energy Technology Laboratory, in consultation with stakeholders from the impacted communities, industries, academia, advocacy groups, labor unions, community development organizations, and local, regional, and tribal governments identified the 25 most impacted regions for coalrelated declines and recommended that:
• Use existing federal programs with potentially available funding totaling nearly $38 billion to provide immediate investments in the communities
• Provide grant funding for infrastructure projects, including, roads, broadband, water, and sewer system improvements, and local transportation to create immediate good-paying union jobs and lay the foundation for economic development
• Invest in resources to deploy innovative low-carbon technologies on power plants and industrial facilities and use technological advances to prepare traditional energy infrastructure for the energy transition
• Use funding programs to remediate abandoned mine lands, orphaned oil and gas wells, mine-impacted water, and brownfield to restore natural assets and reduce toxic
Net Zero in Texas: The Role
emissions that pose serious safety hazards and cause air and water contamination
• Fund small businesses, community development financial institutions, local non-profit organizations, and economic innovation hubs to support the local economic infrastructure necessary for economic revitalization
• Use grant funding for regional economic development aligned workforce development to enable the workforce for new markets and industries
• Engage key federal resources, including the National Labs and the National Academies, to provide regular reports to the chairs of the Interagency Working Group and the President on the progress of federal efforts to revitalize the communities. These priorities and investments are expected to help the federal government bring expertise on organized labor, economics, and workforce development, relevant traditional energy industries, and emerging energy industries secondary and postsecondary education, energy workforce development, and apprenticeship programs within state or local government, bringing underrepresented groups, including workers of color, women, veterans, and socioeconomically disadvantaged individuals into the workforce through the energy transition.29
Chapter 3: Workforce Development for the Energy Transition in Texas
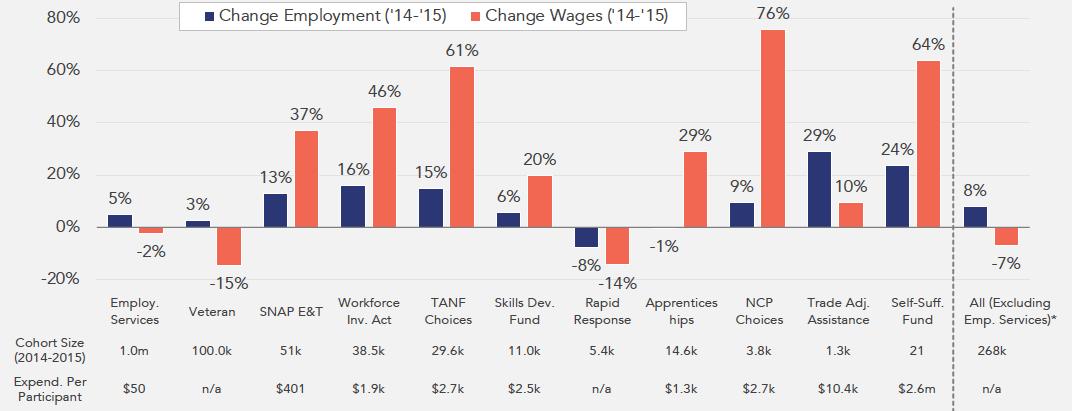
In 2021, the Texas Workforce Commission (TWC) reported that the state’s workforce experienced increased economic growth and job creation in the last quarter and recovered from the pandemicinduced slowdown. Overall, the state added more than 680,000 jobs in 2021, resulting in more than 13 million total jobs. However, the state identified the skills gap as a key issue, with middle-skill jobs being a stark gap. TWC found that about 63% of jobs in Texas are classified as middle skills, but only 33% of employed Texans had middle skills training in 2021. This is particularly concerning for the energy industry, as many of its manufacturing, construction, transportation, logistics, and wholesale trade jobs are classified in this category (mining, energy services, and utility-related jobs are high-skilled). These jobs earn an entry-level salary of about $49 per hour in the state. To address the skills gap challenge, the state invested nearly $18 million to help improve access to middle-skills jobs, including a mobile career pathways app and a career coaching program.30 A 2021 analysis31 found that even when enrollment increases in the TWC’s programs, employees may not experience an increase in their wages. These findings were based on enrollment data from 2014 and 2015 and are presented in Figure 8. The programs included some of the largest enrollments, like the Veterans programs and Rapid Responses, but resulted in an overall decline of 7% in wages as the supply of skilled workers did not match the industry’s ability to support them.
Figure 8. Change in employment and wages in 2014 and 2015 based on the Texas Workforce Commission’s programs. Source: Aim Hire Texas.
In 2020, Texas spent over $70 billion on education and workforce (Figure 9), with workforce development programs receiving $1 billion.
In 2020, 70% of Texas’ workforce funding flows originated from the federal government, were administered through TWC, and were awarded to regional workforce boards to run programs (Figure 9).


Figure 9. Expenditure on education and workforce in Texas (top) and Texas Workforce Development Programs Funding Flows (bottom). Source: Aim Hire Texas.
The 2021 analysis recommended that the state government must strengthen current tri-agency collaboration to support data modernization and longitudinal data linking efforts, adopt a more comprehensive state and local planning process using state workforce goals, and mobilize all career programs to maximize attractive Texas jobs of the future.32
3.1 Texas Workforce Commission and Texas Higher
Education Coordinating Board
The TWC has adopted three goals in its 2023-2027 strategic plan to address these gaps. The goals and objectives are outlined below, and the objectives are detailed in Appendix A, Table A14.
• Goal 1: Ensure the Texas workforce system supports employers and allows businesses and industries to thrive
• Goal 2: Ensure a skilled workforce is prepared and equipped to fill critical in-demand jobs, both now and in the future.
• Provide exceptional customer service and support to all workforce system stakeholders.
The state also administers the Skills Development Fund which provides training opportunities through collaboration among businesses, public community and technical colleges, Workforce Development Boards, and economic development partners.33 The Skills Development Fund provides job-training projects to increase the skills levels and wages of the workforce. Through its 2030 60x30 plan, the Texas Higher Education Coordinating Board (THECB) aims to:
• Help 60% of Texans ages 25-34 have a certificate or degree
• Ensure 550,000 students will complete a certificate, associate, bachelor’s, or master’s from an institution of higher education in Texas
• Ensure that all graduates from Texas public institutions of higher education will have completed programs with identified marketable skills
• Check undergraduate student loan debt such that it does not exceed 60% of first-year wages for graduates of Texas public institutions
THECB also provides Act grant funds to improve career and technical education in Texas through the Carl D. Perkins Career and Technical Education (CTE) grants and has partnered with the Greater Houston Partnership and Houston-area institutions to develop and implement programs and services through Grad TX 2.0 to help reengage, re-enroll, and match students to programs and institutions of interest to increase the number of Texans who successfully return to higher education and complete high-value credentials.34
3.2 Energy Industry Drivers for Workforce Development
In addition to the federal and state imperative for workforce development, a combination of factors is driving the prioritization of workforce development efforts for the energy industry in Texas. These include:
• Greater labor productivity, technological advancements, and increased efficiencies mean that fewer people are needed in existing jobs than before
• The pace of technological change means that skills become obsolete more quickly
• Fewer opportunities for reskilling and upskilling the current workforce
• Price crashes that are pandemic-induced and due to geopolitical shocks
Net Zero in Texas: The Role of Workforce Development
• Labor shortage and skills gap
• Supply chain bottlenecks
• License to operate issues - pressure to decarbonize from investors and stakeholders locally, nationally, and globally
• ESG reporting and disclosure, preparing for potential state and federal disclosure regulations
• Enhancing diversity, equity, and inclusion in the workforce
• Aging workforce
• Responding to the demands of the future workforceattracting, recruiting, and retaining younger talent while aligning with their values
• Lack of transferable skills among the younger workforce, absence of targeted skills and focused skilling efforts that can prepare the workforce for the future
• Disengagement with and discontinuation of company training programs
• Limited access to energy industry experts for the younger workforce
• Preserving assets and building new value chains and talent pipelines
• Understanding long-term risks and liabilities related to the energy transition
• Ensuring shareholder value
These issues are interdependent and contribute to the challenge of developing a robust and ready workforce. The key themes impacting workforce development in Texas are related to:
• People and Impact on Communities
• Environmental, Social, and Governance factors
• Technology Development and Leadership
• Economic Productivity and Impacts on the state’s GDP
Chapter 4: Scenarios for the Evolution of the Texas Energy Workforce
The state’s population is anticipated to grow from 30.5 million in 2023 to 54.4 million in 2050 and the GDP is likely to grow from $2.5 trillion in 2023 to $7 trillion by 2050.35 This would result in unprecedented changes for the Texas energy workforce and the state’s economy. This chapter discusses the methodology for evaluating the impacts on the workforce and economy resulting from:
• Electricity grid expansion, fuel switching, and emissions impact in existing/traditional energy industry segments
• Electricity grid expansion, fuel switching, and emissions impact in new energy industry segments
• Decarbonization of the on-road vehicle fleet in Texas
Our discussion of the changes in the Texas energy systems is modeled based on five electrification scenarios for the Texas grid and compared against the baseline of continuing to use diesel fuel. The electrification scenarios are:
a) Business-as-usual
b) High End-use Electrification, Unconstrained Energy Supply
c) High End-use Electrification, Constrained Renewables and Storage
d) High End-use Electrification, Unconstrained Renewables and Storage
e) Low End-use Electrification, Constrained Energy Supply
The Business-as-usual scenario was based on the National Energy Modeling System used in the U.S. EIA’s 2022 Energy Outlook scenarios. The remaining scenarios were growth scenarios relative to the business-as-usual. For the remaining scenarios, the capacity addition to the ERCOT grid was assumed to be the same as the base case, i.e., the business-as-usual case, up to 2025. From 2026 onwards, it was assumed that the capacity addition would change relative to the business-as-usual at the growth rate outlined below in Table 4. For example, renewables were assumed to grow annually at a rate of 2.7% in the “High End-Use Electrification, Unconstrained Energy Supply” scenario (case b), at 1.7% in the “High End-use Electrification, Constrained Renewables and Storage” scenario (case c), at 3% in the “High End-use Electrification, Unconstrained Renewables and Storage” scenario (case d), and at 0.7% in the “Low End-use Electrification, Constrained Energy Supply” scenario (case e).
As an example, the EIA predicts in its business-as-usual scenario that onshore wind would have a capacity of 36.91 GW in 2026. Based on the model described above, the onshore wind capacity
is expected to be 37.91 GW (2.7% higher than Business-as-usual), 37.54 GW (1.7% higher), 38.02 GW (3% higher), and 37.17 GW (0.7% higher) for the four scenarios, i.e., cases b through e, respectively. Further, based on this model, coal’s share of the grid declined under all scenarios and the decline rates were relative to the base case. Nuclear and hydropower capacity additions were the same across all scenarios and were assumed to be that of the base case. For new technologies that currently do not contribute to the ERCOT grid capacity and for CCUS and carbon dioxide removal (CDR) methods like direct air capture, we assumed that the state would incentivize deployment to reach a baseline capacity of 0.1 GW in 2025 (Figure 11) following which these new technologies could grow like onshore wind in Texas between 1999 and now (Figure 10).
For the development of infrastructure and adjacent industry development to support the above scenarios for electrification, we consider the significant government incentives, policies, and mandates like the production and investment tax credits, renewable portfolio standards, renewable energy credit trading program, and investment in Competitive Renewable Energy Zones (CREZ) and transmission infrastructure that have allowed onshore wind capacity additions to the grid to grow rapidly (Figure 10). We have assumed that the federal and state government will support, incentivize, and encourage the growth of pumped storage, hydrogen production, storage and use in fuel cells, solar thermal, offshore wind, CCUS, and CDR in a similar manner to achieve state and national decarbonization goals. These technologies follow the growth of onshore wind up to 2047 and have a 15% year-on-year growth between 2047 and 2050, which is like the growth of wind in the last three years in the state. The growth rates were adjusted relative to the high growth rate case for wind, such that the Highest growth rate scenario was discounted at 3.0%, at -1.7%in the Medium to High growth scenario over the base case, at -2.0% for the Low to Medium growth scenario, at -2.3% in the Low growth scenario, and at -2.7% in the Lowest growth scenario (Table 4). For example, pumped storage would increase from 0.1 GW in 2025 to 0.6 GW (similar to the growth of onshore wind in 2000 in Texas) in 2026 under the High End-use Electrification, Unconstrained Energy Supply scenario where the growth of storage is high, to 0.6 GW in 2026 (~500% growth, discounted by 2.3%) in the High End-use Electrification, Constrained Renewables and storage scenario where the growth of storage is low (Table A15 in the Appendix). We consider the methodology to implement the five scenarios described above for the deployment and growth of the infrastructure and adjacencies development. The assumed growth rates for different energy sources relative to the base case for existing technologies and relative to the growth rate for onshore wind in Texas for new technologies, and associated grid capacity additions are in Table A15 and Figure A1 in the Appendix.
Net Zero in Texas: The Role of Workforce Development
Table 4. Technology penetration and energy supply scenarios, year-on-year growth rates relative to the Business-as-usual scenario of the U.S. EIA’s 2022 Energy Outlook.
High End-use Electrification, Unconstrained Energy Supply
End-use Electrification, Constrained Renewables and Storage
High End-use Electrification, Unconstrained Renewables and Storage
Low End-use Electrification, Constrained Energy Supply

Figure 10. Capacity addition from onshore wind energy in Texas from 1999 to 2022. Data source: ERCOT.
Lastly, the lifecycle impacts of each energy source based on the IPCC’s Technology-specific Cost and Performance Parameters were utilized to calculate the emissions impact of each scenario.36 The lifecycle emissions, measured in a metric ton of CO2eq per GWh of electricity produced, are presented in Figure A2 in the Appendix.
We modeled the interactions between the transportation system, travel demand, and socioeconomic conditions to understand how the size of the fleet, sales, fuel use, and emissions will be impacted by population, population density, changes in demand for freight movement and logistics in Texas through:
• Regression analysis
• Survival analysis
• Life cycle analysis for emissions impact
• Scenario analyses for electricity grid expansion, fuel switching, and emissions impact
For the transportation value chain, we quantified vehicle and fuel demand based on travel and freight volume. These changes are analyzed across all on-road vehicle fleets (light-duty, medium-duty, and heavy-duty vehicles) under three scenarios business-as-usual, all new sales are ZEVs by 2040, and all new sales are ZEVs by 2050, and rail, aviation, and marine (freight and fleet segments). Additionally, an economic impact analysis using input-output modeling (using RIMS II-based modeling) was used to estimate changes in employment, income, and economic output due to changes in expenditures. Additional details are in Section 4.2.
Lastly, we used these grid expansion scenarios to quantify:
• Full-time-equivalent jobs added to the Texas economy
• Earnings in millions of dollars
• Economic output in millions of dollars
• Value added in millions of dollars
4.1 Jobs and Economic Development Impact Models
We used the Jobs and Economic Development Impact (JEDI) models from the National Renewable Energy Laboratory (NREL) to estimate the employment and economic impacts for each of the scenarios during the construction and operating phases across the following categories:
• On-site labor and professional services impacts include project developers, environmental and permitting consultants, road builders, concrete-pouring companies, construction companies, tower erection crews, crane operators, and operations and maintenance (O&M) personnel.
• Local revenues and supply chain impacts that occur in supporting industries. These are driven by the increase
Net Zero in Texas: The Role of Workforce Development
in demand for goods and services from direct on-site project spending. These include construction material and component suppliers, analysts and attorneys who assess project feasibility and negotiate contract agreements, banks financing the projects, all equipment manufacturers, and manufacturers of replacement and repair parts.
• Induced impacts include reinvestment and spending of earnings by direct and indirect beneficiaries like local restaurants, hotels, retail establishments, childcare providers, and any other entity affected by increased economic activity and spending occurring in the first two categories.
JEDI uses a basic input-output methodology and multipliers from the IMPLAN Group to estimate impacts on local labor, services, materials, or other components. These multipliers include national and regional economic and demographic data to calculate interindustry linkages and the relationships between changes in demand for goods and services, and the associated economic activity at the local, state, and regional levels. The results are based on the following categories:
• Impacts During Construction
• Project Development and On-site Labor Impacts
Construction and Interconnection Labor
Construction related services
• Local Revenue and Supply Chain Impacts
• Induced Impacts from Construction
• Impacts During Operations
• On-site Labor Impacts During Operations
• Local Revenue and Supply Chain Impacts
• Induced Impacts from Operations
• Total Impacts
• The sum of the impacts from the construction and operation phases
JEDI helped quantify the number of jobs, earnings, economic output, and value added to the state economy on a per-unit-ofenergy basis. These values were utilized to scale the economic
impact based on the capacity additions to the grid under each of the scenarios. The results were adjusted for inflation such that the reported values are in 2022 $ and include impacts beyond the energy workforce and industry across all sectors of the economy.
For the transmission infrastructure impacts, following the findings of a recent DOE analysis,37 and consistent with the electric grid scenarios outlined above, we assumed that Texas would need to double its investment and the expanse of transmission infrastructure (45,000 miles) to support capacity additions to the grid for a business-as-usual scenario, increasing population and urbanization, and to ensure grid reliability and resilience by 2050. Consistent with the EIA’s predictions, the investments would need to be 1.3 times by 2030 and 1.7 times by 2040 to incrementally achieve this goal. The transmission capacity expansions for the alternative grid scenarios are presented above in Table 5. We assumed that 47% of the expansions would be in urban areas or “in-town”, as categorized by JEDI, 30% in rural areas, and 23% “near town.” The transmission line economic impacts are based on 230 kV AC lines.
4.1.1. Limitations of the JEDI Model
In its discussion of JEDI’s methodology, NREL highlights the following limitations38:
• Results are an estimate and not precise forecasts
• Results reflect gross impacts and not net impacts
• The models cannot incorporate:
• Potential increases or decreases in electricity rates or fuel prices resulting from investments in new electricity or fuel infrastructure
• Local economic development losses associated with the possible displacement of other local energy sources
• The displacement of some other type of economic activity due to investment in the project
• Results are based on approximations of industrial inputoutput relationships that apply historical relationships between demand and the resulting economic activity to estimate how new expenditures will affect economic development metrics including jobs, earnings (wages and employer-paid impacts), and output, a general measure of economic activity. The accuracy of these inter-industry
Net Zero in Texas: The Role of Workforce Development
relationships is dependent on parameters including the date of the multipliers reflecting the relationships, how well the defined industrial sectors reflect the inputs and outputs of the technology project being studied, and how well the multipliers reflect the geography of where the technology project is located.
• Results assume that all industrial inputs and factors of production are used in fixed proportions and respond perfectly elastically, such that the impacts will typically be linear or directly proportional to the project size without accounting for economies of scale.
• Results are dependent on the accuracy and appropriateness of the project description.
• Results do not measure project profitability or viability and do not include intangible effects including improvements in transmission or grid reliability, changes in air or water emissions, changes in water use from power generation, or changes in land use.
4.2 JOBS Models
The JOBS models from the Argonne National Laboratory were used to calculate the workforce and economic impacts of hydrogen fuel cells (JOBS FC), utility-scale storage (JOBS FC), and infrastructure for the electrification of the on-road vehicle fleet (JOBS EVSE).
The model uses input-output modeling (using RIMS II-based modeling) and estimates changes in employment, income, and economic output due to changes in expenditures. These effects can be calculated for a state and within a regional economy in a census division. The impacts quantified using JOBS FC include the impacts of fuel cell production, installation and maintenance of the fuel cell and associated fueling infrastructure, fuel (primarily hydrogen) use, and the construction and operation of new fuel cell manufacturing capacity (Figure 11). The impacts quantified using JOBS EVSE include expenditures for electricity, network, and data fees, operating and maintenance costs, administration costs, potential revenues, access fees, and indirect effects on the economy such as through local spending (Figure 12).
The impacts of the electrification of the on-road vehicle fleet (light, medium, and heavy-duty vehicles) in Texas were analyzed under three scenarios.
a) Business-as-usual
b) All new sales are zero-emissions vehicles by 2050, with a ramp from 2022 to 2050 to achieve this goal
c) All new sales are zero-emissions vehicles by 2040, with a ramp from 2022 to 2040 to achieve this goal
IMPLAN
IMPLAN is an Input/Output (I/O) model that uses industry-specific multipliers to trace and calculate the flow of economic activity based on direct impacts, indirect impacts, and induced impacts. These multipliers are based on national and regional economic and demographic data to calculate inter-industry linkages and the relationships between changes in demand for goods and services, and the associated economic activity at the local, state and regional levels. State multipliers for employment, wage and salary, and output and personal spending patterns are used to quantify local impacts.
The rationale behind the quantifying the total impact is that new industrial or economic activity in a region results in a ripple effect that creates a total economic impact that is much larger than the initial input. The total impact of the new activity is the sum of the progressively smaller rounds of spending within the economy. Overall, the total economic impact creates measures of the value added to the gross domestic product (GDP), jobs, and tax revenue for federal and local governments.
JEDI
JEDI utilizes the multipliers and consumption patterns from IMPLAN to estimate the local economic activity and the resulting impact from new energy generation plants. Changes in spending patterns brought about by investments in power plants, fuel production facilities, or other projects are matched with appropriate industry multipliers. JEDI applies price deflators to account for changes in actual dollar value if the year for which the expenditures do not match the model's multiplier data year.
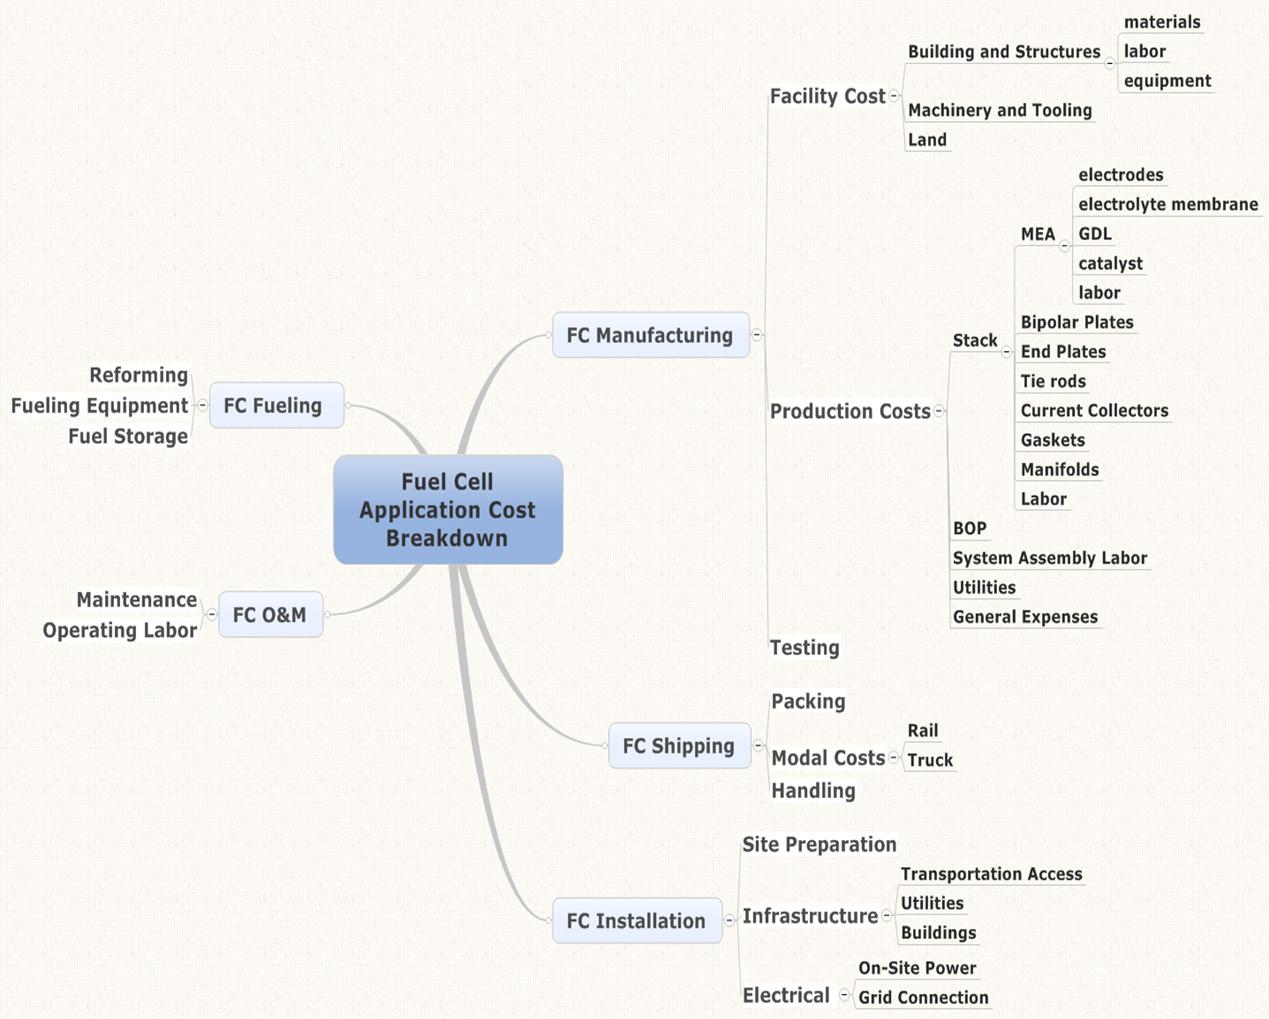
Figure 11. The types of transactions anticipated to support fuel cell manufacturing and deployment in early markets by the JOBS FC model. Source: Argonne National Laboratory

Figure 12. The EV infrastructure value chain that is considered in the JOBS EVSE tool. Source: Argonne National Laboratory
4.3 Jobs in Carbon Capture, Utilization, and Sequestration (CCUS) and Carbon dioxide Removal (CDR) from Ambient Air
The lifecycle emissions impact for each alternative grid expansion scenario were utilized to estimate the scale of CCUS and CDR. We did not model CCUS and CDR jobs for the business-as-usual estimates as the EIA assumed that many of the new technologies considered in our analysis like diurnal storage, offshore wind, and hydrogen fuel cells, will not grow in Texas by 2050. We scaled CCUS and CDR as the new electricity generation technologies in Texas described above, i.e., we assumed that both decarbonization technologies would follow the growth of onshore wind in the state. We utilized the job impacts from the post-combustion CCUS Petra Nova project in Texas to estimate the jobs added per MMt CO2 abated through CCUS and CDR.39
4.4 Limitations of the Scenarios and Models
The scenarios do not account for the jobs lost due to automation and improvements in technology over time. Additionally, they also do not account for the jobs gained from additional demand for petrochemical products and the jobs lost from the reduction in demand for transportation fuels. Lastly, the state’s nuclear and hydropower-related workforce will remain fairly stable between now and 2050.
4.5 Results
The results from the models are discussed below and are followed by a discussion of the implications on workforce development in Texas.
Jobs from Construction and Operations
Jobs during the construction and operations phases will scale with grid capacity additions and based on the source of energy. Overall, our results indicate that under the assumptions outlined in the previous chapter, jobs will decline by 93% between 2022 and 2050 for the business-as-usual scenario. In contrast, the addition of new technologies and scaling based on a steady growth rate up to 2050 under the alternative scenarios will result in a 96-125% increase in jobs during construction (96% for Low End-use Electrification, Constrained Energy Supply, 114% for High End-use Electrification, Unconstrained Energy Supply, 117% for High End-use Electrification, Unconstrained Renewables and Storage, and 125% for High End-use Electrification, Constrained Renewables and Storage).

Figure 13. Full-time Equivalent jobs added during construction in Texas based on the electricity grid in 2022 and across all scenarios in 2050. All impacts are across the economy and include indirect and induced effects beyond the energy industry.

Figure 14. Full-time Equivalent jobs added during operations in Texas based on the electricity grid in 2022 and across all scenarios in 2050. All impacts are across the economy and include indirect and induced effects beyond the energy industry.
Jobs during operations will decline by 95% between 2022 and 2050 for the business-as-usual scenario (Figure 14). In contrast, the addition of new technologies and scaling based on a steady growth rate up to 2050 under the alternative scenarios will result in a 228275% increase in jobs during operations (228% for Low End-use Electrification, Constrained Energy Supply, 232% for High End-use Electrification, Unconstrained Energy Supply, 253% for High Enduse Electrification, Unconstrained Renewables and Storage, and 275% for High End-use Electrification, Constrained Renewables and Storage).
The earnings from the jobs added during construction and operations will decline by 93% between 2022 and 2050 for the business-as-usual scenario, in 2022 $ (Figure 15). In contrast, an increase in earnings is observed for all alternative scenarios that will range between 203% for the High End-use Electrification, Unconstrained Energy Supply scenario to 215% for the High Enduse Electrification, Constrained Renewables and Storage scenario. Overall, the earnings added will range from $1.1 billion for the business-as-usual scenario to $35 billion for the High End-use Electrification, Unconstrained Energy Supply scenario.

Figure 15. Earnings from the full-time equivalent jobs added during construction and operations in Texas based on the electricity grid in 2022 and across all scenarios in 2050, in millions of 2022$. All impacts are across the economy and include indirect and induced effects beyond the energy industry.
Net Zero in Texas: The Role of Workforce Development

Figure 16. Economic output from the full-time equivalent jobs added during construction and operations in Texas based on the electricity grid in 2022 and across all scenarios in 2050, in millions of 2022$. All impacts are across the economy and include indirect and induced effects beyond the energy industry.
The economic output4 from the jobs added during construction and operations will decline by 94% between 2022 and 2050 for the business-as-usual scenario, in 2022 $ (Figure 16). In contrast, an increase in the output is observed for all alternative scenarios that will range between 92% for the Low End-use Electrification, Constrained Energy Supply scenario to 122% for the High Enduse Electrification, Constrained Renewables and Storage scenario. Overall, the economic output added to the state economy will range from $2.7 billion for the business-as-usual scenario to over $110 billion for the High End-use Electrification, Unconstrained Energy Supply scenario.
Meanwhile, the value added from the jobs added during construction and operations will decline at the same rate as economic output, i.e., 94% between 2022 and 2050 for the business-as-usual scenario, in 2022 $ (Figure 17), while an increase in the value is observed for all alternative scenarios that will range between 77% for the Low End-use Electrification, Constrained Energy Supply scenario to 102% for the High Enduse Electrification, Constrained Renewables and Storage scenario. Overall, the value added to the state economy will range from $1.6 billion for the business-as-usual scenario to $54 billion for the High End-use Electrification, Unconstrained Energy Supply scenario.
Additionally, the expansion of transmission lines to support the electric grid expansions can potentially add over 286,000- 430,000 jobs by 2050 which will result in over $27-40 billion in earnings, $52-77 billion in economic output, and $30-37 billion in value-added to the Texas economy. The detailed economic impacts are discussed in Table A16 and Figure A3 in the Appendix.
To mitigate the emissions from the grid and get to the target of net zero by 2050, Texas will also add jobs in CDR and CCUS. Figures 18a and 18b highlight the jobs that the state can add in 2030, 2040, and 2050 for CDR and CCUS, respectively, under the assumptions of this study. For CDR, jobs will grow about 40-fold by 2030, 135 to 200-fold by 2040, and 190 to 420-fold by 2050, depending on the
scenario. The most CDR jobs will be added for the High End-use Electrification, Constrained Renewables and Storage scenario and the least for the High End-use Electrification, Unconstrained Renewables and Storage scenario. Figure 18b highlights that CCUS jobs in the state can grow by about 20 to 25-fold by 2030, 100 to 135-fold by 2040, and 100 to 250-fold by 2050 as compared to the current jobs in the state. Specifically, the state will add the least jobs for the High End-use Electrification, Unconstrained Renewables and Storage scenario and the most jobs for Low End-use Electrification, Constrained Energy Supply scenario.
The JOBS EVSE tool quantifies direct, indirect, and impacts on employment from the electrification of the LDV, MDV, and HDV fleets (Figure 19). The direct impacts are classified as the effect on jobs, income, and revenue or sales associated with industries for which initial expenditures have been modeled, while the indirect impacts measure the changes in economic activity in supporting industries that result from the initial expenditures.
Lastly, induced impacts relate to spending by workers whose earnings are affected by changes in the final demand, also known as the household-spending effect. The sum of these effects is the total economic impact presented in Figure 20.
The jobs in Figure 19 include direct, indirect, and induced jobs for the stations, and in the electricity, advertising, retail, data and networking, and maintenance sectors during the station development phase and operations. More than 300,000 jobs will be added to the Texas economy by 2050 from the electrification of on-road transportation under the business-as-usual scenario.
The policy target of all new sales are ZEVs by 2050 will add 1.7 times the jobs than the business-as-usual scenario (more than 520,000 jobs), while the policy target of all new sales are ZEVs by 2040 will add 1.3 times the jobs compared to business-as-usual (more than 430,000 jobs).
Net
Zero in Texas: The Role of Workforce Development

Figure 17. Economic value added from the full-time equivalent jobs added during construction and operations in Texas based on the electricity grid in 2022 and across all scenarios in 2050, in millions of 2022$. All impacts are across the economy and include indirect and induced effects beyond the energy industry.

Figure 18a. Full-time equivalent jobs added from construction and operations in Texas from CDR between 2022 and 2050. All impacts are across the economy and include indirect and induced effects beyond the energy industry.

Figure 18b. Full-time equivalent jobs added from construction and operations in Texas from CCUS between 2022 and 2050. All impacts are across the economy and include indirect and induced effects beyond the energy industry.


Figure 19. Total employment from station development and station operations for L2 and DCFC stations. Jobs include direct, indirect, and induced jobs for the stations, and in the electricity, advertising, retail, data and networking, and maintenance sectors. All impacts are across the economy and include indirect and induced effects beyond the energy industry.
The economic output related to these jobs represents the total value of sales by producing enterprises including the value of intermediate goods used in production. The growth in jobs will add about $300 million to the Texas economy by 2050 in the business-as-usual scenario. The policy target of all new sales are ZEVs by 2050 will add about $540 million, while the policy target of all new sales are ZEVs by 2040 will contribute nearly $600 million in economic output by 2050.


Figure 20. Economic output in million $ from station development and station operations for L2 and DCFC stations. Impacts include direct, indirect, and induced jobs for the stations, and in the electricity, advertising, retail, data and networking, and maintenance sectors. All impacts are across the economy and include indirect and induced effects beyond the energy industry.
4.6 Policy Implications
Based on the results presented in this chapter, several key policy implications for the future of the energy workforce arise. These pertain to the state of the workforce and the economy in the business-as-usual scenario and the cost of inaction, the relative impacts of different decarbonization scenarios on the workforce and economy, the potential for growth in CDR and CCUS and the opportunities for workforce development, reskilling and upskilling that must be addressed through legislative prioritization.
In each of the scenarios, including business-as-usual, coal, oil, and natural gas jobs are lost (Table 5). This will result in a shrinking workforce and a wastage of highly skilled workforce if the skills from these industries are not translated to sectors like CDR and CCUS. Overall, the continuation of a business-as-usual pathway will result in a disadvantage for the state’s workforce and economy
Table 5. The number of jobs projected to be lost in coal, oil, and natural gas sectors for each scenario between 2022 and 2050. All impacts are across the economy and include indirect and induced effects beyond the energy industry.
Businessas-usual
High End-use Electrification, Unconstrained Energy Supply
High End-use Electrification, Constrained Renewables and Storage
High End-use Electrification, Unconstrained Renewables and Storage Low End-use Electrification, Constrained Energy Supply
Under all other scenarios, the state will gain jobs by investing in decarbonization alternatives, with the most gains if an all-of-the-above strategy is pursued (See Figure 21). Given the assumptions of our analysis, the highest job gains are in the areas of hydrogen (long-duration storage and fuel cells), solar PV, transmission, and distribution of electricity, and CCUS. If scaled appropriately, CCUS can grow to about 5-fold the current oil and gas workforce in the state and transform its energy workforce.
While federal and state initiatives discussed in Chapters 2 and 3 provide opportunities for workforce reskilling and upskilling, the mechanisms to achieve those targets, especially for middle-skill jobs are currently lacking. The impacts on communities, especially the energy workforce and socioeconomic vulnerable groups, ESG-related factors, technology development and leadership, and the state’s economic productivity are the predominant elements that are shaping workforce development in Texas. With an increasing number of employers expressing concerns over hiring challenges and only about 56% of Texas households earning a living wage, with starker inequities for disadvantaged communities and communities of color, leveraging the available incentives towards targeted resource mobilization for workforce development will be imperative, and must be prioritized in the state.
The scenarios do not account for jobs lost due to automation, but a per-gigawatt basis comparison of jobs gained across the alternative scenarios indicates that the most jobs will be added for scenarios that balance the capacity addition of renewables with liquid fuels, biomass, hydrogen, and CCUS and CDR (High End-use Electrification, Constrained Renewables and Storage followed by High End-use Electrification, Unconstrained Energy Supply). The scenario that assumed the highest growth for renewables and storage technology (High End-use Electrification, Unconstrained Renewables and Storage) will present a trade-off and result in the least jobs added on a per gigawatt of grid capacity basis. This is followed by low job growth for the scenario with the least end-use electrification, least growth in renewables and storage, and most and most growth in liquid fuels, CCUS, and CDR (Low End-use Electrification, Constrained Energy Supply). This highlights that an all-of-the-above approach to grid expansion, economic growth, and workforce development will deliver the highest impact for the state.

Figure 21. Full-time equivalent jobs per gigawatt of the electricity grid capacity in 2050 across the alternative scenarios.
To support workforce development for the all-of-the-above approach, state structures and institutions must align with federal priorities across education, workforce, and economic development. Identifying and strengthening strategies with key metrics, goals, targets, and timelines across sectors of the economy will be key to supporting to energy transition and a net-zero Texas by 2050. This will involve developing mechanisms that support optimized data and tools to help make better workforce decisions, preserve the state’s competitive socioeconomic advantage, connect Texans to appropriate jobs, provide a pathway for upskilling and reskilling, and provide opportunities for upward mobility. The skills of the workforce must be aligned for jobs of the future and the changing needs of the industry and the economy with a coordinated effort between educators, employers, and policymakers.
Table A1. Coal Wages by Industry Segment, 2019. Data Source: U.S. Energy & Employment Report 2020
Table A2. Electric Power Transmission & Distribution Wages by Industry Segment, 2019. Data Source: U.S. Energy & Employment Report 2020
Table A3. Comparison of traditional and new Electric Power Transmission & Distribution Wages by Industry Segment, 2019. Data Source: U.S. Energy & Employment Report 2020
Net Zero in Texas: The Role of Workforce Development
Table A4. Energy Efficiency Wages by Industry Segment, 2019. Data Source: U.S. Energy & Employment Report 2020
Table A5. Motor Vehicle Wages by Industry Segment, 2019. Data Source: U.S. Energy & Employment Report 2020
Table A6. Electricity Generation Wages by Industry Segment, 2019. Data Source: U.S. Energy & Employment Report 2020
Wages
Table A7. Fuels Wages by Industry Segment, 2019. Data Source: U.S. Energy & Employment Report 2020
Net Zero in Texas: The Role of Workforce Development
Table A8. Hydropower Wages by Industry Segment, 2019. Data Source: U.S. Energy & Employment Report 2020
Table A9. Natural Gas Wages by Industry Segment, 2019. Data Source: U.S. Energy & Employment Report 2020
A10. Nuclear
by Industry Segment, 2019. Data Source: U.S. Energy & Employment Report 2020
A11. Solar
by Industry Segment, 2019. Data Source: U.S. Energy & Employment Report 2020
Table
Wages
Table
Wages
Net Zero in Texas: The Role of Workforce Development
Table A12. Wind Wages by Industry Segment, 2019. Data Source: U.S. Energy & Employment Report 2020
Table A13. Storage Wages by Industry Segment, 2019. Data Source: U.S. Energy & Employment Report 2020
Table A14. Texas Workforce Commission Goals and Actions Items. Source: 2023-2027 Texas Workforce Commission Strategic Plan
Goal Objectives Action Items
Goal 1 Ensure the Texas workforce system supports employers and allows businesses and industries to thrive.
Provide timely, relevant workforce solutions that enable employers to find and retain the qualified workers needed to be successful and globally competitive.
a) Deploy rapid, creative, flexible, employer-driven, practical solutions to connect employers with workers of all skill and education levels.
b) Expand recruiting and hiring services provided by TWC and Local Workforce Boards to help employers build and maintain a robust workforce.
c) Assist employers in hiring and retaining workers who can work but need childcare and other critical workforce support services.
Engage with industry to address current and future workforce development needs.
a) Assess and expand workforce training services for employers to prepare skilled workers to meet employer needs.
b) Ensure apprenticeship, pre-apprenticeship opportunities, and other work-based learning strategies such as internships, mentorships, etc. are readily available and aligned with employer needs.
c) Assist employers in easily understanding and navigating workforce programs and resources that can benefit them
Goal 2 Ensure a skilled workforce is prepared and equipped to fill critical in-demand jobs, both now and in the future.
Goal 3
Provide exceptional customer service and support to all workforce system stakeholders.
Net Zero in Texas: The Role of Workforce Development
Assist workers in obtaining the skills necessary to fill critical occupations, as identified by industry.
a) Upskill the current workforce to fill in-demand jobs through work-based learning strategies and workforce and education services.
b) Develop and deploy programs to end the middle-skills gap.
c) Ensure alignment between training programs and associated credentials with in-demand, highwage occupations.
Connect a qualified workforce with employers.
a) Expand the development of high-quality work-based learning opportunities that provide workers with the skills and experience needed to fill in-demand jobs and ensure qualified workers are matched with hiring employers.
b) Support all individuals, including people with disabilities, veterans, foster youth, adult learners, and second-chance populations, to prepare them to achieve career success and close gaps in labor force participation.
c) Provide childcare to eligible families to facilitate their participation in the workforce.
d) Close the geographic and socioeconomic gap in talent distribution through programs, policy, and technology solutions
Prepare a skilled workforce to fill critical jobs in the future
a) Ensure childcare providers have the support necessary to provide quality early childhood learning programs.
b) Provide access to the labor market and career information for better-informed decision-making.
c) Support educational programs for students in Texas that inform and prepare them for high-skill, indemand jobs, and career success.
d) Align the talent development pipeline with employer demand for qualified workers.
Deliver quality customer service to every customer who interacts with the workforce system
a) Ensure that every workforce system customer receives timely, efficient, and beneficial services to address their needs.
b) Enhance the overall customer experience within the workforce system, providing multiple integrated pathways for customers to choose how they interact with the system.
Seamlessly integrate programs and coordinate services and make them easy for all workforce system stakeholders to access and navigate.
a) Ensure customers can easily navigate and are comprehensively served across all workforce programs.
b) Align and leverage resources available to support workforce development efforts through interagency partnerships and collaboration.
Maintain the highest levels of integrity, accountability, and efficiency across the workforce system and TWC programs.
a) Strengthen systems in place to reduce and eliminate fraud, waste, and abuse within TWC and all programs it administers.
b) Assist employers and workers with their unemployment insurance program needs by providing quality services.
c) Reduce discrimination in employment and housing through education and fair administration of employment and housing laws.
Net Zero in Texas: The Role of Workforce Development
Table A15. Assumed growth rates for different energy sources relative to the base case for existing technologies and relative to the growth rate for onshore wind in Texas for new technologies
High End-use Electrification, Unconstrained Energy Supply
High End-use Electrification, Constrained Renewables and storage High End-use Electrification, Unconstrained Renewables and storage
Pumped Storage
H 2 Fuel Cells
adapted to wind base case
adapted to wind base case
Electrification, Constrained Energy
CCUS
CDR
(Offshore)
adapted to wind base case
adapted to wind + (-2.0%)
adapted to wind base case
adapted to wind base case
Net Zero in Texas: The Role of Workforce Development
The grid capacity additions based on these assumptions are presented in Figure A1 below.


Figure A1. Business-usual- electricity ERCOT grid based on the National Energy Modelling System for the 2022 EIA Energy Outlook, and grid scenarios High End-use Electrification, Unconstrained Energy Supply, High End-use Electrification, Constrained Renewables and Storage, High End-use Electrification, Unconstrained Renewables and Storage, and Low End-use Electrification, Constrained Energy Supply.

Figure A2. Median lifecycle emissions impact for energy supply sources in tCO2eq/ GWh. The cumulative emissions include direct emissions, infrastructure emissions, supply chain emissions, and wherever applicable, biogenic CO2 emissions, albedo effect, and methane emissions.
Net Zero in Texas: The Role of Workforce Development
Table A16. Total full-time equivalent jobs, earnings, output, and value-added from the expansion of transmission lines (in-town, neartown, and rural) in Texas by 2030, 2040, and 2050. Earnings, Output, and Value-added are in million $. All impacts are across the economy and include indirect and induced effects beyond the energy industry.
Jobs
Business as Usual
Business as Usual
High End-use Electrification, Unconstrained Energy Supply
High End-use Electrification, Constrained Renewables and Storage
High End-use Electrification, Unconstrained Renewables and Storage
Low End-use Electrification, Constrained Energy Supply
Earnings
High End-use Electrification, Unconstrained Energy Supply
Business as Usual
Business as Usual
High End-use Electrification, Unconstrained Energy Supply
High End-use Electrification, Constrained Renewables and Storage
High End-use Electrification, Unconstrained Renewables and Storage
Output
High End-use Electrification, Constrained Renewables and Storage
High End-use Electrification, Unconstrained Renewables and Storage
Low End-use Electrification, Constrained Energy Supply
Low End-use Electrification, Constrained Energy Supply
Value Added
High End-use Electrification, Unconstrained Energy Supply
High End-use Electrification, Constrained Renewables and Storage
High End-use Electrification, Unconstrained Renewables and Storage
Low End-use Electrification, Constrained Energy Supply


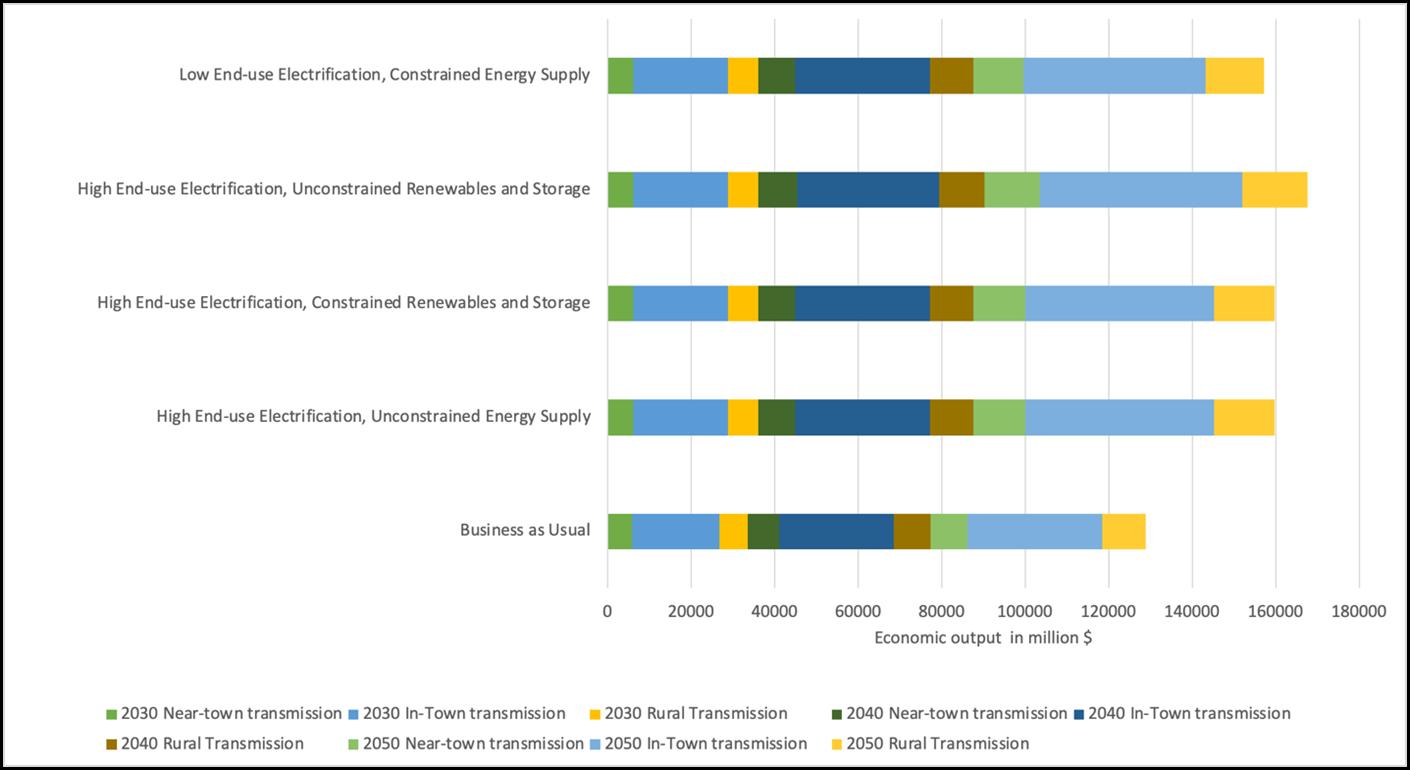

Figure A3. Full-time equivalent jobs, earnings, economic output, and value-added by 2050 in Texas from the expansion of transmission lines in Texas by 2050. Earnings, Output, and Value-added are in million $. All impacts are across the economy and include indirect and induced effects beyond the energy industry.
References
1 U.S. Bureau of Labor Statistics. Economy at a Glance- Texas. https://www.bls.gov/eag/eag.tx.htm
2 Federal Reserve Bank of St. Louis. 2024. Gross Domestic Product: All Industry Total in Texas https://fred.stlouisfed.org/series/TXNGSP
3 EIA. 2022. Texas State Energy Profile. https://www.eia.gov/state/ print.php?sid=TX
4 National Association of State Energy Officials. 2020. U.S. Energy & Employment Report. https://www.usenergyjobs.org/
5 National Association of State Energy Officials. 2022. U.S. Energy & Employment State Report. https://www.energy.gov/sites/default/ files/2022-06/USEER%202022%20-%20Texas.pdf
6 EDF. 2019. Texas’ clean energy economy. https://www.edf.org/ energy/texas-clean-energy-economy
7 Solar Energy Industries Association. 2022. Texas Solar. https:// www.seia.org/state-solar-policy/texas-solar
8 E2. 2021. Clean jobs America 2021. https://e2.org/wp-content/ uploads/2021/04/E2-2021-Clean-Jobs-America-Report-04-19-2021. pdf
9 Datta, A., Coates, S. Rossiter, A., and Krishnamoorti, R. 2024. Reskilling and Upskilling for the Energy Industry: The Role of Microcredential Programs for Workforce Development. The Journal of Continuing Higher Education. DOI: 10.1080/07377363.2024.2377777.
10 Slijk, C. and Phillips, K. 2021. Once-Oil-Dependent Texas Economy to Keep Growing as Renewable Energy Expands. Federal Reserve Bank of Dallas. https://www.dallasfed.org/research/swe/2021/ swe2103/swe2103b.aspx
11 Greater Houston Partnership. 2022. State of Houston’s Petrochemical Industry. https://www.houston.org/events/statehoustons-petrochemical-industry
12 Institute of Energy Economics and Financial Analysis. 2022. Texas oil and gas employment may not rebound to pre-COVID levels. https://ieefa.org/resources/texas-oil-and-gas-employment-may-notrebound-pre-covid-levels
13 Texas Comptroller of Public Accounts. 2022. Chemical Manufacturing Supply Chain. https://comptroller.texas.gov/ economy/economic-data/supply-chain/2021/chem.php
14 U. S. EIA. 2022. Electricity Data Browser. https://www.eia.gov/ electricity/data/browser/
15 Krishnamoorti R. and Datta A. 2022. Climate Resilience in Houston: Implications of the IPCC’s Sixth Assessment Report for Houston’s Climate Action Plan. UH Energy White Paper Series No. 02.2022. https://www.uh.edu/uh-energy/research/white-papers/whitepapers-files/uh-energy-white-paper-series-climate-resistance.pdf
16 Department of Energy. 2021. Energy Employment by State: 2021. https://www.energy.gov/sites/default/files/2021-07/USEER%20 2021%20State%20Reports.pdf
17 Boston Consulting Group. 2021. Report on Texas Education and Workforce System: Aim Hire Texas.https://assets.nationbuilder.com/ aimhiretexas/pages/22/attachments/original/1617900544/Report_ on_Texas_Education_and_Workforce_System.pdf
18 Bhat, N., Datta, A. and Krishnamoorti, R. Does Gen Z Care About The Energy Industry? https://www.forbes.com/sites/ uhenergy/2022/07/22/does-gen-z-care-about-the-energyindustry/?sh=5c51b7d42e76
19 Buttorff, G., Kennedy, R., Krishnamoorti, R., and Pinto, M. 2022. Environmental Stewardship and Employment Choices in Energy Evidence from a Survey of University of Houston Students. https:// www.uh.edu/uh-energy/research/white-papers/white-papers-files/ esg-uh-student-survey-09-02-22.pdf
20 Center for Energy Workforce Development. 2021. Gaps in the Energy Workforce 2021 Pipeline Survey Results. https://cewd. org/wp-content/uploads/2022/02/Gaps-In-Energy-CareersReport-2022_Final-pages.pdf
21 The U.S. White House. 2022. The Infrastructure Investment and Jobs Act will Deliver for Texas https://www.whitehouse.gov/wpcontent/uploads/2021/08/texas_infrastructure-investment-andjobs-act-state-fact-sheet.pdf
22 National Governor’s Association. 2022. What The Infrastructure Package Means For Workforce Development: Opportunities For Governors. https://www.nga.org/publications/what-theinfrastructure-package-means-for-workforce-developmentopportunities-for-governors/
22 JD Supra LLC. 2022. The Infrastructure Investment and Jobs Act: Key Takeaways for Employers https://www.jdsupra.com/legalnews/ the-infrastructure-investment-and-jobs-8998971/
23 IHS Markit. 2021. Economic impacts of transportation infrastructure. https://www.artba.org/wp-content/uploads/federalinvestment/iija/ARTBA_EIA_IIJA_Report_Sept2021.pdf
24 The U.S. White House. 2022.The Inflation Reduction Act Delivers Affordable Clean Energy for Texas. https://www.whitehouse.gov/ wp-content/uploads/2022/08/Texas.pdf
25 U.S. Department of the Treasury. 2022. Four Ways the Inflation Reduction Act’s Tax Incentives Will Support
26 Building an Equitable Clean Energy Economy. https://home. treasury.gov/system/files/136/Fact-Sheet-IRA-Equitable-CleanEnergy-Economy.pdf
27 The Center for American Progress. 2022. The Inflation Reduction Act Provides Pathways to High-Quality Jobs. https://www. americanprogress.org/article/the-inflation-reduction-act-providespathways-to-high-quality-jobs/
28 NETL. 2022. Initial report to the President on empowering workers through revitalizing energy communities. https://netl.doe.gov/ IWGInitialReport
29 Department of Energy. 2022. U.S. Department of Energy Begins Formation of the 21st Century Energy Workforce Advisory Board. https://www.energy.gov/policy/articles/us-department-energy-begins-formation-21st-century-energy-workforce-advisory-board
30 Texas Workforce Commission. 2021. Annual Report 2021. https:// www.twc.texas.gov/files/twc/2021-twc-annual-report-twc.pdf
31 Aim Hire Texas. 2021. Aim Hire Texas Workforce Issues. https:// texas2036.org/wp-content/uploads/2021/04/AHT-Initial-Findings. pdf
32 Texas Workforce Commission. 2022. Tri-Agency Strategic Framework for Work-Based Learning. https://www.twc.texas.gov/files/ agency/wbl-strategic-framework%20dec-2022-twc.pdf
33 Texas Workforce Commission. 2022. The Skills Development Fund. https://www.twc.texas.gov/businesses/skills-development-fund-employers
34 THECB. 2022. GradTX. https://www.highered.texas.gov/our-work/ empowering-our-students/exploring-college-options/grad-tx/
35 Texas Demographic Center. 2022. https://demographics.texas.gov/ AboutUs
36 IPCC. 2018. Technology-specific Cost and Performance Parameters. https://www.ipcc.ch/site/assets/uploads/2018/02/ipcc_wg3_ ar5_annex-iii.pdf
37 U.S. Department of Energy. 2022. DOE Launches New Initiative from President Biden’s Bipartisan Infrastructure Law To Modernize National Grid. https://www.energy.gov/oe/articles/ doe-launches-new-initiative-president-bidens-bipartisan-infrastructure-law-modernize.
38 NREL. 2022. Limitations of JEDI Models. https://www.nrel.gov/ analysis/jedi/limitations.html#:~:text=The%20JEDI%20model%20 does%20not,intangible%20effects%20from%20new%20projects
39 U.S. Department of Energy. 2017. Petra Nova - W.A. Parish Project. https://www.energy.gov/fecm/petra-nova-wa-parish-project
ABOUT UH ENERGY
UH Energy is an umbrella for efforts across the University of Houston to position the university as a strategic partner to the energy industry by producing trained workforce, strategic and technical leadership, research and development for needed innovations and new technologies.
That’s why UH is the Energy University.
ABOUT THE WHITE PAPER SERIES
UH Energy has partnered with faculty and thought leaders across the University of Houston to bring you the White Paper Series. This series is a collaboration of research reports examining pertinent topics throughout the energy sector and aims to provide leaders from industry, nonprofits and regulatory agencies with information they need to navigate the changing energy landscape.
While UH Energy already offers a popular symposium series focusing on key issues in the field and a blog hosted by Forbes.com intended to reach a wide audience, the White Paper Series, in contrast, is focused on distilling information on a variety of energy-related topics in a way that can help industry leaders prepare for the future.

EDITORIAL BOARD
Ramanan Krishnamoorti Vice President, Energy and Innovation University of Houston
Greg Bean Executive Director, Gutierrez Energy Management Institute
Ed Hirs Lecturer, Department of Economics, BDO Fellow for Natural Resources
Christine Ehlig-Economides Professor and Hugh Roy and Lillie Cranz Cullen Distinguished University Chair
Pablo M. Pinto Professor, Hobby School of Public Affairs and Director, Center for Public Policy
CONTRIBUTORS
Ed Bailey Communications Manager
Jose Gonzalez-Campelo Layout & Design
713-743-5355
uhenergy@uh.edu uh.edu/uh-energy-innovation/