
9 minute read
What feedstocks go into the production of biodiesel used in Germany?


» 2.4.1 Shares of feedstock in biodiesel consumed
According to data published by the Federal Office for Agriculture and Food (BLE), more than a total of 3.9 million tonnes of biofuels were credited in 2021 (quota year 2020: approximately 4.62 million tonnes). These included approximately 2.72 million tonnes of biofuels (biodiesel, HVO etc.) that replaced fossil diesel. At 1.063 million tonnes in total, palm oil is the primary feedstock, followed by used edible oils and fats at 0.772 million tonnes and rapeseed oil at approximately 0.6 million tonnes. Compared to the quota year 2020, the share of palm oil-based HVO declined particularly sharply by 0.52 million tonnes to 0.3 million tonnes. This was due to the diesel fuel standard, which provides for a maximum biodiesel incorporation rate of 7 per cent by volume; above this level, HVO is used to blend mineral diesel. The increase in the total amount in 2020 is due to the fact that the 6 per cent cap on greenhouse gas emissions had to be met exclusively through the physical use of biofuels that year. The option to carry over GHG quotas was reintroduced in 2021, maintaining the same quota level. This is why total demand for biodiesel and HVO in the quota year 2022 is expected to reach 2.5 million tonnes as the cap on greenhouse gas emissions is raised to 7 per cent. The creditable share of palm oil-based biofuels in final energy consumption in road and rail transport in the quota year 2022 amounts to 0.9 per cent. As from 2023, such crediting is no longer possible in Germany.
Advertisement
2.4 What feedstocks go into the production of biodiesel used in Germany?
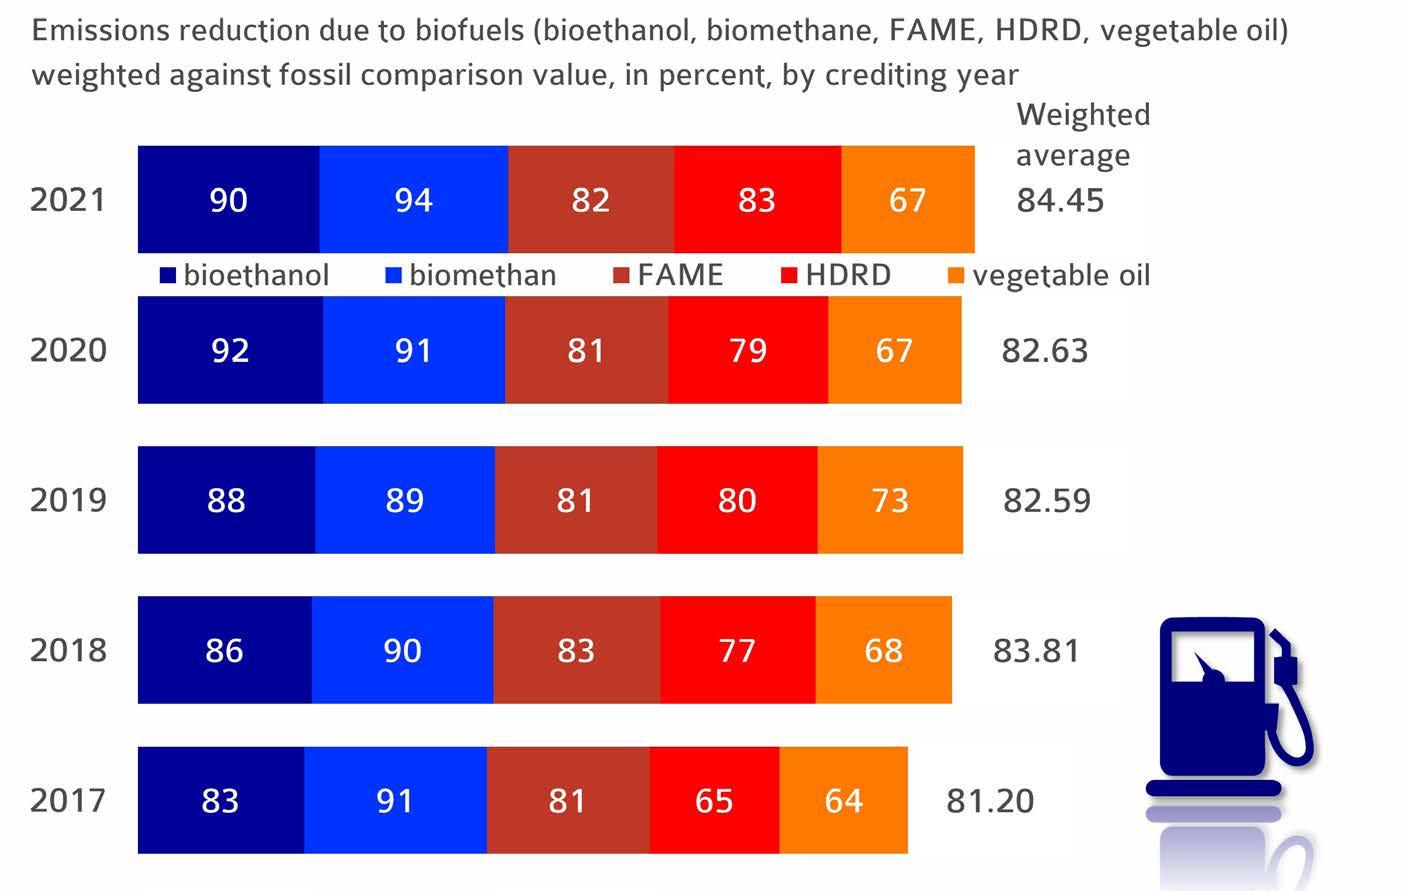
» 2.4.2 Emission saving
Greenhouse gas savings increases by 10 percentage point in 5 years
2.5 Where do the feedstocks for biodiesel at German petrol stations come from?
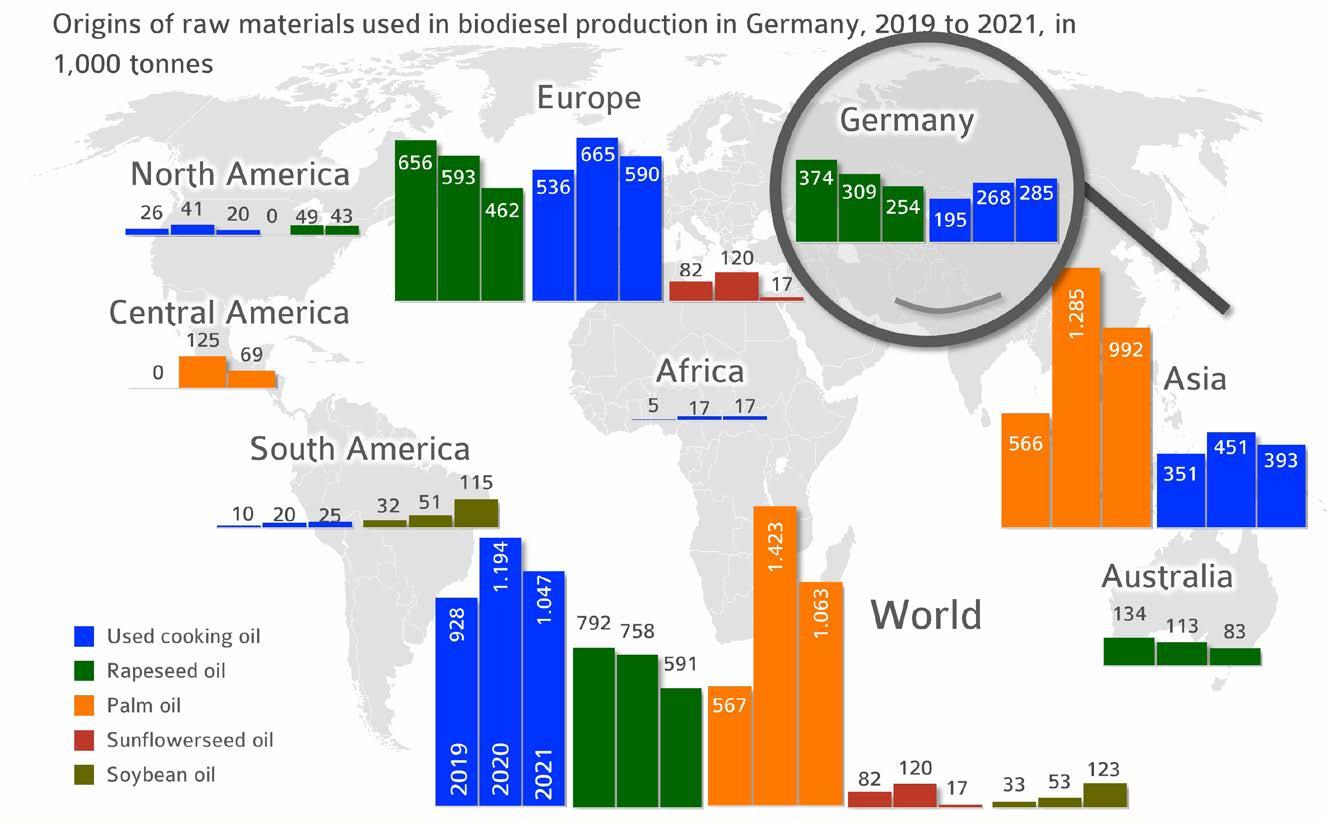
» 2.5.1 Origins of feedstocks for biodiesel used in Germany
In 2021, a total of 2.7 million tonnes of feedstocks were used to produce the biodiesel/HVO/vegetable oil that was placed on the market. Just less than 40 per cent came from Europe, mostly from Germany. The use of rapeseed oil amounted to 591,000 tonnes, most of which was sourced in Europe, except for a smaller amount that came from Australia and North America. The amount of waste oils (used cooking fats and oils, used deep-frying oils, etc.) decreased 12 per cent from the previous year, but continued to exceed the amount of rapeseed oil-based biodiesel The largest amount of imported used cooking fats and oils came from Asia, with volumes actually decreasing 13 per cent. Only deliveries from South America recorded a slight increase in 2021. Imports of palm oil from Indonesia and Malaysia saw a sharp drop of 23 per cent. Nevertheless, they still account for more than 60 per cent of the feedstock mix. The use of soybean oil from South America more than doubled. Sunflower oil was hardly used at all.
In Germany, high-quality information on biomass used in biofuel production is systematically recorded and stored in a database called Nabisy and published by the Federal Office for Agriculture and Food (BLE). The unique traceability system exclusively centers on biofuels marketed as transport fuels and heating fuels (CHP plants). These biofuels can then be counted towards the quota of greenhouse gas (GHG) emission reduction. A “Union database” with analogous documentation requirements is being created at EU level in 2023. These requirements apply to biofuels only.
Third-country imports predominate
© AMI 2022 | Source: BLE
3.1 What do biofuels have to do with feedstuff?
» 3.1.1 Output of rapeseed meal with and without biodiesel fuel production
The feed market is one of the main beneficiaries of biodiesel production, because rapeseed meal is generated as a by-product (approximately 60 per cent protein) of rapeseed oil production in oil mills. In 2021, German oil mills processed just under 9.5 million tonnes of rapeseed. The production generated just over 4 million tonnes of rapeseed oil and just over 5.4 million tonnes of rapeseed meal. Since rapeseed is produced in Europe without using genetic manipulation (GM), its by-product, rapeseed meal, is also classified as GMO-free. This classification promotes the use of rapeseed meal mainly in dairy feeding, where it can fully replace soybean meal and the corresponding imports from overseas. The key factor is demand for dairy products that qualify as “without GM”. The corresponding consumer demand thus also supports the regional production and processing of rapeseed. At the same time, it reduces the dependence on imports of GMO soy and GMO soy meal.
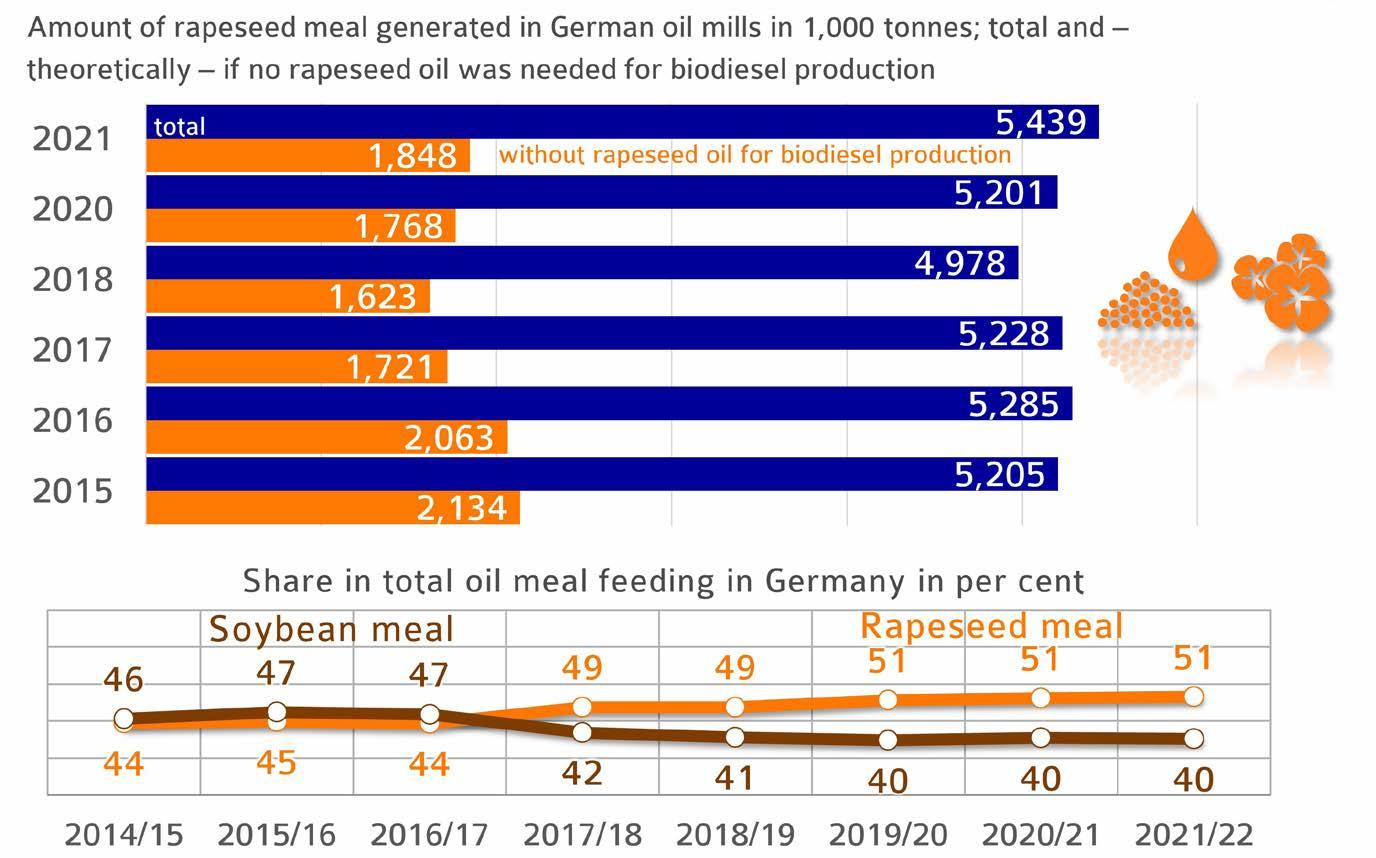
Of the full 4 million tonnes of rapeseed oil, just about one third was used for human consumption, whereas 66 per cent was used for technical purposes or to produce energy. If demand for rapeseed oil for use in biodiesel production were to shrink in the future, if biodiesel is no longer seen as a contribution towards decarbonising the transport sector, two thirds of rapeseed meal production would no longer be available. This would have been as much as 4 million tonnes last year. Annual soybean meal imports would have to be boosted by nearly 2.7 million tonnes to fill this gap. This volume translates to a soybean area of 1 million hectares. These imports would therefore reverse the trend of promoting domestic GM-free protein sources. Since 2012, rapeseed meal accounts for half of the meal fed to animals in Germany.
No rapeseed methyl ester – less rapeseed meal
© AMI 2022
Sources: BLE, AMI
3.2 Why is demand for oilseeds increasing?
» 3.2.1 Global consumption of meat by continent
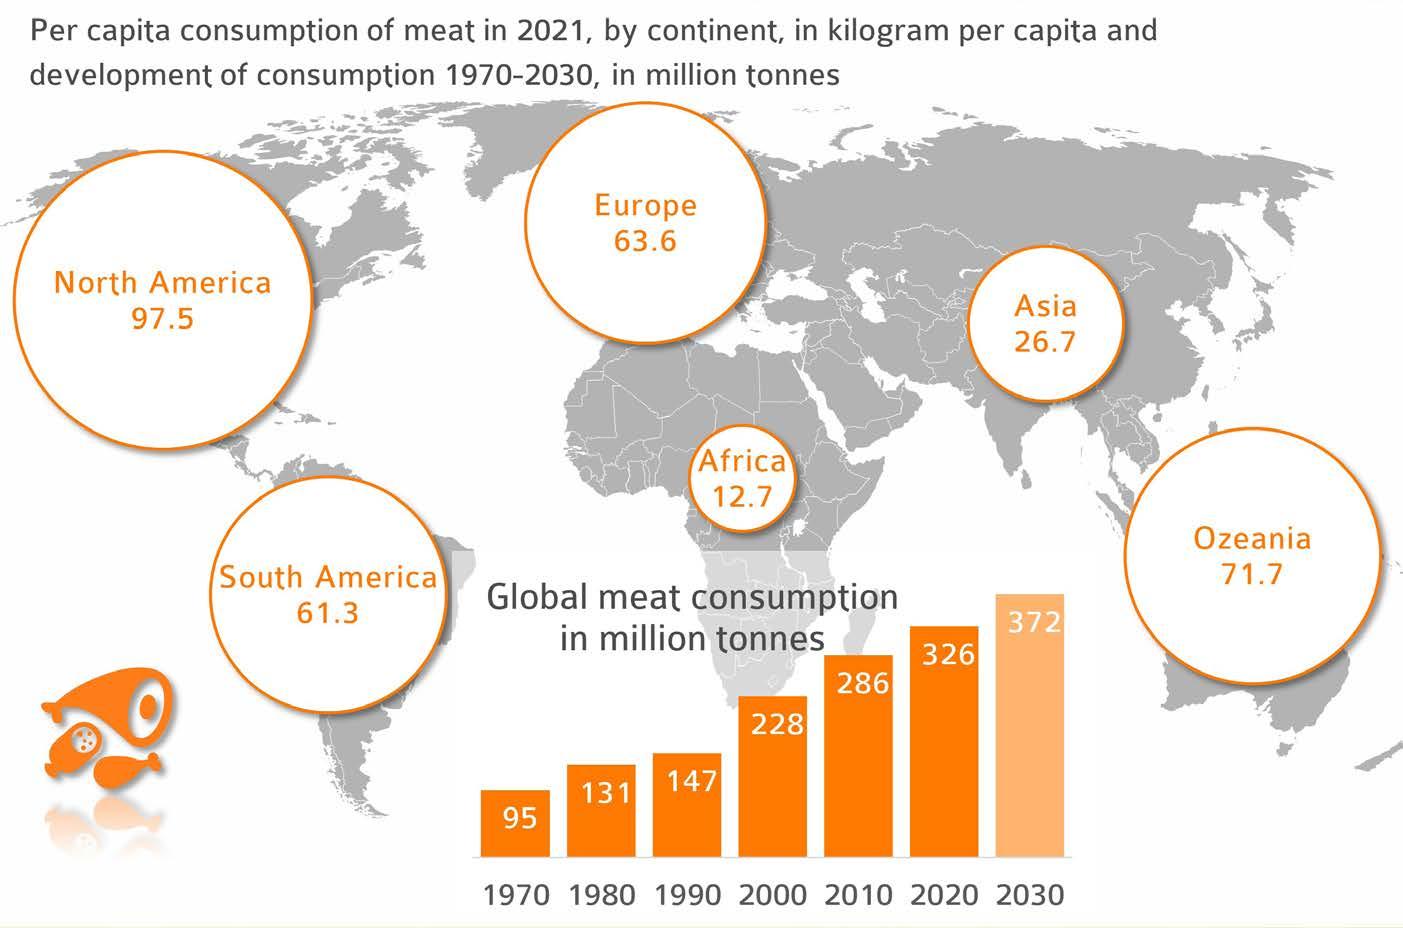
World meat consumption multiplied over the past 50 years to more than 370 million tonnes and is set to increase further in the years to come. The increase is not just driven by the growth in world population, but also depends on standard of living, eating habits and consumer price levels. Compared to other raw materials, meat involves high production costs and is therefore relatively expensive compared to other staple foods.
More and more feed must be produced for the growing number of livestock. Alongside grains, soybeans and rapeseed are the main sources of protein used in feeds. Both soybeans and rapeseed are used to make protein feed meal. On a global scale, most soybeans are grown from genetically modified (GM) seed, as is rapeseed in Canada. Because of the global surge in meat consumption, demand for feed protein from oilseeds is set to rise further in future. The European Union exclusively grows GM-free oilseeds like rapeseed, sunflowers and soybeans. Since demand for produce declared as “without GM” is growing, production of GM-free products is increasingly based on national or European oilseeds. This aspect is going to gain importance because, as part of the “Farm to Fork” strategy, EU climate change legislation is increasingly geared to sustainability and reduction of greenhouse gas emissions.
Meat consumption on a steady rise
© AMI 2022
Sources: FAO, OECD, UNO
3.2 Why is demand for oilseeds increasing?
» 3.2.2 Blending quotas for biodiesel
All round the world biofuels are promoted through statutory blending requirements. The motivation of the various countries differs greatly. Whereas US and Brazilian interests focus on security of supply in the energy sector and reduction of fuel imports, the EU places great importance on climate protection and an increase in the overall proportion of renewable energy generated. The goals in Asian countries, such as Malaysia, Indonesia or China, but also in Argentina, are different again. In these countries, the main objective is to reduce vegetable oil surplus in an effort to stabilise market prices. These countries’ national mandates for shares of volume or energy in fossil-energy diesel fuel range from 1 to 30 per cent.

The obligation to reduce greenhouse gas (GHG) emissions was imposed on petroleum companies in Germany in 2015 and was incorporated as an option in the EU Commission’s proposal to revise the Renewable Energy Directive (2018/2001/EG) – Red III. Distributors, that is the petroleum companies, must comply with these requirements. Globally, bioethanol plays the most important role in the majority of countries that have introduced quota requirements. Again, its use is driven by (sometimes temporary) oversupply in the grain and sugar markets. These biofuels not only go a long way towards the protection of climate and natural resources, but also help reduce pressure on the market and, consequently, stabilise prices for agricultural producers. Because of this, blending requirements are subject to change if overall conditions in the market change.
Blending quotas promote use of biofuels
© AMI 2021
Sources: Biofuels Digest, FAS, national reports
3.3 What is the amount of grain/vegetable oil per person?
» 3.3.1 Supply per capita
While the average per capita supply of cereals and vegetable oils has fluctuated over the past 60 years as overall world population has increased, it has shown an upward trend. The estimates for the 2022/23 marketing year are 343 kg of grain and 27 kg of vegetable oil per capita. This would be 10.1 kg per capita short of the previous year’s combined supply of 380.1 kg per capita, mainly due to smaller harvests in the northern hemisphere as a consequence of drought conditions. This figure includes the consumption of grains and vegetable oils for feed production purposes, transport fuel blending and other industrial purposes. Conversely, the amount of feedstock used in biofuels serves as supply buffer that can be diverted to food use for human consumption as needed. This puts a question mark on the EU Commission’s extensification policy resulting from the Green Deal, which stipulates blanket reduction targets for fertilising and crop protection products. The expected decline in output would deprive the market of commodity volumes for food supply and other application options in the bioeconomy.
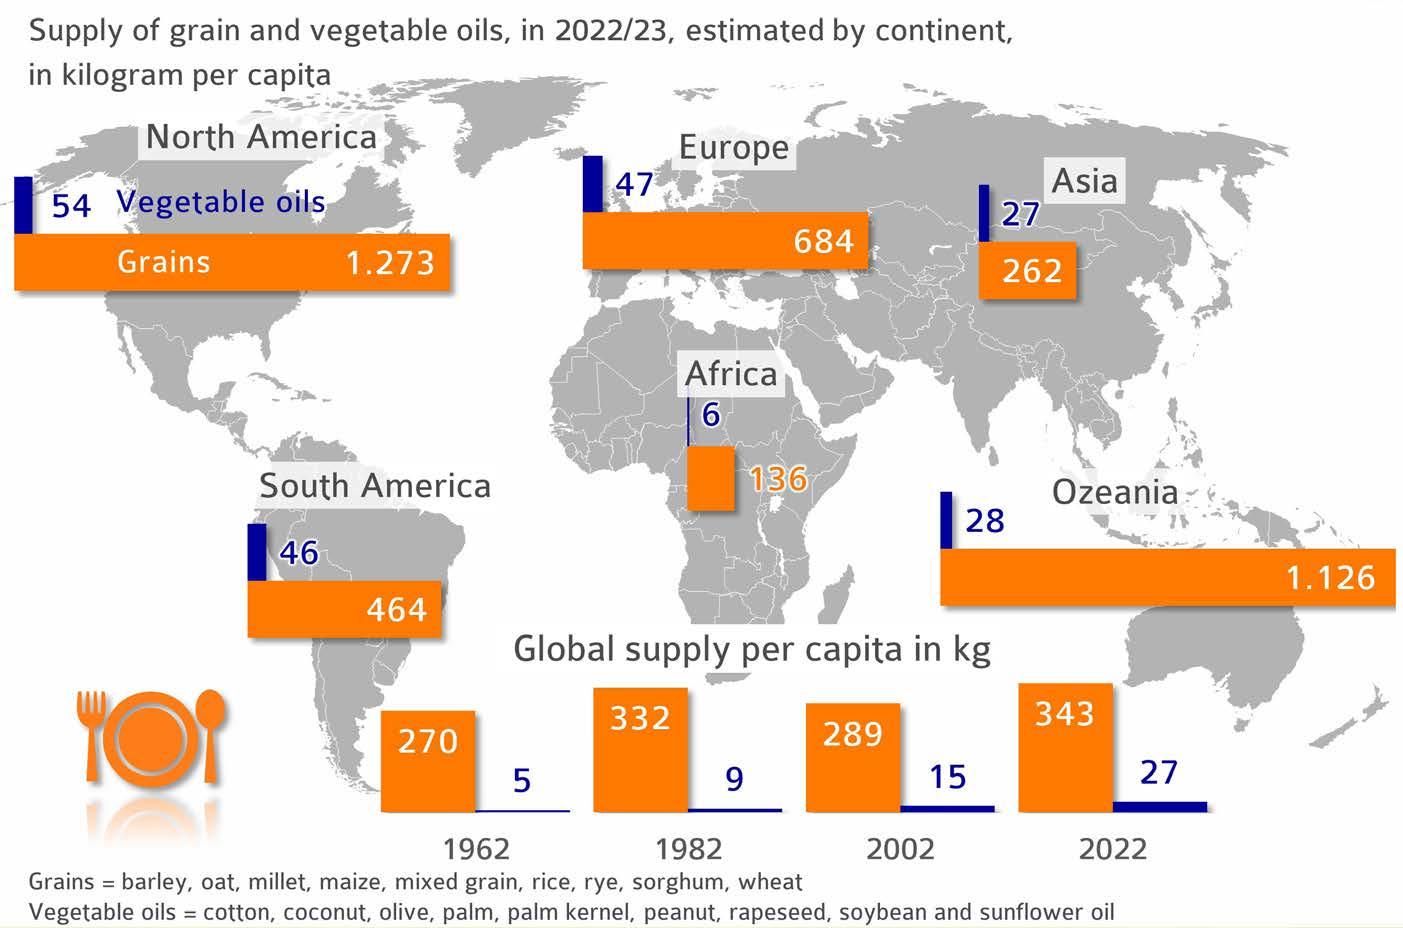
In purely arithmetic terms, food supply is sufficient to feed the world’s population. However, there are still huge differences between regions in the availability of agricultural feedstock. The differences go back mainly to distribution issues rather than competing use of raw materials for transport fuels or animal feedstuff. Moreover, there are substantial differences in purchasing power in the different countries. Per-capita income, cost of living and rate of inflation in the different countries should also be taken into account. However, we need a comparison between different shopping baskets and habits of consumption (e.g. cassava, millet in Africa) that would allow us to draw conclusions on per capita purchasing power.
Less grain available for Africa
© AMI 2022
Sources: FAO, USDA
3.4 Is there enough food?
» 3.4.1 The issue of distribution
People in many parts of the world starve or are malnourished although in terms of figures there is adequate supply of the most important staple foods. Along with climate change, natural disasters and poor transport and storage logistics, wars and forced migration are the main factors stoking hunger in the world. On top of this, international terrorism has become an increasing risk to people’s lives and safety in a growing number of countries. It is sadly true that to this day more money is spent on maintaining and spreading violence than on peace.
All these factors prevent economies from booming, farmers from farming in a cost-efficient manner and countries from establishing democratic structures without maladministration or corruption. Countries having no structures for a functioning social system run a much higher risk of famine and malnutrition. Where an appropriate framework is in place, it could be used as a base on which to intensify locally adapted cultivation systems in a sustained manner and, by so doing, create the foundation for supply with food that is equally sustained.
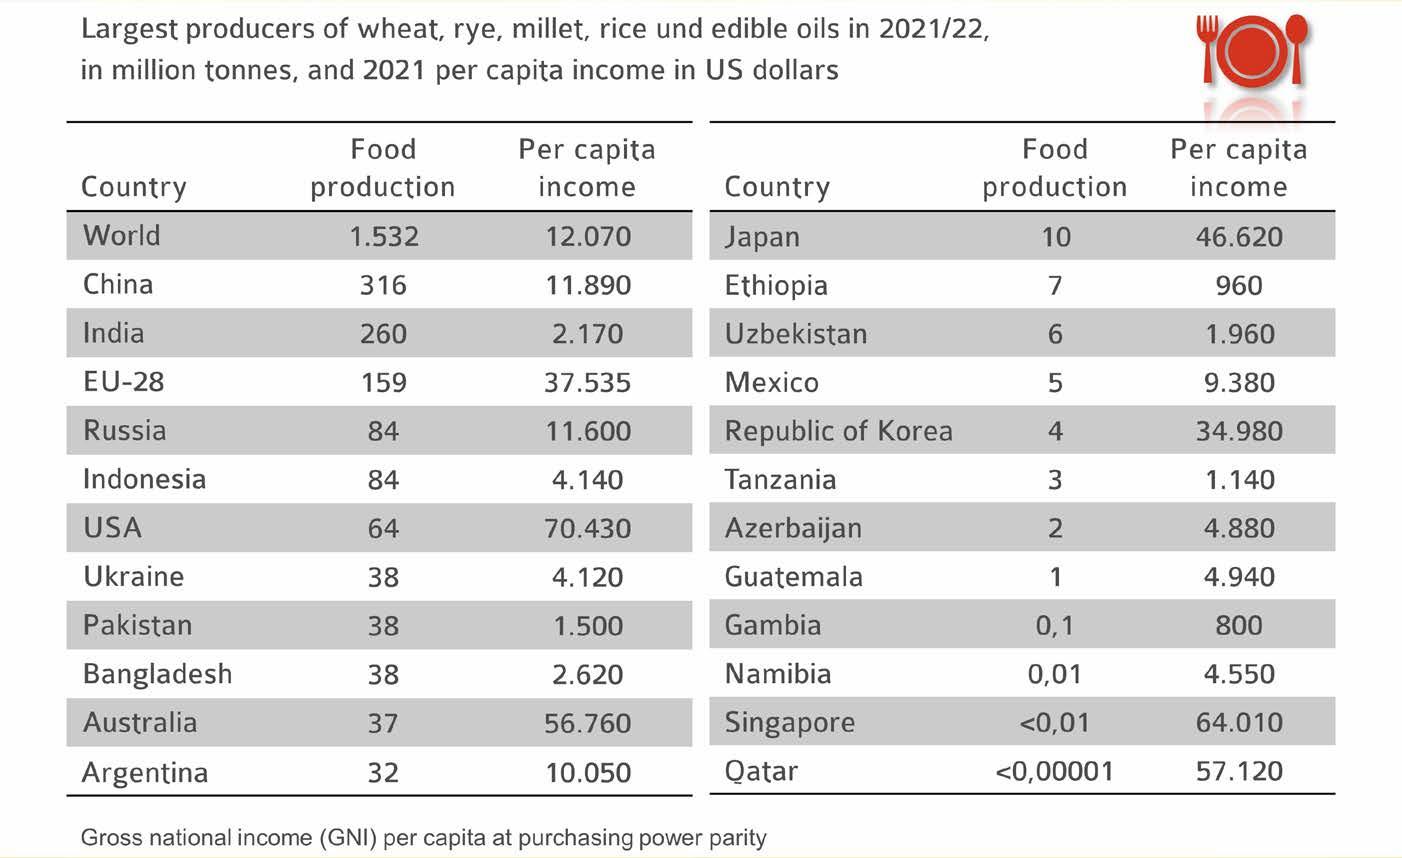
The currency used to measure purchasing power is the international dollar, which is based on the US dollar. The World Bank put the per capita purchasing power in Germany in 2021 at around 51.040 US dollars. In contrast, the purchasing power in Burundi was only 240 US dollars. Thus, despite an adequate supply of agricultural products, the available resources in countries with low purchasing power are not sufficient to buy the necessary amount of food. Famine is often also caused by a lack of purchasing power. The production of feedstock for biofuel production basically enlarges this supply. The lack of solidarity of the rich industrial nations with those affected is the reason why the means required to provide comprehensive emergency aid are not made available. A food-or-fuel debate distracts from where the responsibility actually lies.
Distribution issue just one of multiple reasons
© AMI 2022 Sources: World Bank, USDA
3.4 Why are people starving?
» 3.4.2 Food availability and climate change
The implications of climate change on agricultural production differ between regions.
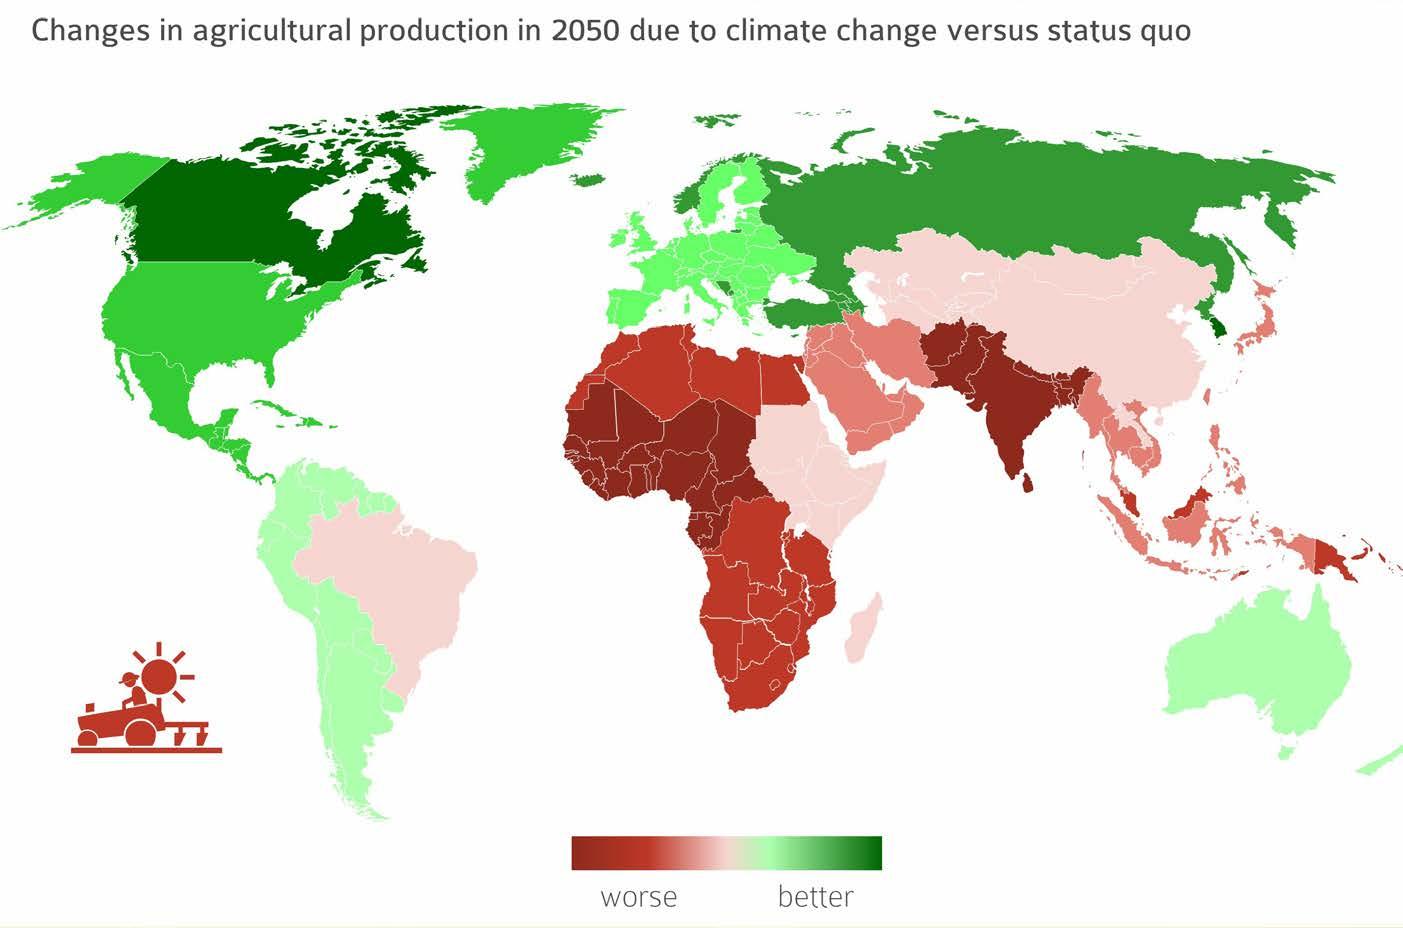
In many regions, the adverse impact of climate change on crop yields and agricultural production could be partially offset by intensifying agricultural land management or expanding agricultural land. At the same time, small family farms have no access to innovative technologies and plant production methods. This makes it harder for them to adapt to a changing climate.
Model calculations project that climate change will cause a falloff in agricultural output in many parts of Africa, the Middle East and India and South and Southeast Asia. In contrast, for countries at more northern latitudes, higher temperatures are expected to lead to a potential long-term increase in agricultural production, such as in Canada and the countries of the Russian Federation.
Differences in access to markets and technologies within and between countries will probably enhance the effects of climate change and potentially lead to a growing gap between developed and developing countries.


