
16 minute read
Table of Contents


» 1. Feedstock supply
1.1. How much grain is produced on a global scale?
Advertisement
1.1.1. Global grain production
1.1.2. Global stocks of grain
1.2. How much oilseed and vegetable oil is produced on a global scale?
1.2.1. Global oilseed production
1.2.1.1. Composition of the oilseeds
1.2.2. Global production of vegetable oil
1.2.2.1. Price development of vegetable oils
1.2.3. Global oilseed supply
1.2.3.1.Global vegetable oil supply
1.3. How much oilseed and grain does each continent produce?
1.3.1. Production of grain
1.3.2. Production of oilseeds
1.4. What products are made from grain?
1.4.1. Global use of grain
1.5. What products are made from oilseeds?
1.5.1. Global use of oilseeds
1.5.1.1. Global production of oils and meals
1.6. Production of pulses
1.6.1. Production in the EU-27
1.6.1.1. Production in Germany
» 2. Production of biofuels
2.1. Which countries promote biofuels?
2.1.1. Global output of bioethanol
2.1.1.1. Major bioethanol producers in the EU-27
2.1.2. Global output of biodiesel
2.1.2.1. Major biodiesel producers in the EU-27
2.2. What feedstocks are used in world biofuels production?
2.2.1. Global resource bases for biodiesel
2.3. What feedstocks are used in European biodiesel fuel production?
2.3.1. Resource bases for biodiesel in the EU-27
2.4. What feedstocks go into the production of biodiesel used in Germany?
2.4.1. Shares of feedstock in biodiesel consumed
2.4.2. Emission saving
2.5. Where do the feedstocks for biodiesel at German petrol stations come from?
2.5.1. Origins of feedstocks for biodiesel used in Germany
»
3. Food security
3.1. What do biofuels have to do with feedstuff?
3.1.1. Output of rapeseed meal with and without biodiesel fuel production
3.2. Why is demand for oilseeds increasing?
3.2.1. Global consumption of meat by continent
3.2.2. Blending quotas for biodiesel
3.3. What is the amount of grain/vegetable oil per person?
3.3.1. Supply per capita
3.4. Is there enough food?
3.4.1. The issue of distribution
3.4.2. Food availability and climate change
»
4. Land use
4.1. Does growing energy crops create a lack of land for food crops?
4.1.1. Shares of land used for biofuels production
4.1.2. Development of cropland
4.2. Is there a limit to the use of palm oil?
4.2.1. Global use of palm oil
4.3. What would protein feed supply be like if there was no biodiesel?
4.3.1. Land required for soybeans if German biodiesel production did not exist
»
5. Development of prices
5.1. Do biofuels push food prices up?
5.1.1. Comparison of prices of bread, bioethanol and grain
5.1.2. Comparison of prices of biodiesel and vegetable oil
»
6. Ukraine
6.1. Why the Ukraine war has such a big impact on the market
6.1.1. Ukraine is a key supplier to the world market
6.1.2. A lot of Ukrainian sunflower oil in the EU
6.1.3. Future plantings very uncertain
Editorial department, charts and descriptions: Agricultural Market Information Company (AMI) Department plant production
Editors: Svenja Herrmann, Nadja Pooch, Wienke von Schenck, Eike Wagner www.ami.informiert.de
Copyright for all charts: AMI GmbH
Editorial deadline: 16.12.2022
1.1 How much grain is produced on a global scale?
» 1.1.1 Global grain production
The world area planted with grain declined for the first time in three years. After a record of 699 million hectares of grain in the previous marketing year, the grain area in 2022/23 is projected at 689 million hectares. Especially the areas planted with barley and maize were reduced. More specifically, the barley area was cut by 2.7 per cent to 47 million hectares and the maize area by 2.3 per cent to 203 million hectares. The wheat and rice areas remained virtually unchanged at 220 and 64 million hectares respectively. However, it must be noted that in general, as a result of progress in plant breeding and improvement of agricultural production practices (fertiliser applications, pest and disease control, reduced losses at harvest and in storage), world grain production has continuously increased over the past decades. Since 1972/73 the output of maize almost quadrupled and that of wheat and rice more than doubled, although farmers in key producing countries of the northern hemisphere once again had to cope with drought and extreme heat. Maize is in first place, which underlines its growing global importance for supplying the animal feed sector and for bioethanol production, especially in the USA. Barley, like maize, is mainly used to feed livestock. In contrast, rice and wheat are primarily used for human consumption.
Acreage for cereals below previous year
© AMI 2022 | Sources: FAO, USDA
1.1 How much grain is produced on a global scale?
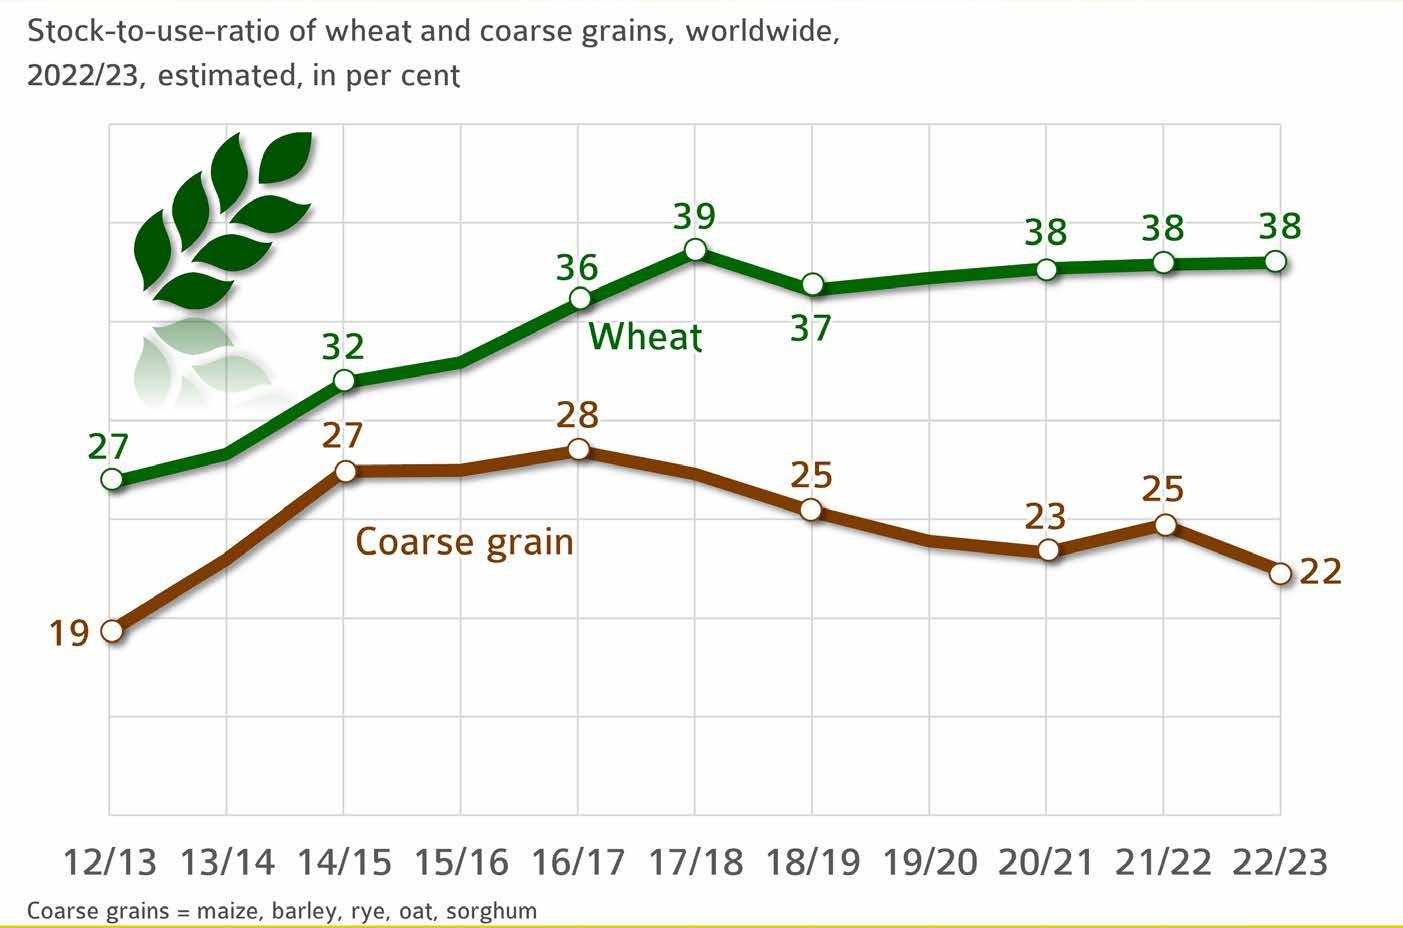
» 1.1.2 Global stocks of grain
The ratio of supplies to consumption (also called the stock-to-use ratio) is a key figure in estimating supply and, consequently, potential price trends. The lower the ratio, the faster supplies are absorbed. Also, a low ratio leads to rising prices. In 2022/23, wheat production is set to increase year-on-year, exceeding projected consumption. In other words, global ending stocks are seen to increase further and the stock-to-use ratio is set to rise for the fourth consecutive year. The projected ending stocks 2022/23 would cover up to 38 per cent of calendar year demand, a slightly stronger result than a year earlier. In the case of coarse grains, 2022/23 ending stocks are expected to decline due to a drop in production to 1,467.2 million tonnes. As a consequence, the ratio decreases to 22.4 per cent. This is the lowest value since 2012/13. It means that the share is below the long-standing average of 24.9 per cent. This may well lead to strong prices for coarse grains in the current marketing year.
Supply and demand estimate based on the stock-to-use-ratio
© AMI 2022 | Source: FAO
1.2 How much oilseed and vegetable oil is produced on a global scale?
» 1.2.1 Global oilseed production
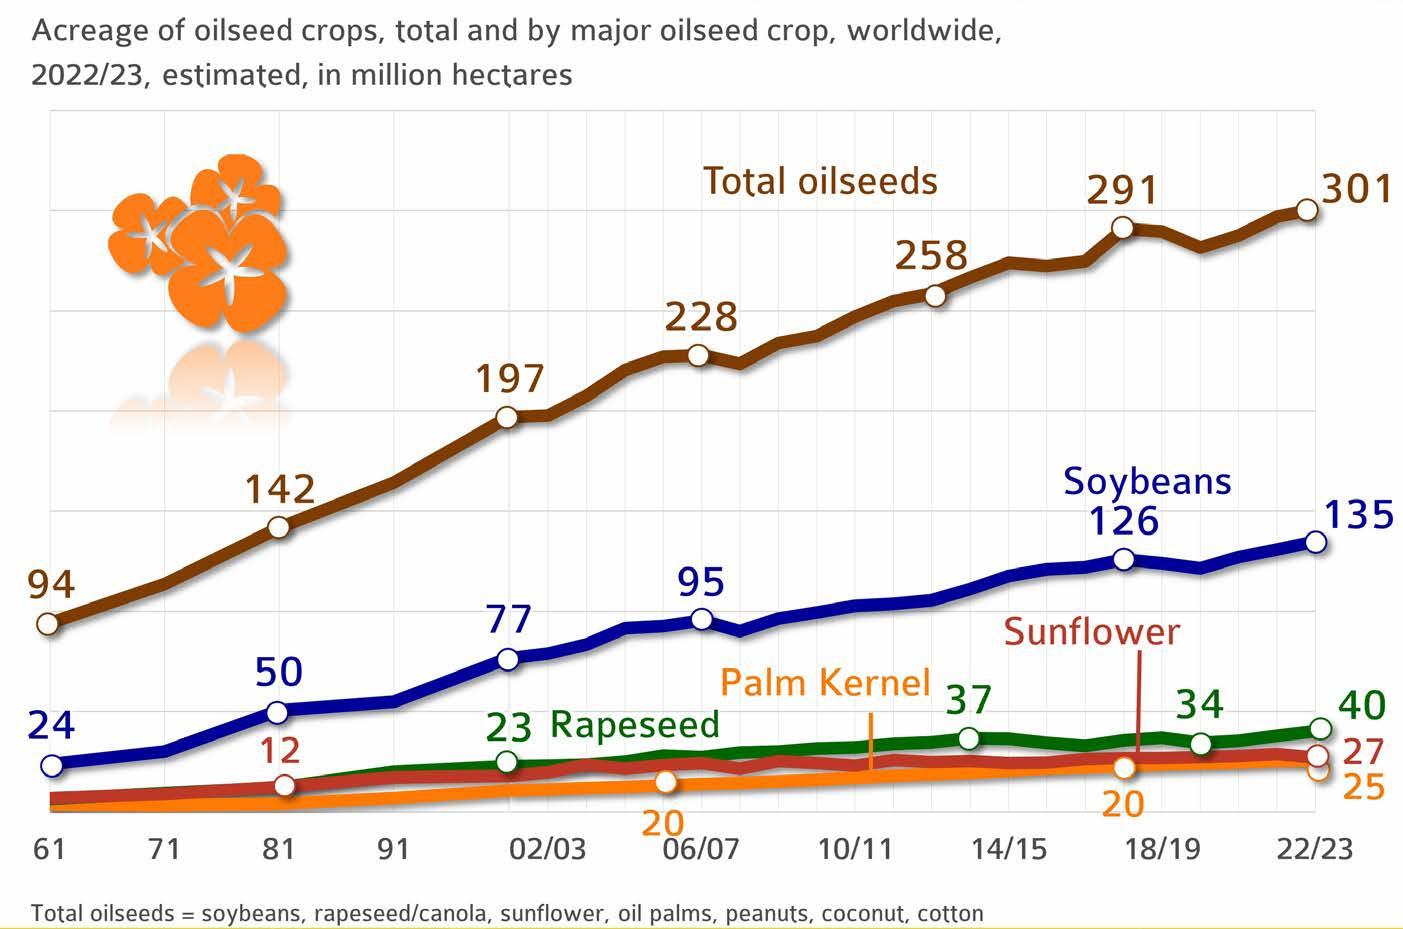
In the 2022/23 marketing year, around 301 million hectares will be planted with oilseeds. This translates to an increase of just over 1 per cent over the previous year. For years now, the increase in global demand for high-quality feed protein has led to an expansion in soybean area, especially in South America. On a global scale, soybean is the number one oilseed crop, accounting for just less than 45 per cent of world oilseed production, followed by rapeseed with 40 million hectares (+ 2 million hectares on the previous year). The expansion in soybean area is considered to be one of the contributors to growing deforestation in Brazil. The EU Commission’s proposal for a regulation on deforestation-free products was approved in the trialogue proceedings at the beginning of December 2022 and now has to be implemented as of this marketing year. The requirement of a dated proof of land use for the purpose of market access has been standard practice since 2008 for the sustainability certification of biofuels from cultivated biomass – including for deliveries from third countries. The new regulation sets 2020 as the cut-off year.
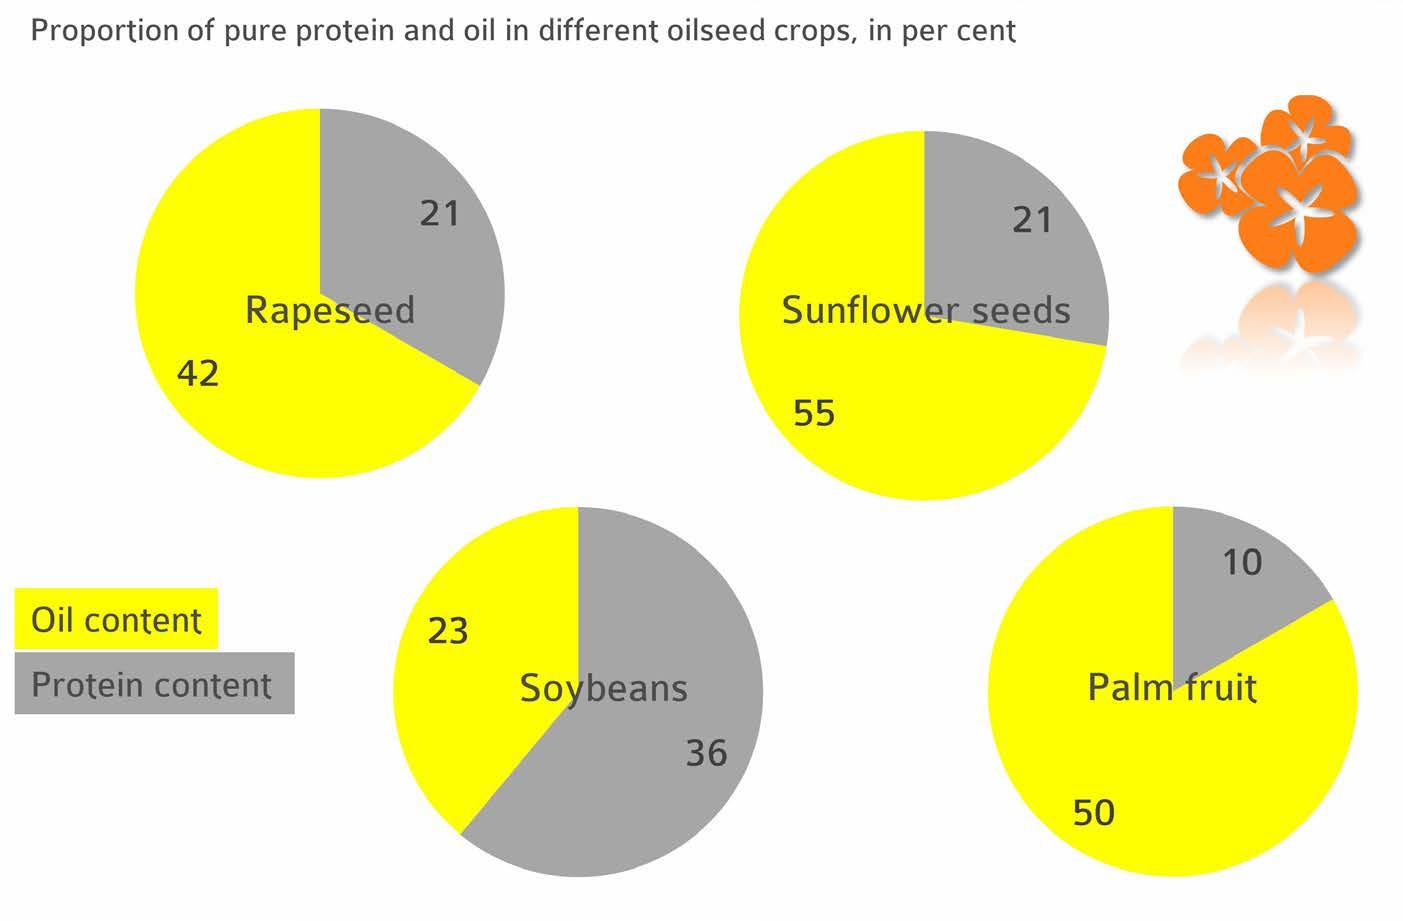
Oilseed crops differ in oil and protein content as well as fatty acid composition and protein quality, along with their climate and soil requirements. These factors have a determining influence on the price of the oilseed crop in question. This especially applies to protein quality, because soybean is also the most valuable source of protein in terms of quality. For this reason, rapeseed breeders are working intensively on improving the protein quality of rapeseed. The UFOP is supporting a number of different project proposals relating to the use of rapeseed protein in animal feed and the human diet to raise this added-value potential. Some of the latest research results were presented during a UFOP conference: https://www.ufop.de/ufop-der-verband/ufop-online-fachtagung
Soybean acreage in first place worldwide
© AMI 2022 | Sources: FAO, USDA
1.2 How much oilseed and vegetable oil is produced on a global scale?
» 1.2.1 Global oilseed production
1.2.1.1 Composition of the oilseeds
Sunflowers habe the highest oil content
1.2 How much oilseed and vegetable oil is produced on a global scale?
» 1.2.2 Global production of vegetable oil
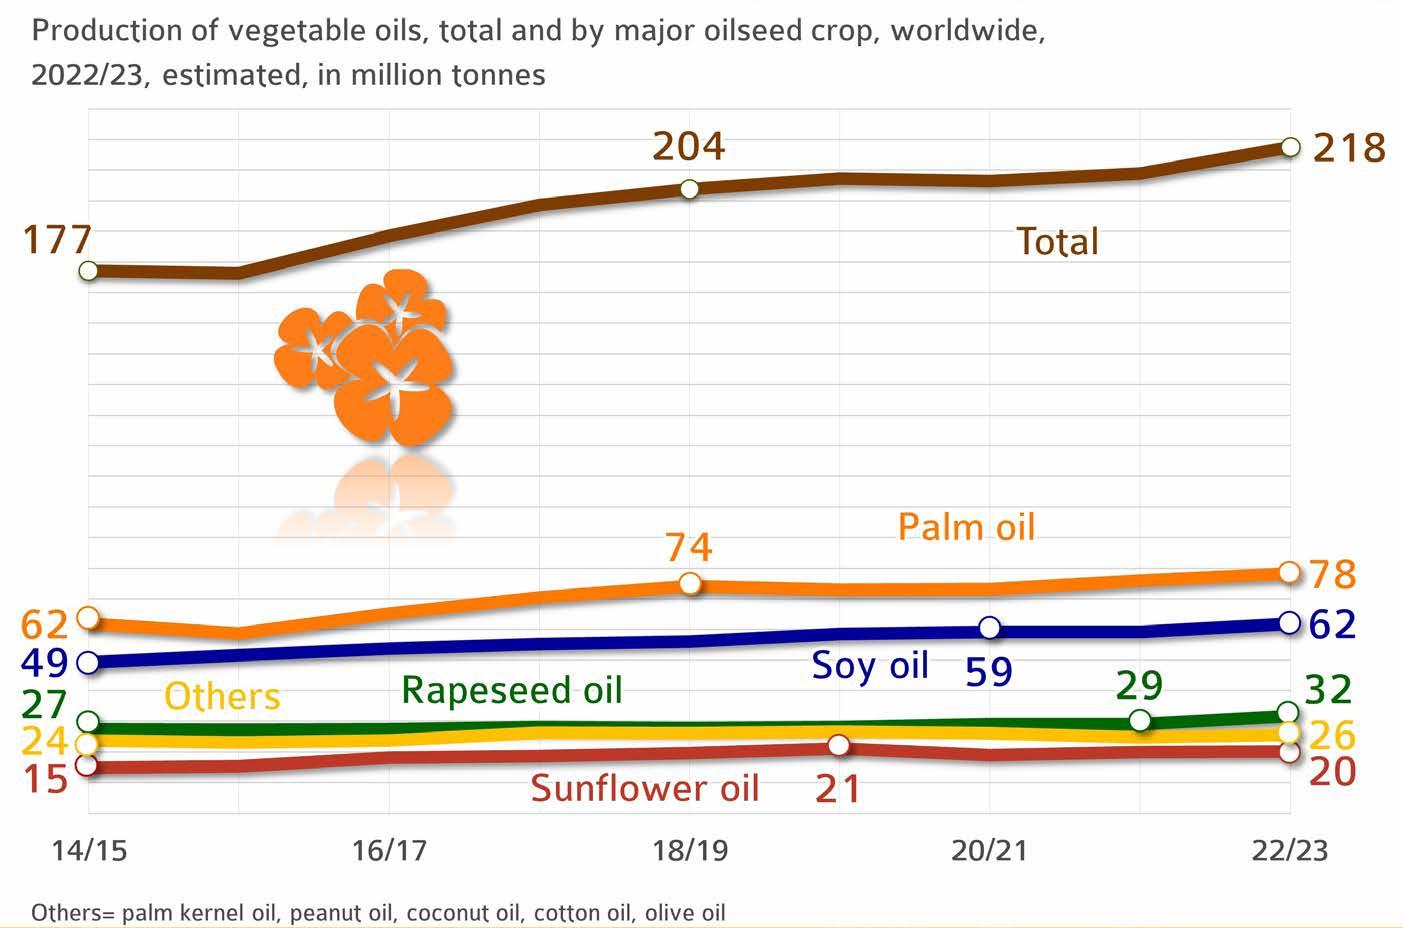
Global production of vegetable oil is set to reach new record highs in 2022/23 with all oils increasing, according to information published by the US Department of Agriculture. At the time of going to print, global production in 2022/23 was estimated at less than 219 million tonnes, up just less than 8 million tonnes on 2021/22. In other words, production will presumably fully cover demand of 213.8 million tonnes in the current crop year. Palm and soybean oil account for 64 per cent of world vegetable oil production. Rapeseed oil occupies third place, accounting for almost 14 per cent, followed by sunflower oil with just under 9 per cent of world output. Global output of vegetable oil is set to exceed the level of 200 million tonnes for the fifth year running in the 2022/2023 marketing year.
Palm oil is set to remain the most important vegetable oil, accounting for just less than 36 per cent and with an output of approximately 78.2 million tonnes, a rise of 2.3 million tonnes compared to 2021/22. Indonesia remains the largest palm oil producer with an output of 45.5 million tonnes, followed by Malaysia with 18.8 million tonnes and Thailand with 3.3 million tonnes. Production of soybean oil is expected to rise 4 per cent to a new record high of 61.9 million tonnes based on bigger harvests. China, the most important importer of soybeans in the world, remains the primary soybean oil producer with production amounting to 17.2 million tonnes, whereas the US ranks second with 11.9 million tonnes. Production of sunflower oil will probably increase only 1 per cent to 20.1 million tonnes due to smaller harvests in Eastern Europe and the EU-27. On the other hand, global rapeseed oil production is seen to rise 9 per cent to 31.7 million tonnes based on strong global rapeseed supply. Palm and soybean oil account for 64 per cent of world vegetable oil production. They are followed by rapeseed oil, accounting for 14 per cent, and sunflower oil, accounting for just over 9 per cent.
1.2 How much oilseed and vegetable oil is produced on a global scale?
» 1.2.2 Global production of vegetable oil
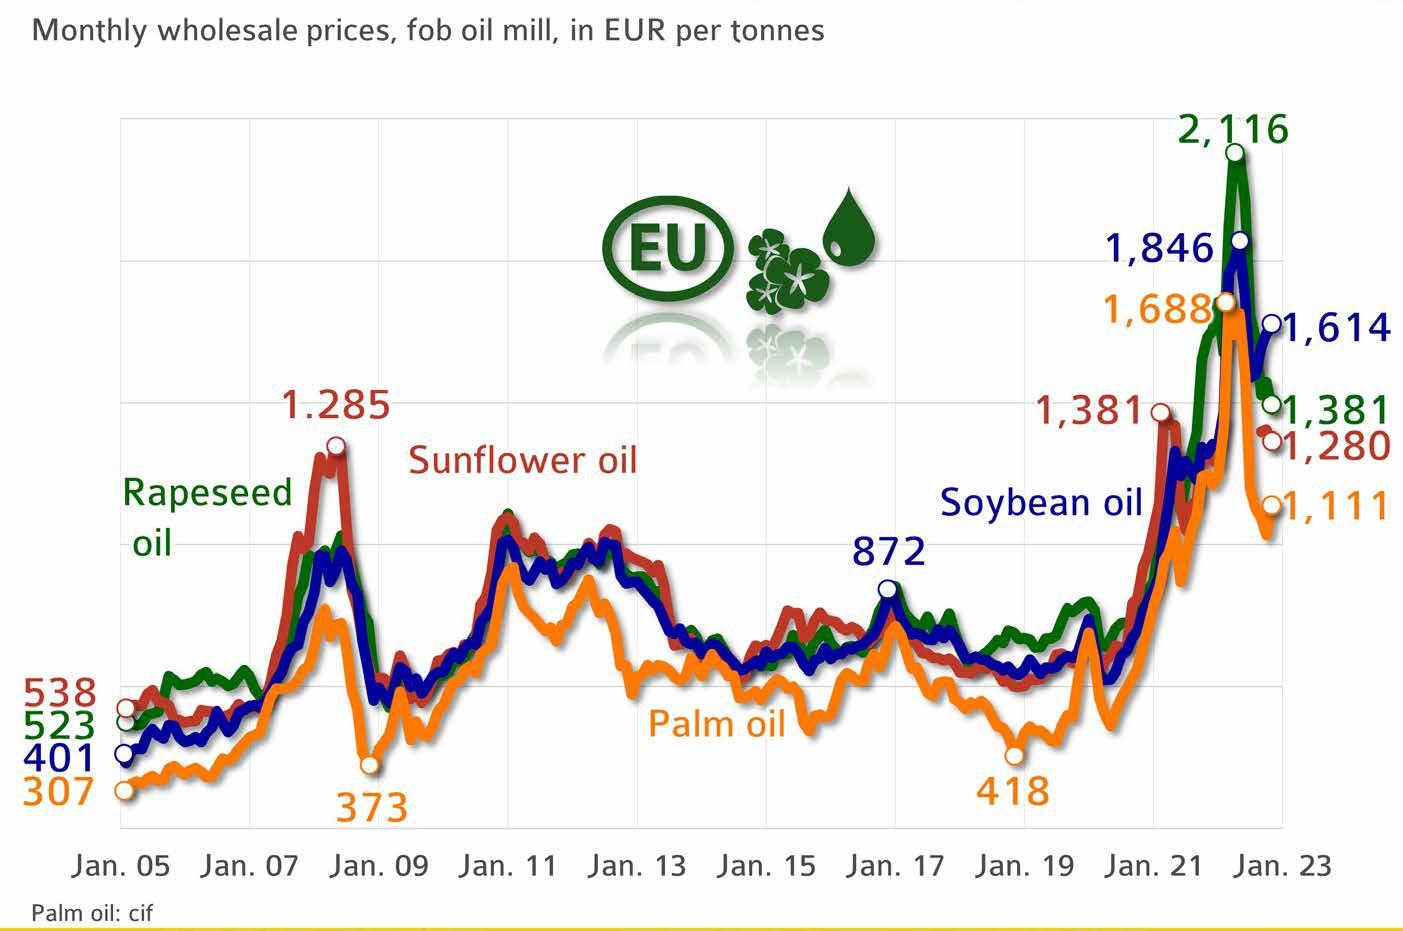
1.2.2.1 Price development of vegetable oils
The situation on the vegetable oil market had already been tense the previous year, but worsened in the wake of Russia’s invasion of Ukraine. The uncertainty about opportunities and volumes of exports of agricultural produce from Ukraine shook the market and led to unprecedented price increases. Sharply rising energy costs and issues in relation to logistics, especially in Germany as a consequence of low water levels in the major rivers that hampered water transports and drove costs up, added to the hike in prices. Consequently, vegetable oil prices climbed, but they did not maintain the high level. Only the prices of soybean oil have firmed since the summer due to the unsatisfactory harvest in the US. Nevertheless, vegetable oil prices are well in excess of the previous year’s level.
The current development of prices of oilseeds, but also grains, in the EU-27 reflects the sharp increases in prices for means of production such as fertilisers and fuels. This level of producer prices will be the backbone required for future crop farming that is both cost-efficient and sustainable. The reason is that prices will have to remain at the current level or even higher due to energy and climate protection policies. This will become a dilemma for food aid organisations or countries that depend on imports.
Record prices for vegetable oils
1.2 How much oilseed and vegetable oil is produced on a global scale?
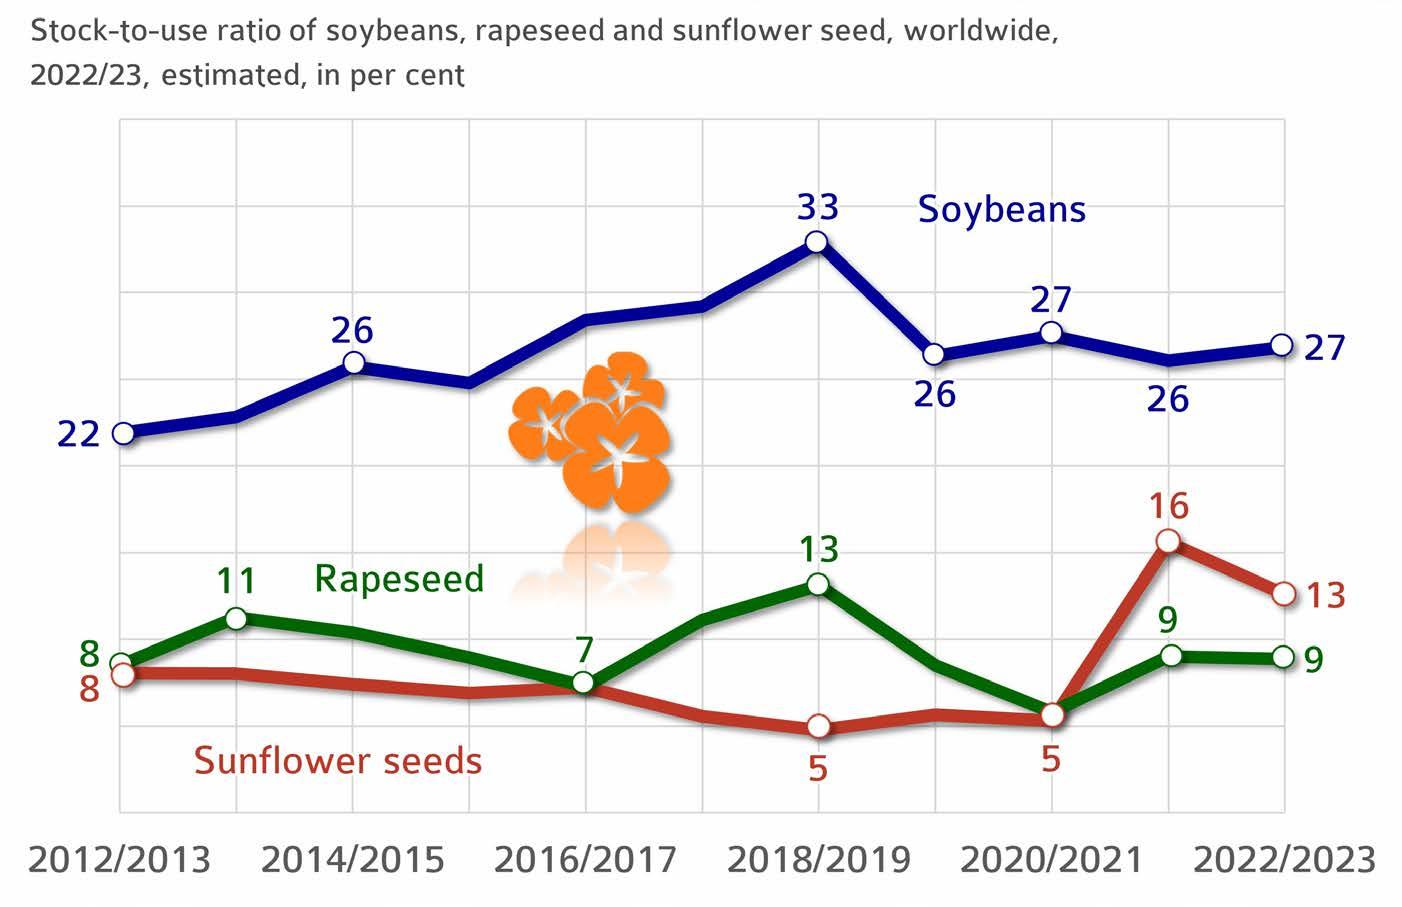
» 1.2.3 Global oilseed supply
The ratio of supplies to consumption (also called the stock-to-use ratio) is a key figure in estimating supply and, consequently, potential price trends. The lower the ratio, the faster supplies are absorbed. Also, a low ratio leads to rising prices. In 2022/23, soybean production is set to increase year-on-year, exceeding projected consumption. In other words, global stocks are seen to increase and the stock-to-use ratio is set to rise to the level recorded two years ago. The expected ending stocks in the current marketing year could cover up to 27 per cent of demand. By contrast, production of sunflowerseed is in steep decline, whereas consumption rose slightly. Accordingly, end-of-season stocks are expected to fall to only 13 per cent of demand. In contrast, the stock-to-use ratio for rapeseed is stable at the previous year’s level of 8.9 per cent. Although record soybean harvests are steadily increasing supply, demand for soybean protein for animal feed, particularly in China, is also rising sharply. Due to the steadily positive development of the economy and income in the world’s most populous country, purchasing power is increasing and so is demand for meat and, consequently, oilseed meals to feed the growing numbers of livestock.
Sunflower seed stocks increase
1.2 How much oilseed and vegetable oil is produced on a global scale?
» 1.2.3 Global oilseed supply
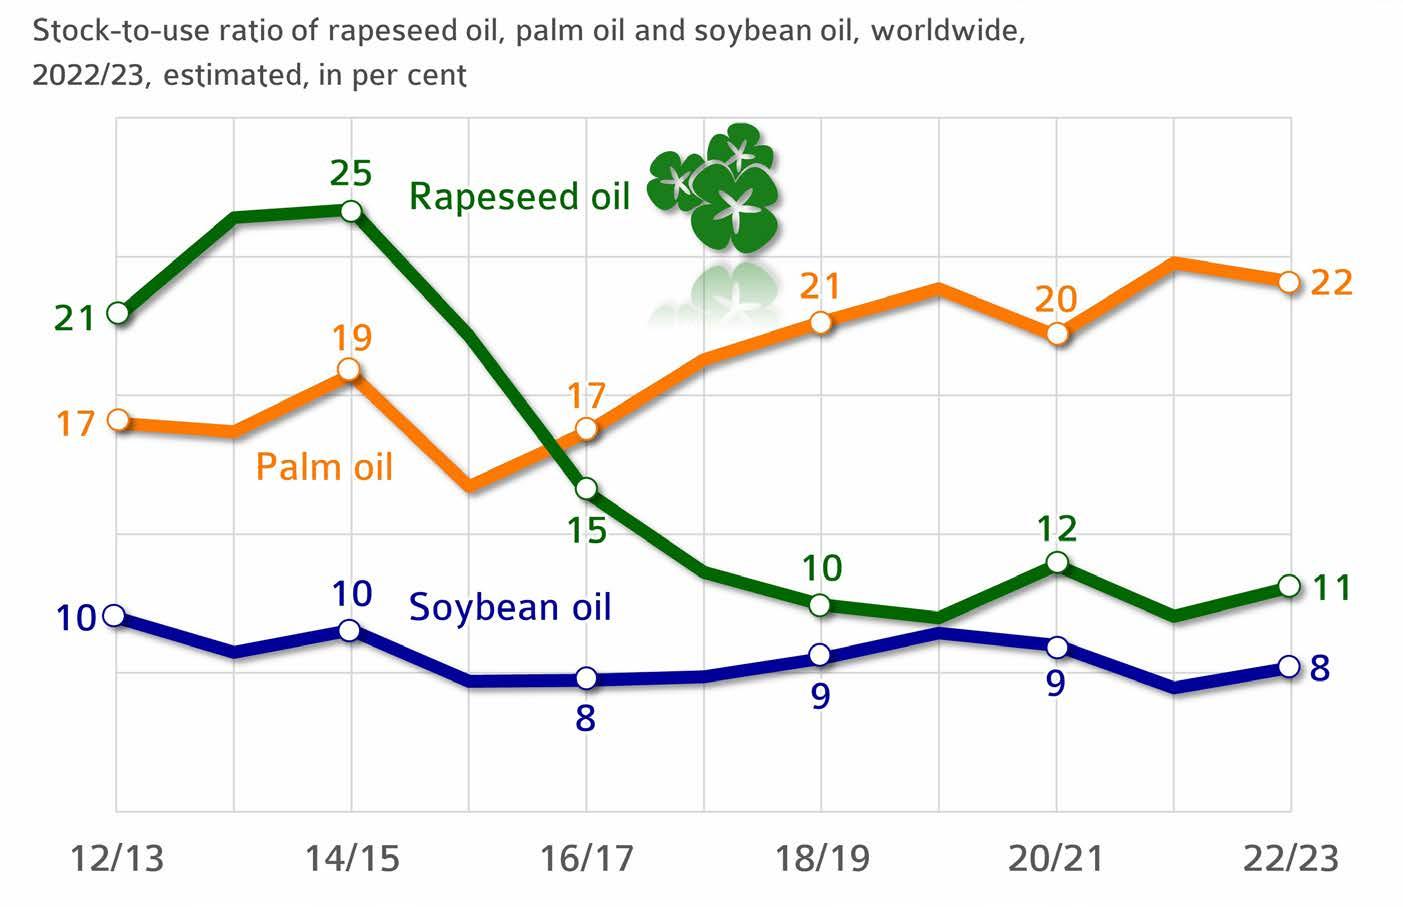
1.2.3.1 Global vegetable oil supply
The stock-to-use ratio for palm oil is in decline for the first time since 2014/15. It declined 0.7 per cent year-on-year. The picture is different for soybean and rapeseed oil. In the case of rapeseed oil, the ratio rose 1.1 per cent, whereas that for soybean oil exceeded the previous year’s figure by 0.7 per cent.
Palm oil supply declines
1.3 How much oilseed and grain does each continent produce?
» 1.3.1 Production of grain
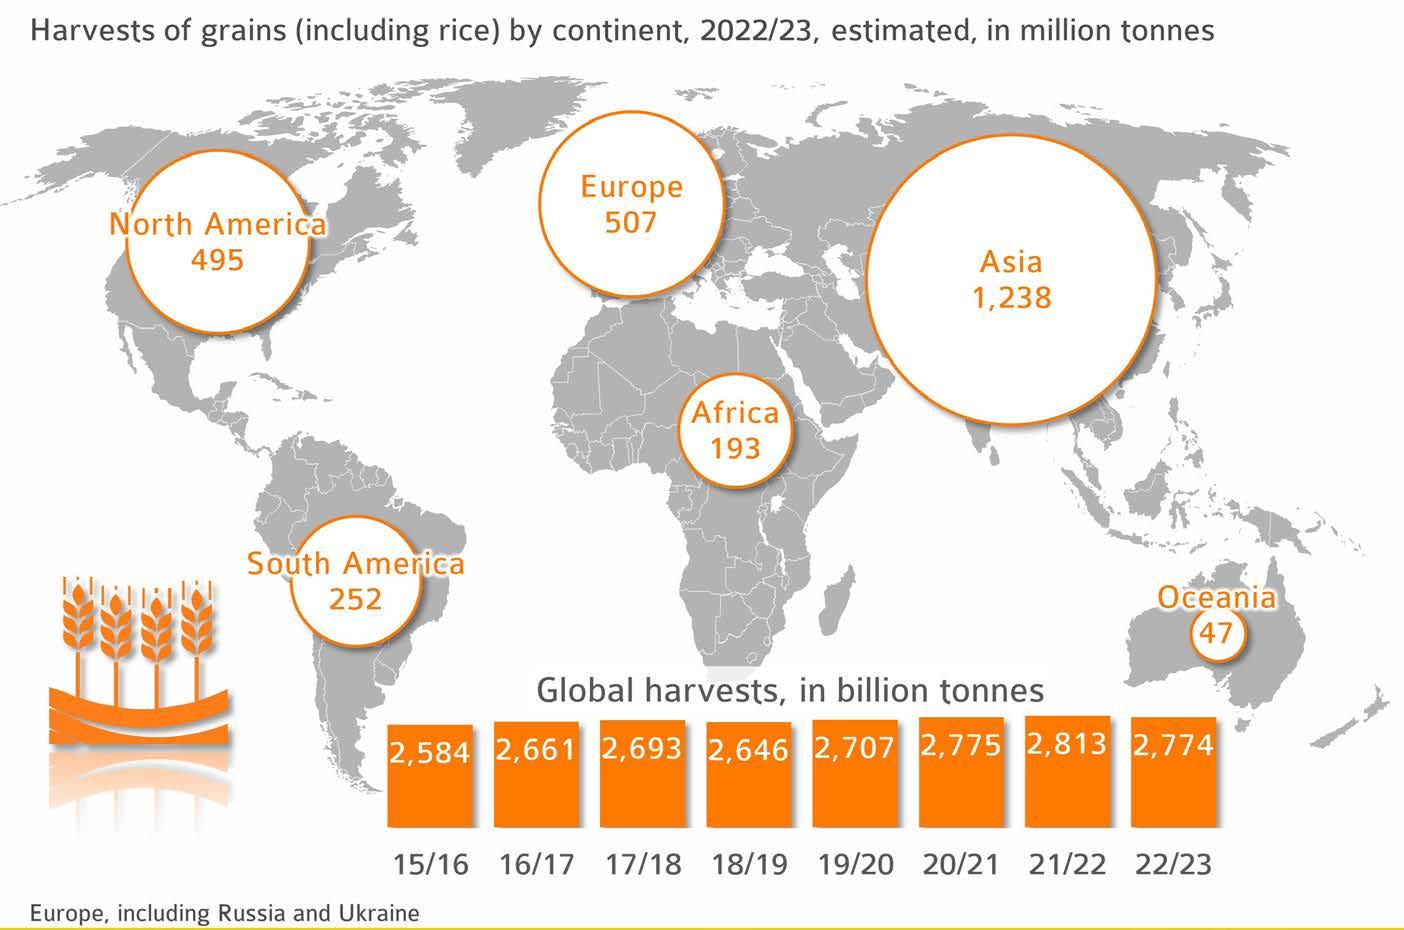
Global production of grain including rice is set to fall short of the previous year’s record in the current marketing year. Dryness in the northern hemisphere limited yields. The increases in South America cannot offset the decline, especially in Europe and North America. Above all, European farmers will probably harvest considerably fewer quantities of grains than the previous year. The Food and Agriculture Organization FAO expects around 2,774 million tonnes of grain on a global scale. The majority, around 45 per cent, is produced in Asia. The main reason is that Asia is the home of rice production. China is the main country of origin for grain and rice. Europe holds second position, accounting for just less than 20 per cent. North America follows close behind with 495 million tonnes, headed by the US with more than 417 million tonnes. Whereas marketing grain globally is vital for the economy of countries such as the US or Canada, China hardly offers any of its grain on the world market. The country produces most of its agricultural commodities to cover domestic demand and also needs extensive imports.
Asia is the largest grain producer
1.3 How much oilseed and grain does each continent produce?
» 1.3.2 Production of oilseeds
The output of oilseeds is growing rapidly. The Food and Agriculture Organization FAO estimates global production in 2022/23 at 655 million tonnes. This is up 7 per cent year-on-year and just over 30 per cent from ten years ago. The increase is primarily based on growth of output in South America, Europe and Asia due to expansion of area planted. The world’s most important oilseed and palm oil producing regions are more evenly distributed than grain-producing areas are. The difference is not so much in output as in crops grown: whereas soybean is the most important oilseed crop in South America and the US, rapeseed prevails in Canada and the EU-27 due to climatic conditions. In eastern Europe sunflowers predominate. Asian countries such as China and India produce large amounts of both rapeseed and soybeans. On the other hand, oil palm is the primary oilseed crop in Malaysia and Indonesia. This geographical distribution also “buffers” regional yield fluctuations in the interests of security of supply, for example if the weather phenomenon “El Niño” leads to yield declines in Asia or “La Niña” in South America.
Brazil is set to be the world’s largest producer of soybeans in 2022/23, ahead of the US. Canada has lost its top position among rapeseed producing countries to the EU, but moved back to second place ahead of China after the drought-stricken 2021/22 marketing year. Most sunflowers will probably be harvested in Russia in 2023, followed by Ukraine. However, there is no way to predict what implications the continued war will have on the season.
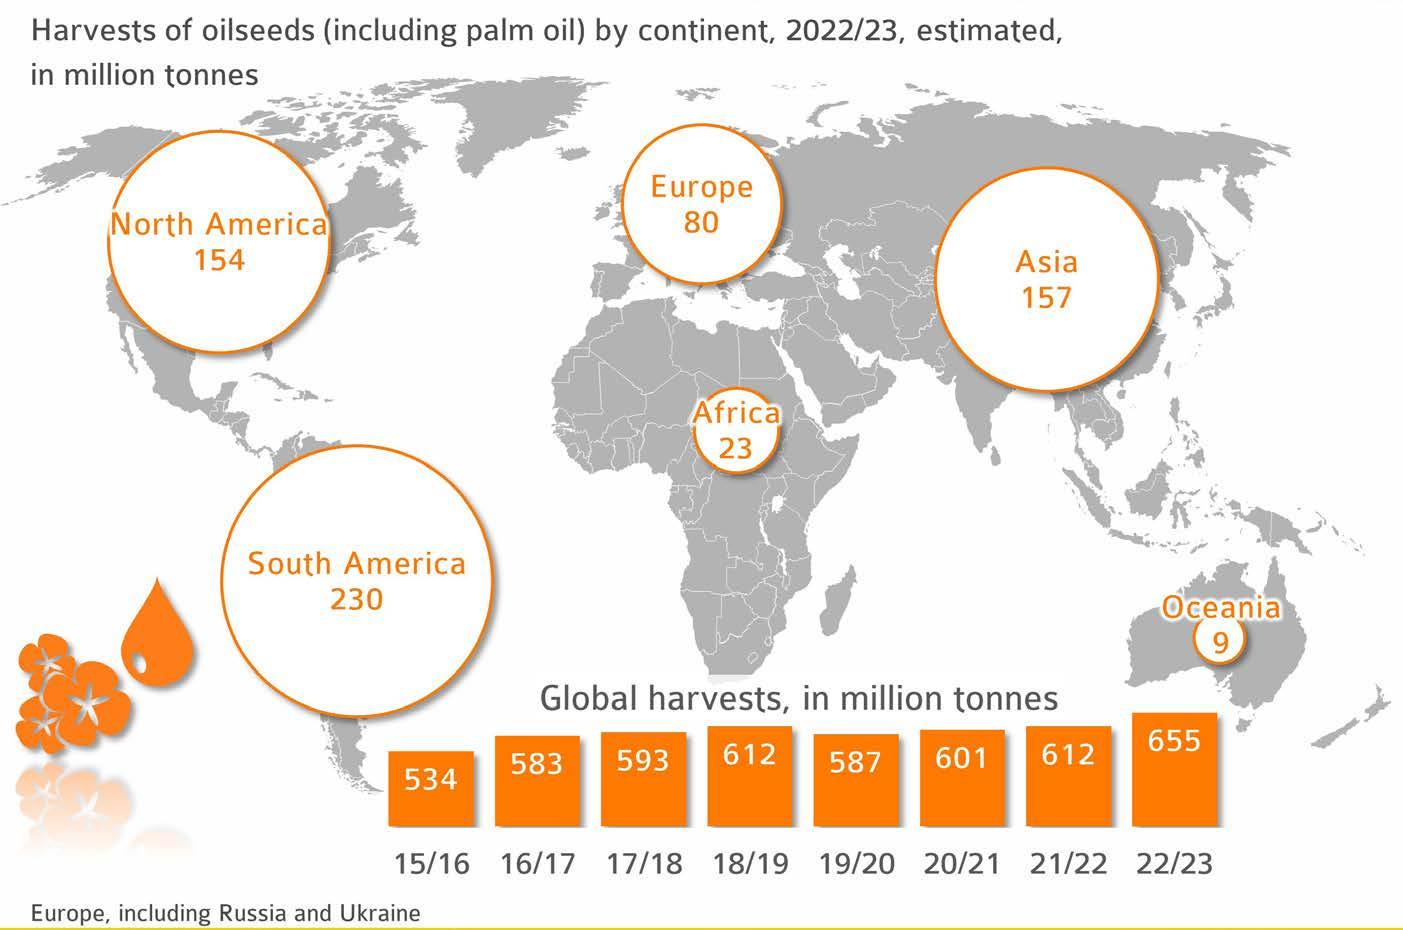
Oilseed harvests at all-time high
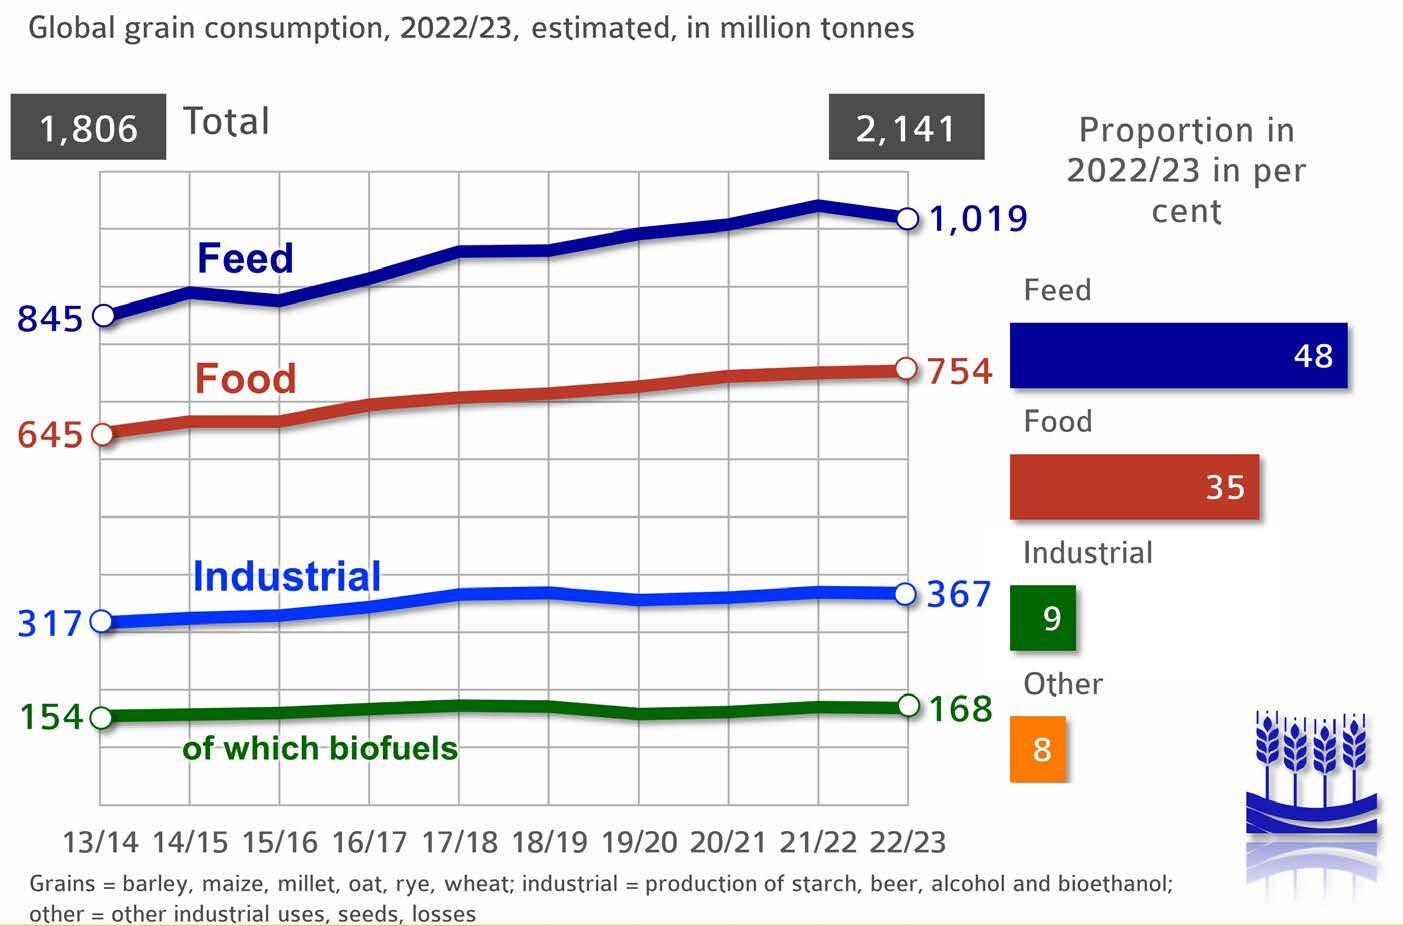
1.4 What products are made from grain?
» 1.4.1 Global use of grain
Global production of grains, excluding rice, in the 2022/23 marketing year is set to amount to approximately 2.1 billion tonnes. The produce is intended for human consumption, but also used as a livestock feed and feedstock in bioethanol production. At 48 per cent, the largest part of the grain harvests goes into feeding troughs, showing a stable trend compared to the previous year. The same holds true for food uses (just over one third) and industrial uses (just over one sixth). According to the International Grains Council (IGC), industrial uses will probably decline 0.5 per cent, especially based on lower demand for the purpose of biofuels production. The use of grain in the US, EU and China is set to shrink 1.4 per cent to 168 million tonnes and is not offset by the new increases in Brazil. This means that despite the war in Ukraine, there is basically enough grain to meet the growing demand for food and feed.
In the US, bioethanol is mostly made from maize. The process generates Dried Distillers Grains with Solubles (DDGS), which is used as a protein feed. One tonne of wheat that is processed into bioethanol produces on average 295 kg of DDGS with a moisture content of 10 per cent. One tonne of maize yields 309 kg of DDGS. When grain prices are high, processing is the first activity to go down, before farmers begin to save on feed. The high added-value potential in the food markets ensures that most of the grain goes into the production of food when grain prices are high. This means that the biofuels market serves as a “buffer” that ensures grain is constantly available for human consumption and feed.
Grain is mainly used for feed production
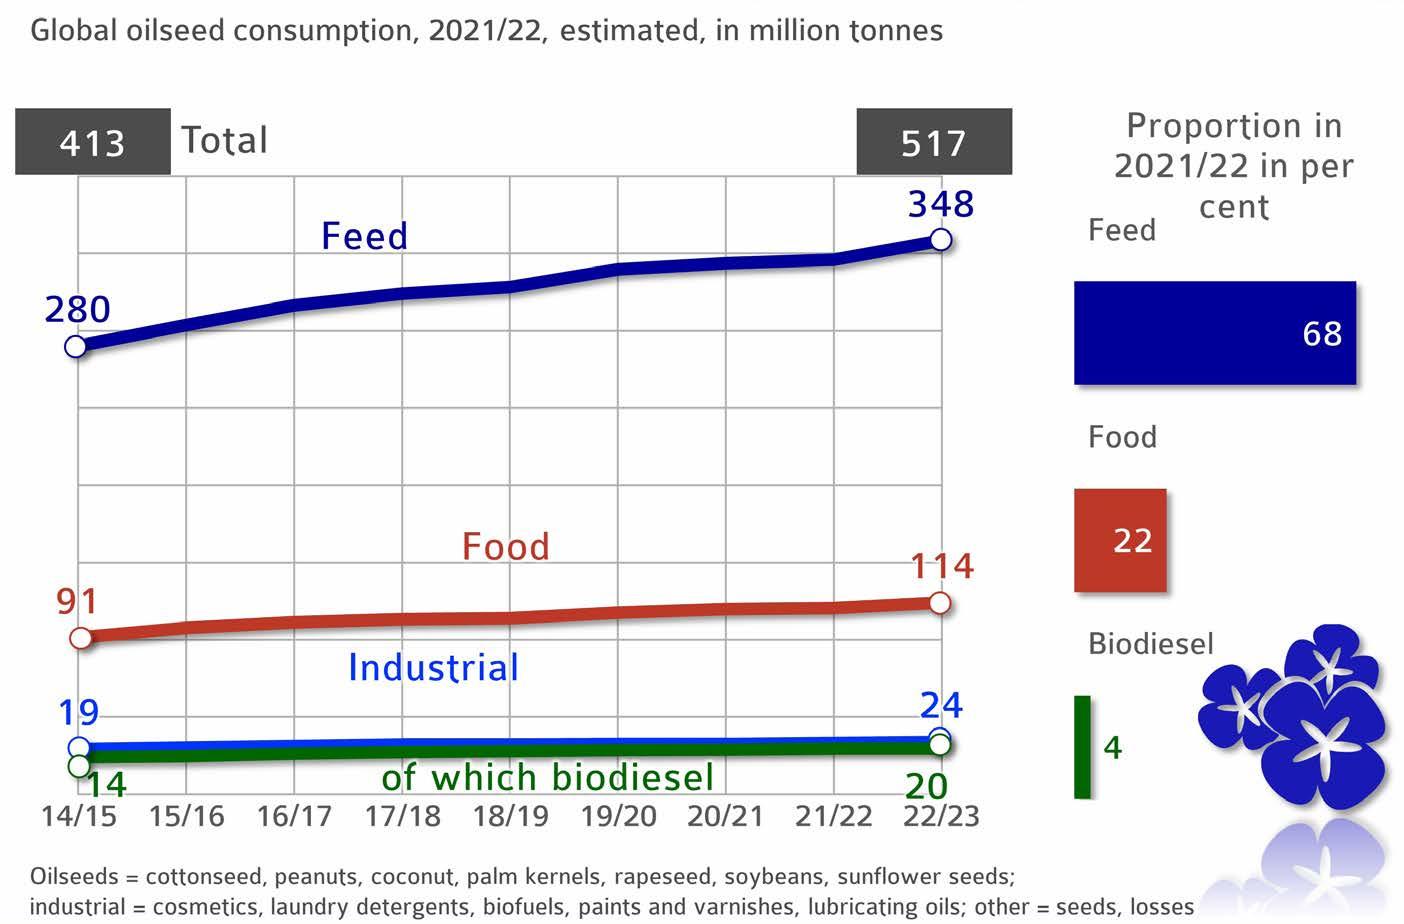
1.5 What products are made from oilseeds?
» 1.5.1 Global use of oilseeds
Oilseeds grown worldwide are obtained to make vegetable oils, extraction meal and oilseed cake. Vegetable oil can be obtained by different chemical and physical processes. Before being pressed, the feedstock is heated to increase oil yield. The meal that remains after pressing is used as a high-protein feed. Consequently, the largest part of the oilseeds – just over two thirds – goes into feeding troughs and the smaller proportion – around 22 per cent – into food production. Soybean meal is the number one oilseed-based feed, with global output amounting to 249 million tonnes. It is followed by rapeseed meal, which has a share of 38 million tonnes in global protein supply. Farmers in the EU-27 only produce GM-free rapeseed. Consequently, rapeseed is by far the most important GM-free source of protein for animal feeding in the EU. Therefore, EU-rapeseed meal reduces the corresponding need for soybean imports and the acreage of land that would otherwise be required for soy cultivation. Unfortunately, this fact has still not received the necessary recognition from the EU Commission, for example with respect to incorporating the protein component in greenhouse gas accounting for rapeseed-based biodiesel or the “Farm to Fork” strategy. The amount of sunflower meal, 21 million tonnes, is twelve times smaller than that of soybean meal. Production of oil is much more important with this crop. Any meal produced is also used as animal feed.
Majority of oilseed product go into feed
1.5 What products are made from oilseeds?
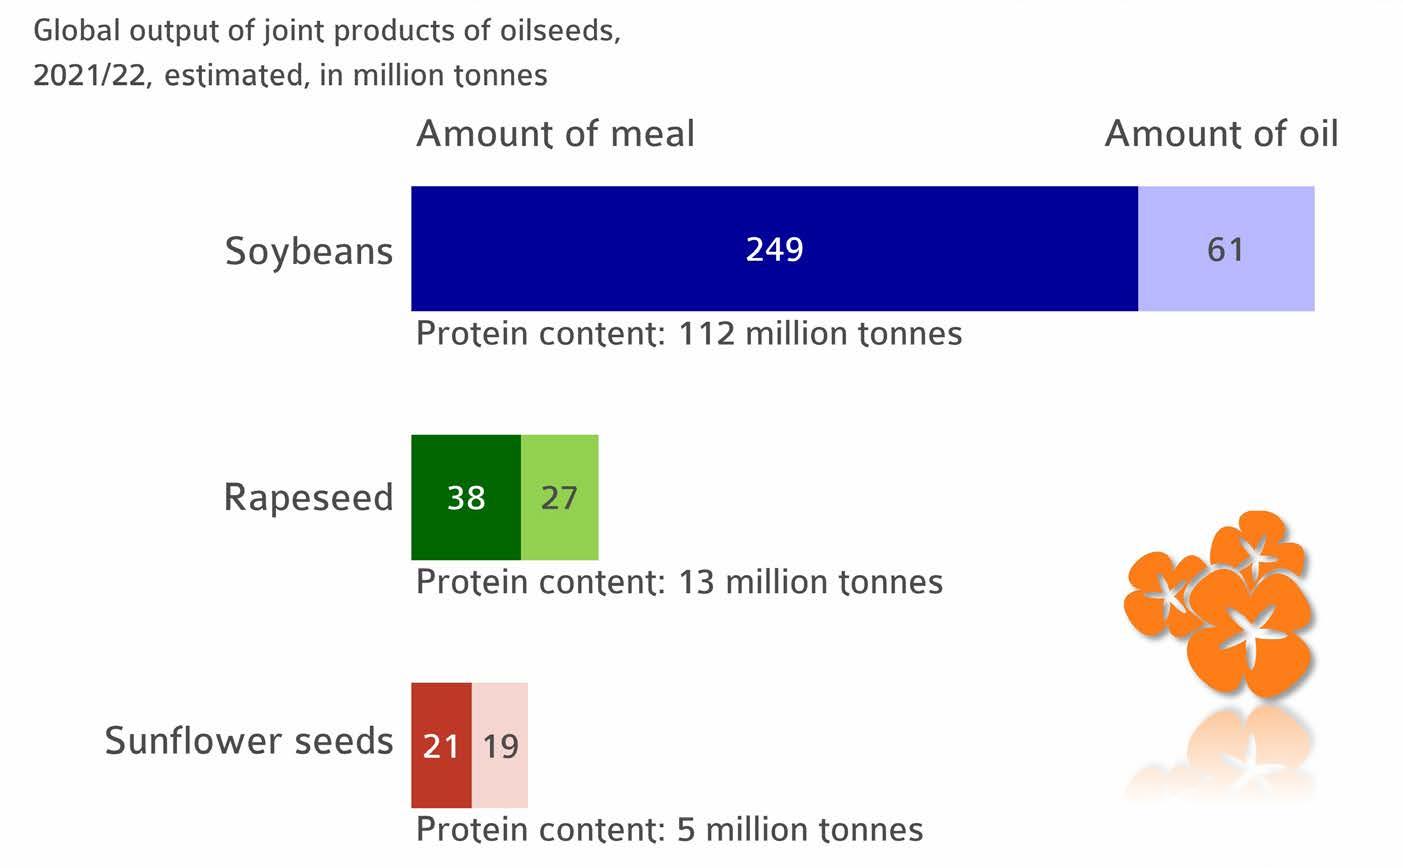
» 1.5.1 Global use of oilseeds
1.5.1.1 Global production of oils and meals
Practical dual use of oilseeds
© AMI 2022 | Source: Oil World
1.6 Production of pulses
» 1.6.1 Production in the EU-27
The production of legumes is gaining importance in the EU-27 in terms of biodiversity (flowering plants), climate protection (no need for nitrogen applications) and as an alternative source of protein for innovative food products. However, in 2022 summer crops in the EU strongly suffered due to extreme heat and dry conditions. Also, dry peas and field beans saw reduced hectarage, which had to give way to the boom in sunflower cultivation, whereas the sweet lupin area was slightly expanded. In 2022 the total output amounted to 5.8 million tonnes. The most important legume crop in the EU-27 in 2022/23 was soybean, which accounted for around 45 per cent of grain legume production.
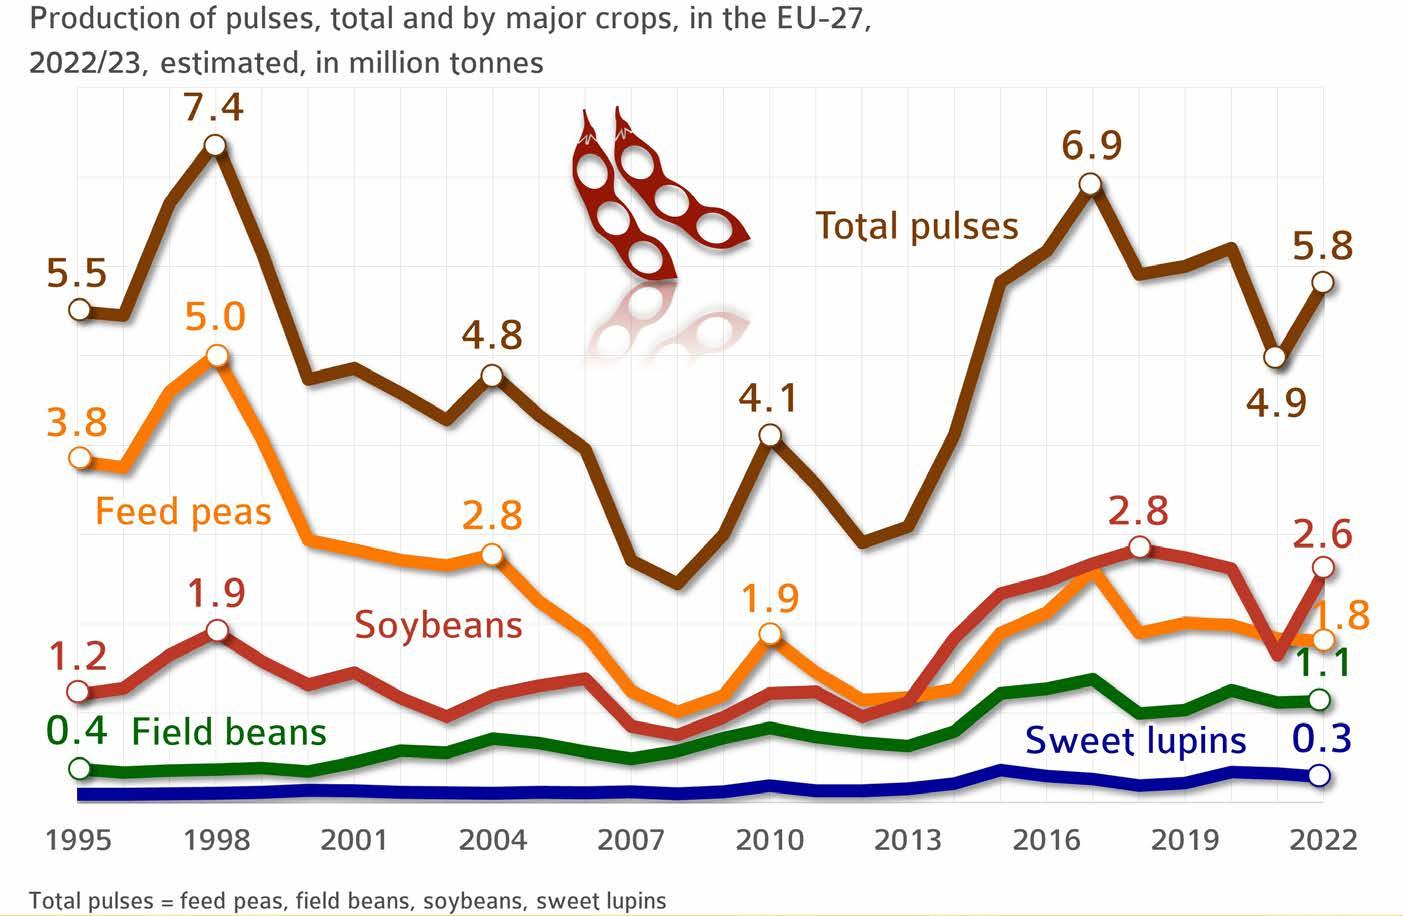
Protein crops for livestock feeding purposes are in strong competition with imported soybeans and soybean meal. Considering their protein quality, the latter are often lower priced, which makes them attractive for the production of compound feeds. Nevertheless, progress in the use of grain legumes is impressive. They are the basis for the national and European protein plant strategy. The UFOP is supporting project proposals or directly involved in joint projects (https://www.ufop.de/agrar-info/forschu/berichte/ – in German only).
Production of pulses 18 per cent above previous year
© AMI 2022 | Source: EU-Commission
1.6 Production of pulses
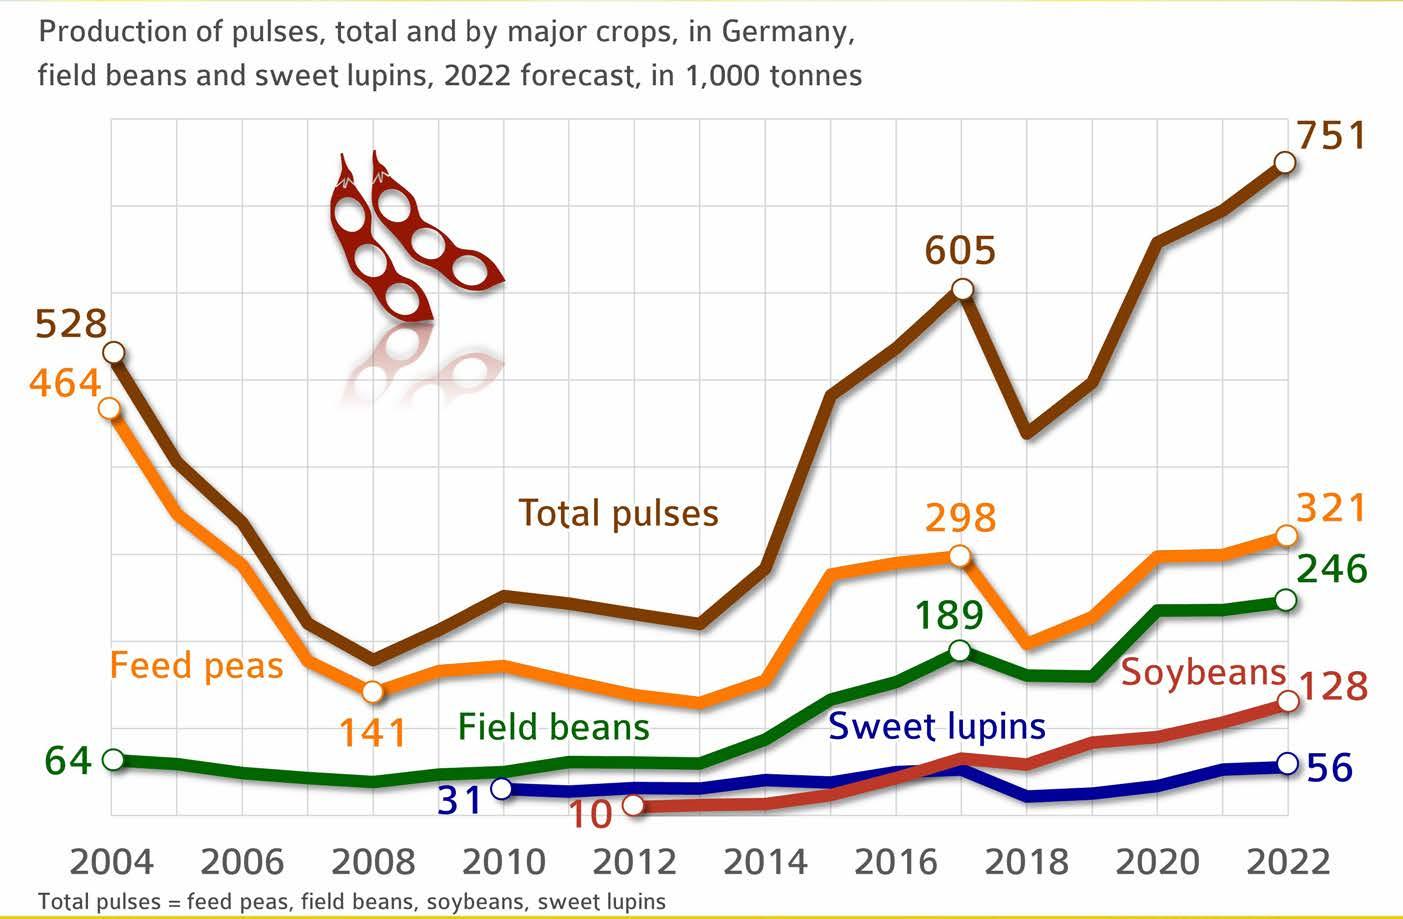
» 1.6.2 Production in Germany
The strong 19 per cent expansion in legume area for the 2022 harvest offsets the sub-standard yield of 30 decitonnes per hectare. As a result, 2022 output in Germany amounted to 695,000 tonnes, up around 6 per cent on year-on-year and as much as 30 per cent on the long-standing average. Soybeans are also becoming increasingly attractive, if on a regional scale and at a lower level. The area planted with legumes for grain production totalled 261,000 hectares in 2022. This translates to a 19 per cent increase year-on-year. Feed peas were the most important grain legume crop, occupying 106,600 hectares (+ 9 per cent), followed by field beans at 71,200 hectares (+ 24 per cent). The sweet lupin area rose 9 per cent to 21,700 hectares. Soybeans saw the biggest increase at 50 per cent to 51,400 hectares.
However, soybean production was at a low scale compared to other legume crops. The reason is a poor competitive position compared to imported soybean meal and soybeans respectively. As flowering plants, legumes are indispensable crops to expand crop rotations and improve biodiversity and soil fertility. What makes them so special is that, aided by bacteria that cling to their roots, they convert atmospheric nitrogen into organic nitrogen which encourages plant growth. Legumes have the potential to establish themselves in the trade as an alternative source of protein. This is a result from the UFOP conference titled “Local Heroes”. The presentations given at the conference are available (in German only) using the following link: https://www.ufop.de/ufop-der-verband/ufop-online-fachtagung/localheroes-2022/
Soybean production increases by one fifth
© AMI 2021 | Sources: AMI, Destatis
Production of biofuels
2.1 Which countries promote biofuels?
» 2.1.1 Global output of bioethanol
Worldwide, a new record high of 118.498 million m3 of bioethanol was produced in 2021. The aim is to reduce the use of fossil energy sources, thus making a contribution towards climate protection and securing energy supply, and support feedstock prices to ensure adequate incomes from farming. Blending quotas (relating to energy, volume or greenhouse gas reduction) have become globally accepted as a flexible instrument to achieve this aim. Policy therefore has a direct influence on the scale of bioethanol production and trade in biofuels. Global use of grain to produce bioethanol is in decline because of smaller harvests, but especially because prices are comparatively high. The use of grain (especially maize) as a feedstock is expected to fall 1.1 per cent to 168.2 million tonnes in 2022/23. According to information published by the International Grains Council (IGC), global cereal production (including rice) declined 1.5 per cent to 2.3 billion tonnes at the same time. By contrast, production of bioethanol from sugar cane, sugar beet and molasses rose 2.2 per cent.
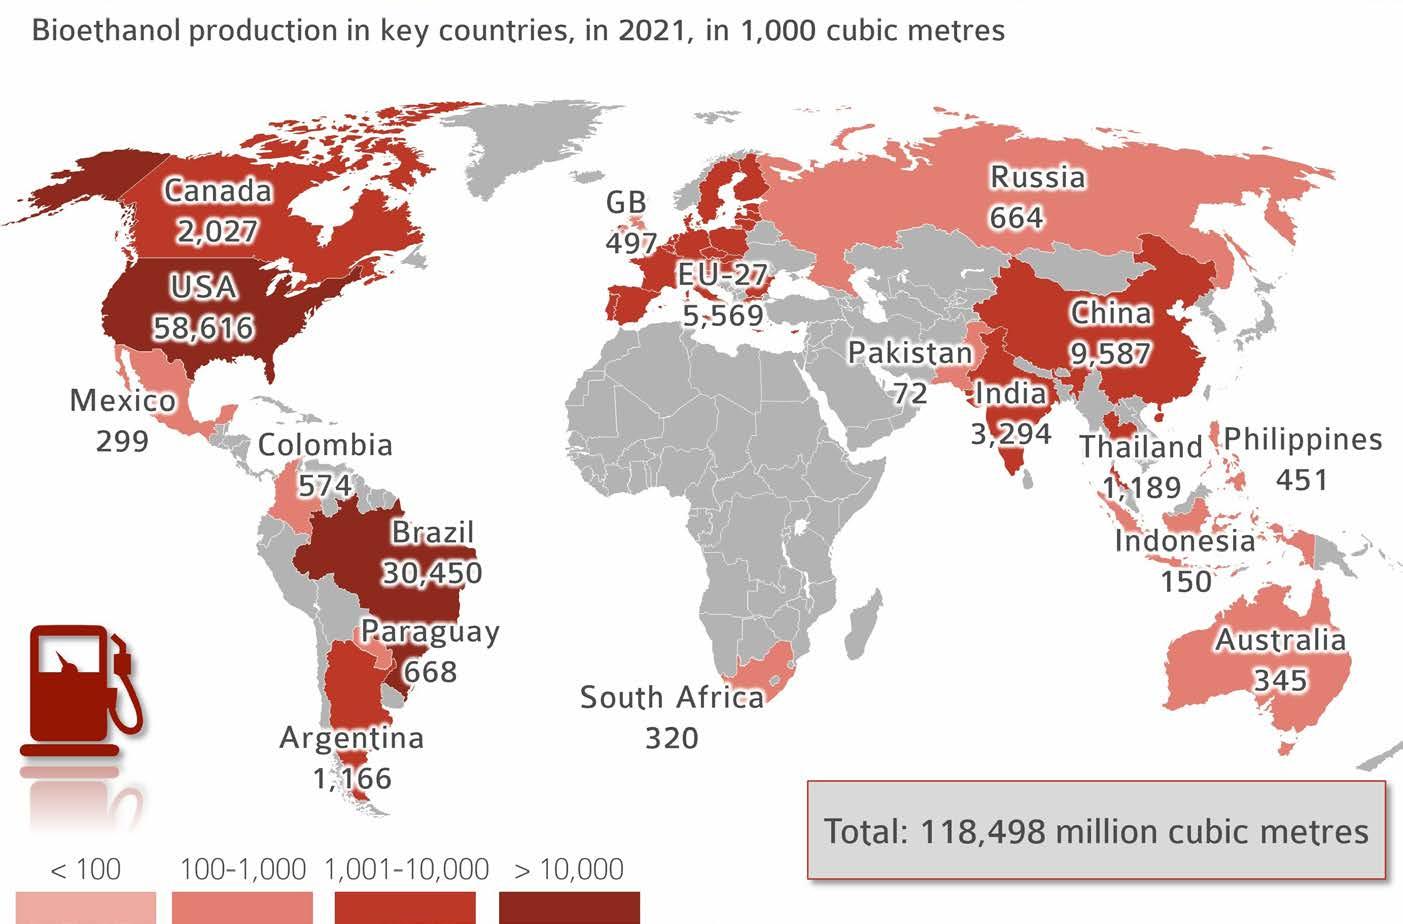
At the top of the list of bioethanol-producing countries is the US, with 58.6 million m3 and an 8 per cent increase compared to the COVID-19 year 2020. About 99 per cent of US bioethanol was based on maize, another 1 per cent on other biomass. The second largest bioethanol-producing country is Brazil with an output of 30 million m3, of which 91.4 per cent is based on sugar from sugar cane. In the EU-27, bioethanol production in 2021 amounted to around 5.2 million m3, mainly based on maize, wheat and sugar made from sugar beet.
Bioethanol production recovers from Corona damper
© AMI 2022
Source: OECD


