3. Smart Indicators 3.3 Smart Governance On‐line public services
On‐line public services Percentage of services available on‐line
The introduction of new technologies in Public Administrations greatly improves the productivity and quality of the service offered to citizens and businesses, providing access to government services at any time and place in a more convenient, personalised, faster and less expensive manner. The implementation of e‐Government is a priority for cities around the world. There is complete consensus that it is vital for social development and economic growth. Thanks to services like e‐Government, the intention is to provide a more efficient and higher quality services, save cots, reduce waiting times and improve the transparency of processes, both for citizens and businesses.
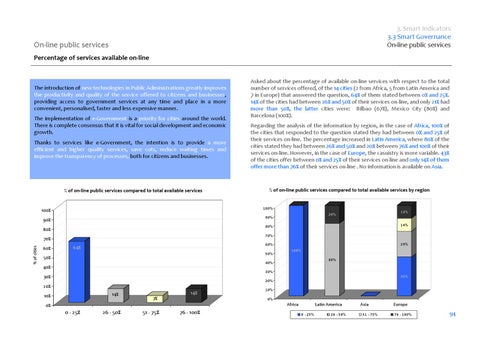
% of on‐line public services compared to total available services
% of on‐line public services compared to total available services by region
14%
20%
90%
90%
14%
80%
80%
70%
70% % of cities
Regarding the analysis of the information by region, in the case of Africa, 100% of the cities that responded to the question stated they had between 0% and 25% of their services on‐line. The percentage increased in Latin America, where 80% of the cities stated they had between 26% and 50% and 20% between 76% and 100% of their services on‐line. However, in the case of Europe, the casuistry is more variable. 43% of the cities offer between 0% and 25% of their services on‐line and only 14% of them offer more than 76% of their services on‐line . No information is available on Asia.
100%
100%
60%
Asked about the percentage of available on‐line services with respect to the total number of services offered, of the 14 cities (2 from Africa, 5 from Latin America and 7 in Europe) that answered the question, 64% of them stated between 0% and 25%. 14% of the cities had between 26% and 50% of their services on‐line, and only 21% had more than 50%, the latter cities were: Bilbao (67%), Mexico City (80%) and Barcelona (100%).
29%
60%
64%
50%
50%
100% 80%
40%
40%
30% 43%
30%
20%
20% 14%
10%
14% 7%
10% 0%
Africa
0%
0 ‐ 25%
26 ‐ 50%
51 ‐ 75%
76 ‐ 100%
Latin America 0 ‐ 25%
26 ‐ 50%
Asia 51 ‐ 75%
Europe 76 ‐ 100%
94