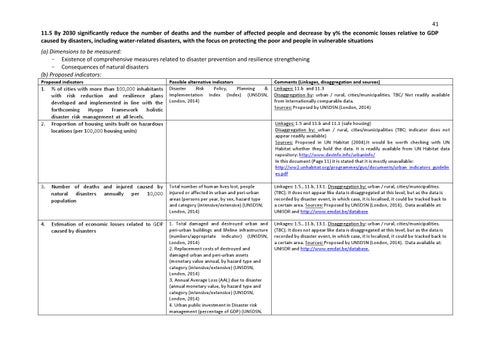
41 11.5 By 2030 significantly reduce the number of deaths and the number of affected people and decrease by y% the economic losses relative to GDP caused by disasters, including water-related disasters, with the focus on protecting the poor and people in vulnerable situations (a) Dimensions to be measured: - Existence of comprehensive measures related to disaster prevention and resilience strengthening - Consequences of natural disasters (b) Proposed indicators: Proposed indicators
1.
2.
% of cities with more than 100,000 inhabitants with risk reduction and resilience plans developed and implemented in line with the forthcoming Hyogo Framework holistic disaster risk management at all levels. Proportion of housing units built on hazardous locations (per 100,000 housing units)
Possible alternative indicators Disaster Risk Policy, Planning & Implementation Index (Index) (UNSDSN, London, 2014)
Comments (Linkages, disaggregation and sources) Linkages: 11.b and 11.3 Disaggregation by: urban / rural, cities/municipalities. TBC/ Not readily available from internationally comparable data. Sources: Proposed by UNSDSN (London, 2014) Linkages: 1.5 and 11.b and 11.1 (safe housing) Disaggregation by: urban / rural, cities/municipalities (TBC; indicator does not appear readily available) Sources: Proposed in UN Habitat (2004).It would be worth checking with UN Habitat whether they hold the data. It is readily available from UN Habitat data repository: http://www.devinfo.info/urbaninfo/ In this document (Page 11) it is stated that it is mostly unavailable: http://ww2.unhabitat.org/programmes/guo/documents/urban_indicators_guidelin es.pdf
3.
Number of deaths and injured caused by natural disasters annually per 10,000 population
Total number of human lives lost, people injured or affected in urban and peri-urban areas (persons per year, by sex, hazard type and category (intensive/extensive) (UNSDSN, London, 2014)
Linkages: 1.5., 11.b, 13.1. Disaggregation by: urban / rural, cities/municipalities. (TBC). It does not appear like data is disaggregated at this level, but as the data is recorded by disaster event, in which case, it is localised, it could be tracked back to a certain area. Sources: Proposed by UNSDSN (London, 2014). Data available at: UNISDR and http://www.emdat.be/database
4.
Estimation of economic losses related to GDP caused by disasters
1. Total damaged and destroyed urban and peri-urban buildings and lifeline infrastructure (numbers/appropriate indicator) (UNSDSN, London, 2014) 2. Replacement costs of destroyed and damaged urban and peri-urban assets (monetary value annual, by hazard type and category (intensive/extensive) (UNSDSN, London, 2014) 3. Annual Average Loss (AAL) due to disaster (annual monetary value, by hazard type and category (intensive/extensive) (UNSDSN, London, 2014) 4. Urban public investment in Disaster risk management (percentage of GDP) (UNSDSN,
Linkages: 1.5., 11.b, 13.1. Disaggregation by: urban / rural, cities/municipalities. (TBC). It does not appear like data is disaggregated at this level, but as the data is recorded by disaster event, in which case, it is localized, it could be tracked back to a certain area. Sources: Proposed by UNSDSN (London, 2014). Data available at: UNISDR and http://www.emdat.be/database.