34
119
153
Kenya
TOTAL LRGs
TOTAL LRGs
0
MUNICIPAL LEVEL
MUNICIPAL LEVEL
U
INTERMEDIATE LEVEL
INTERMEDIATE LEVEL
Afghanistan
REGIONAL-STATE LEVEL
REGIONAL-STATE LEVEL
REPORTING COUNTRY
FEDERAL OR UNITARY
REPORTING COUNTRY
FEDERAL OR UNITARY
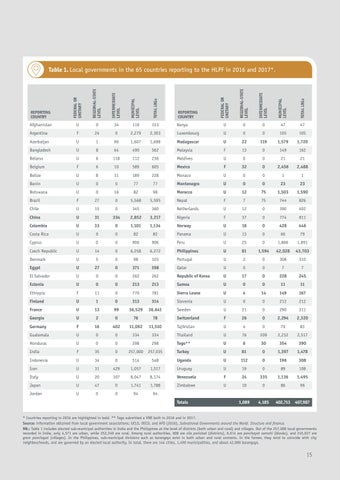
Table 1. Local governments in the 65 countries reporting to the HLPF in 2016 and 2017*.
U
0
0
47
47
Argentina
F
24
0
2,279
2,303
Luxembourg
U
0
0
105
105
Azerbaijan
U
1
90
1,607
1,698
Madagascar
U
22
119
1,579
1,720
Bangladesh
U
8
64
490
562
Malaysia
F
13
0
149
162
Belarus
U
6
118
112
236
Maldives
U
0
0
21
21
Belgium
F
6
10
589
605
Mexico
F
32
0
2,456
2,488
Belize
U
8
31
189
228
Monaco
U
0
0
1
1
Benin
U
0
0
77
77
Montenegro
U
0
0
23
23
Botswana
U
0
16
82
98
Morocco
U
12
75
1,503
1,590
Brazil
F
27
0
5,568
5,595
Nepal
F
7
75
744
826
Chile
U
15
0
345
360
Netherlands
U
12
0
390
402
China
U
31
334
2,852
3,217
Nigeria
F
37
0
774
811
Colombia
U
33
0
1,101
1,134
Norway
U
18
0
428
446
Costa Rica
U
0
0
82
82
Panama
U
13
0
66
79
Cyprus
U
0
0
906
906
Peru
U
25
0
1,866
1,891
Czech Republic
U
14
0
6,258
6,272
Philippines
U
81
1,594
42,028
43,703
Denmark
U
5
0
98
103
Portugal
U
2
0
308
310
Egypt
U
27
0
371
398
Qatar
U
0
0
7
7
El Salvador
U
0
0
262
262
Republic of Korea
U
17
0
228
245
Estonia
U
0
0
213
213
Samoa
U
0
0
11
11
Ethiopia
F
11
0
770
781
Sierra Leone
U
4
14
149
167
Finland
U
1
0
313
314
Slovenia
U
0
0
212
212
France
U
13
99
36,529
36,641
Sweden
U
21
0
290
311
Georgia
U
2
0
76
78
Switzerland
F
26
0
2,294
2,320
Germany
F
16
402
11,092
11,510
Tajikistan
U
4
0
79
83
Guatemala
U
0
0
334
334
Thailand
U
76
209
2,232
2,517
Honduras
U
0
0
298
298
Togo**
U
6
30
354
390
India
F
35
0
257,000
257,035
Turkey
U
81
0
1,397
1,478
Indonesia
U
34
0
514
548
Uganda
U
112
0
196
308
Iran
U
31
429
1,057
1,517
Uruguay
U
19
0
89
108
Italy
U
20
107
8,047
8,174
Venezuela
F
24
335
1,136
1,495
Japan
U
47
0
1,741
1,788
Zimbabwe
U
10
0
86
96
Jordan
U
0
0
94
94 1,089
4,185
402,713
407,987
Totals
* Countries reporting in 2016 are highlighted in bold. ** Togo submitted a VNR both in 2016 and in 2017. Source: information obtained from local government associations; UCLG, OECD, and AFD (2016), Subnational Governments around the World. Structure and finance. NB.: Table 1 includes elected sub-municipal authorities in India and the Philippines at the level of districts (both urban and rural) and villages. Out of the 257,000 local governments recorded in India, only 4,571 are urban, while 252,249 are rural. Among rural authorities, 608 are zila parishad (districts), 6,614 are panchayat samaiti (blocks), and 245,027 are gram panchayat (villages). In the Philippines, sub-municipal divisions such as barangays exist in both urban and rural contexts. In the former, they tend to coincide with city neighbourhoods, and are governed by an elected local authority. In total, there are 144 cities, 1,490 municipalities, and about 42,000 barangays.
15