The project
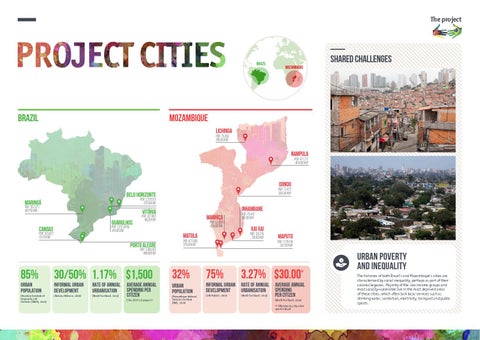
BRAZIL
BRAZIL
SHARED CHALLENGES MOZAMBIQUE
MOZAMBIQUE Lichinga POP.: 75,350 290.00 km2
Nampula POP.: 471,717 404.00 km2
Dondo
POP.: 71,473 382.00 km2
Belo Horizonte POP.: 2.375,151 331.00 km2
Maringá POP.: 357,077 487.05 km2
Inhambane
Vitória
Guarulhos POP.: 1,312,197w 341.00 km2
Canoas
POP.: 323,827 131.10 km2
Manhiça
POP.: 327,801 98.20 km2
POP.: 57,000 406.00 km2
Xai Xai
POP.: 123,215 135.00 km2
Matola Porto Alegre
POP.: 75,412 192.00 km2
POP.: 671,556 375.00 km2
Maputo
POP.: 1,178,116 347.00 km2
POP.: 1,409,351 496.68 km2
85%
30/50% 1.17% $1,500
32%
75%
3.27% $30.00
URBAN POPULATION
INFORMAL URBAN DEVELOPMENT
RATE OF ANNUAL URBANISATION
INFORMAL URBAN DEVELOPMENT
RATE OF ANNUAL URBANISATION
(Brazilian Institute of Geography and Statistics [IBGE], 2010)
(Betânia Alfonsin, 2006)
(World Fact Book, 2015)
URBAN POPULATION
(UN-Habitat, 2007)
(World Fact Book, 2015)
AVERAGE ANNUAL SPENDING PER CITIZEN (this UCLG C2C project )
(Mozambique National Statistics Institute [INE], 2015)
URBAN POVERTY AND INEQUALITY
*
AVERAGE ANNUAL SPENDING PER CITIZEN (World Fact Book, 2015) fifty times less than that *spent in Brazil
The histories of both Brazil’s and Mozambique’s cities are characterised by social inequality, perhaps as part of their colonial legacies. Majority of the low income groups and most socially-vulnerable live in the most deprived areas of these cities, which often lack basic services such as drinking water, sanitation, electricity, transport and public spaces.