HOUGHT civil soci ety 2 0% Asia 10% s.a
2% other ov 3% nal g o i t na ic 6% publ . n ge 7% erica n.am % a8 atives 37% resent d rep cte e 47% ele europ
female 31%
6%
male 69%
internation al
inst itu t i o ns 31% afr ica 2
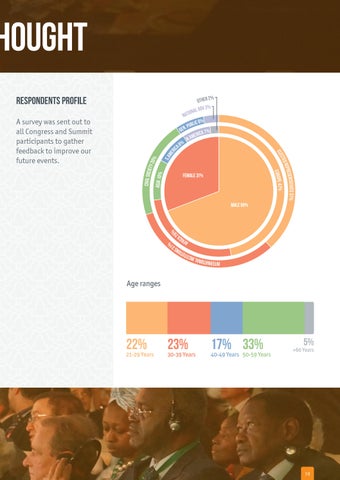
A survey was sent out to all Congress and Summit participants to gather feedback to improve our future events.
me ric
Respondents profile
Age ranges
22% 23% 21-29 Years 30-39 Years
17% 33% 40-49 Years 50-59 Years
5%
+60 Years
19