MFI Report: Irvine at 50: From a Planned Community to a Growing Job Center December 2021
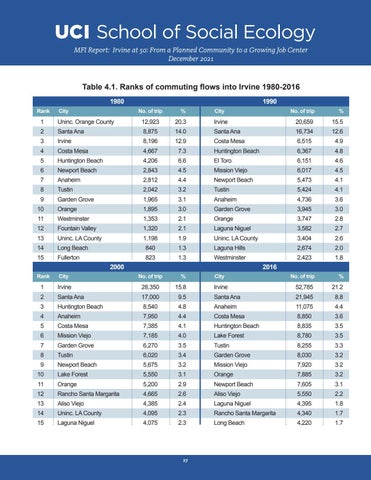
Table 4.1. Ranks of commuting flows into Irvine 1980-2016 1980 Rank
City
No. of trip
%
1
Uninc. Orange County
12,923
20.3
2
Santa Ana
8,875
3
Irvine
4
1990 City
No. of trip
%
Irvine
20,659
15.5
14.0
Santa Ana
16,734
12.6
8,196
12.9
Costa Mesa
6,515
4.9
Costa Mesa
4,667
7.3
Huntington Beach
6,367
4.8
5
Huntington Beach
4,206
6.6
El Toro
6,151
4.6
6
Newport Beach
2,843
4.5
Mission Viejo
6,017
4.5
7
Anaheim
2,812
4.4
Newport Beach
5,473
4.1
8
Tustin
2,042
3.2
Tustin
5,424
4.1
9
Garden Grove
1,965
3.1
Anaheim
4,736
3.6
10
Orange
1,895
3.0
Garden Grove
3,945
3.0
11
Westminster
1,353
2.1
Orange
3,747
2.8
12
Fountain Valley
1,320
2.1
Laguna Niguel
3,582
2.7
13
Uninc. LA County
1,198
1.9
Uninc. LA County
3,404
2.6
14
Long Beach
840
1.3
Laguna Hills
2,674
2.0
15
Fullerton
823
1.3
Westminster
2,423
1.8
No. of trip
%
Irvine
52,785
21.2
2000 %
2016
Rank
City
No. of trip
1
Irvine
28,350
15.8
2
Santa Ana
17,000
9.5
Santa Ana
21,945
8.8
3
Huntington Beach
8,540
4.8
Anaheim
11,075
4.4
4
Anaheim
7,950
4.4
Costa Mesa
8,850
3.6
5
Costa Mesa
7,385
4.1
Huntington Beach
8,835
3.5
6
Mission Viejo
7,185
4.0
Lake Forest
8,780
3.5
7
Garden Grove
6,270
3.5
Tustin
8,255
3.3
8
Tustin
6,020
3.4
Garden Grove
8,030
3.2
9
Newport Beach
5,675
3.2
Mission Viejo
7,920
3.2
10
Lake Forest
5,550
3.1
Orange
7,885
3.2
11
Orange
5,200
2.9
Newport Beach
7,605
3.1
12
Rancho Santa Margarita
4,665
2.6
Aliso Viejo
5,550
2.2
13
Aliso Viejo
4,385
2.4
Laguna Niguel
4,395
1.8
14
Uninc. LA County
4,095
2.3
Rancho Santa Margarita
4,340
1.7
15
Laguna Niguel
4,075
2.3
Long Beach
4,220
1.7
27
City


