Corruption Perceptions Index 2006
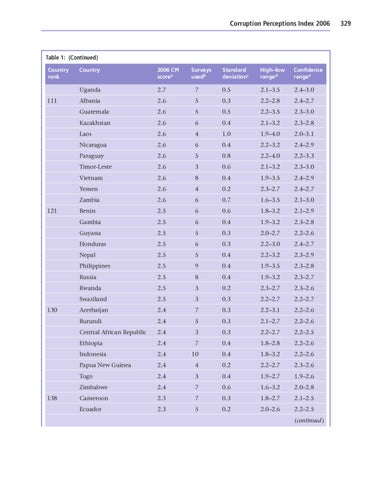
Table 1: (Continued) Country rank
111
121
130
138
Country
2006 CPI scorea
Uganda
2.7
Albania
Surveys usedb
Standard deviationc
High–low ranged
Confidence rangee
7
0.5
2.1–3.5
2.4–3.0
2.6
5
0.3
2.2–2.8
2.4–2.7
Guatemala
2.6
5
0.5
2.2–3.5
2.3–3.0
Kazakhstan
2.6
6
0.4
2.1–3.2
2.3–2.8
Laos
2.6
4
1.0
1.9–4.0
2.0–3.1
Nicaragua
2.6
6
0.4
2.2–3.2
2.4–2.9
Paraguay
2.6
5
0.8
2.2–4.0
2.2–3.3
Timor-Leste
2.6
3
0.6
2.1–3.2
2.3–3.0
Vietnam
2.6
8
0.4
1.9–3.5
2.4–2.9
Yemen
2.6
4
0.2
2.3–2.7
2.4–2.7
Zambia
2.6
6
0.7
1.6–3.5
2.1–3.0
Benin
2.5
6
0.6
1.8–3.2
2.1–2.9
Gambia
2.5
6
0.4
1.9–3.2
2.3–2.8
Guyana
2.5
5
0.3
2.0–2.7
2.2–2.6
Honduras
2.5
6
0.3
2.2–3.0
2.4–2.7
Nepal
2.5
5
0.4
2.2–3.2
2.3–2.9
Philippines
2.5
9
0.4
1.9–3.5
2.3–2.8
Russia
2.5
8
0.4
1.9–3.2
2.3–2.7
Rwanda
2.5
3
0.2
2.3–2.7
2.3–2.6
Swaziland
2.5
3
0.3
2.2–2.7
2.2–2.7
Azerbaijan
2.4
7
0.3
2.2–3.1
2.2–2.6
Burundi
2.4
5
0.3
2.1–2.7
2.2–2.6
Central African Republic
2.4
3
0.3
2.2–2.7
2.2–2.5
Ethiopia
2.4
7
0.4
1.8–2.8
2.2–2.6
Indonesia
2.4
10
0.4
1.8–3.2
2.2–2.6
Papua New Guinea
2.4
4
0.2
2.2–2.7
2.3–2.6
Togo
2.4
3
0.4
1.9–2.7
1.9–2.6
Zimbabwe
2.4
7
0.6
1.6–3.2
2.0–2.8
Cameroon
2.3
7
0.3
1.8–2.7
2.1–2.5
Ecuador
2.3
5
0.2
2.0–2.6
2.2–2.5 (continued )
329