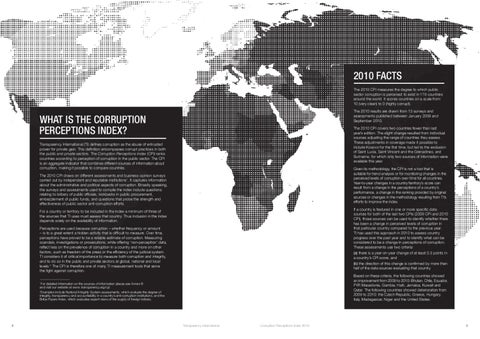
2010 FACTS The 2010 CPI measures the degree to which public sector corruption is perceived to exist in 178 countries around the world. It scores countries on a scale from 10 (very clean) to 0 (highly corrupt). The 2010 results are drawn from 13 surveys and assessments published between January 2009 and September 2010.
WHAT IS THE CORRUPTION PERCEPTIONS INDEX?
The 2010 CPI covers two countries fewer than last year’s edition. The slight change resulted from individual sources adjusting the range of countries they assess. These adjustments in coverage made it possible to include Kosovo for the first time, but led to the exclusion of Saint Lucia, Saint Vincent and the Grenadines, and Suriname, for which only two sources of information were available this year.
Transparency International (TI) defines corruption as the abuse of entrusted power for private gain. This definition encompasses corrupt practices in both the public and private sectors. The Corruption Perceptions Index (CPI) ranks countries according to perception of corruption in the public sector. The CPI is an aggregate indicator that combines different sources of information about corruption, making it possible to compare countries.
Given its methodology, the CPI is not a tool that is suitable for trend analysis or for monitoring changes in the perceived levels of corruption over time for all countries. Year-to-year changes in a country/territory’s score can result from a change in the perceptions of a country’s performance, a change in the ranking provided by original sources or changes in the methodology resulting from TI’s efforts to improve the index.
The 2010 CPI draws on different assessments and business opinion surveys carried out by independent and reputable institutions1. It captures information about the administrative and political aspects of corruption. Broadly speaking, the surveys and assessments used to compile the index include questions relating to bribery of public officials, kickbacks in public procurement, embezzlement of public funds, and questions that probe the strength and effectiveness of public sector anti-corruption efforts.
If a country is featured in one or more specific data sources for both of the last two CPIs (2009 CPI and 2010 CPI), those sources can be used to identify whether there has been a change in perceived levels of corruption in that particular country compared to the previous year. TI has used this approach in 2010 to assess country progress over the past year and to identify what can be considered to be a change in perceptions of corruption. These assessments use two criteria:
For a country or territory to be included in the index a minimum of three of the sources that TI uses must assess that country. Thus inclusion in the index depends solely on the availability of information. Perceptions are used because corruption – whether frequency or amount – is to a great extent a hidden activity that is difficult to measure. Over time, perceptions have proved to be a reliable estimate of corruption. Measuring scandals, investigations or prosecutions, while offering ‘non-perception’ data, reflect less on the prevalence of corruption in a country and more on other factors, such as freedom of the press or the efficiency of the judicial system. TI considers it of critical importance to measure both corruption and integrity, and to do so in the public and private sectors at global, national and local levels.2 The CPI is therefore one of many TI measurement tools that serve the fight against corruption.
(a) there is a year-on-year change of at least 0.3 points in a country’s CPI score, and (b) the direction of this change is confirmed by more than half of the data sources evaluating that country. Based on these criteria, the following countries showed an improvement from 2009 to 2010: Bhutan, Chile, Ecuador, FYR Macedonia, Gambia, Haiti, Jamaica, Kuwait and Qatar. The following countries showed deterioration from 2009 to 2010: the Czech Republic, Greece, Hungary, Italy, Madagascar, Niger and the United States.
For detailed information on the sources of information please see Annex B and visit our website at www. transparency.org/cpi 2 Examples include National Integrity System assessments, which evaluate the degree of integrity, transparency and accountability in a country’s anti-corruption institutions, and the Bribe Payers Index, which evaluates expert views of the supply of foreign bribery. 1
4
Transparency International
Corruption Perceptions Index 2010
5
