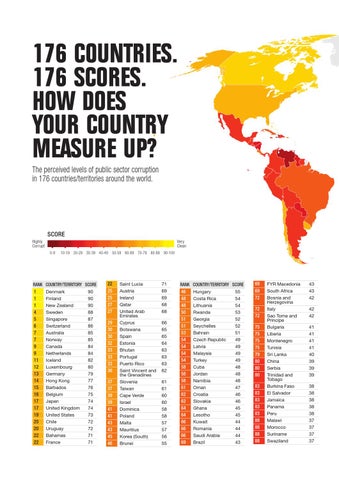
176 COUNTRIES. 176 SCORES. HOW DOES YOUR COUNTRY MEASURE UP? The perceived levels of public sector corruption in 176 countries/territories around the world.
SCORE Highly Corrupt
Very Clean 0-9
10-19
20-29 30-39 40-49
RANK COUNTRY/TERRITORY SCORE 1 1 1 4 5 6 7 7 9 9 11 12 13 14 15 16 17 17 19 20 20 22 22
Denmark Finland New Zealand Sweden Singapore Switzerland Australia Norway Canada Netherlands Iceland Luxembourg Germany Hong Kong Barbados Belgium Japan United Kingdom United States Chile Uruguay Bahamas France
90 90 90 88 87 86 85 85 84 84 82 80 79 77 76 75 74 74 73 72 72 71 71
50-59
22 25 25 27 27 29 30 30 32 33 33 33 36 37 37 39 39 41 41 43 43 45 46
60-69
70-79
80-89
Saint Lucia Austria Ireland Qatar United Arab Emirates Cyprus Botswana Spain Estonia Bhutan Portugal Puerto Rico Saint Vincent and the Grenadines Slovenia Taiwan Cape Verde Israel Dominica Poland Malta Mauritius Korea (South) Brunei
90-100
71 69 69 68 68 66 65 65 64 63 63 63 62 61 61 60 60 58 58 57 57 56 55
RANK COUNTRY/TERRITORY SCORE 46 48 48 50 51 51 53 54 54 54 54 58 58 58 61 62 62 64 64 66 66 66 69
Hungary Costa Rica Lithuania Rwanda Georgia Seychelles Bahrain Czech Republic Latvia Malaysia Turkey Cuba Jordan Namibia Oman Croatia Slovakia Ghana Lesotho Kuwait Romania Saudi Arabia Brazil
55 54 54 53 52 52 51 49 49 49 49 48 48 48 47 46 46 45 45 44 44 44 43
69 69 72 72 72 75 75 75 75 79 80 80 80 83 83 83 83 83 88 88 88 88
FYR Macedonia South Africa Bosnia and Herzegovina Italy Sao Tome and Principe Bulgaria Liberia Montenegro Tunisia Sri Lanka China Serbia Trinidad and Tobago Burkina Faso El Salvador Jamaica Panama Peru Malawi Morocco Suriname Swaziland
43 43 42 42 42 41 41 41 41 40 39 39 39 38 38 38 38 38 37 37 37 37