Diagram 3 Reporting on anti-corruption programmes: Results by question Proportion of companies scoring 1, 0.5, or 0 respectively out of 100 companies Number of companies receiving: 1 point
0.5 point
0 points
Compliance with laws
79
Zero-tolerance statement
12
53
Code applies to all employees
63
Leadership support
57
Improper gifts, hospitality
45
Anti-corruption training
45
Whistleblowing system
48
Code applies to suppliers
37
Monitoring of the programme
25
Transparent political contributions
33
Code applies to agents
23
Prohibition of facilitation payments 5
35 36
1
37
6
12
43
3
48
47
8 49
Prohibition of retaliation for reporting
21
51
1
55
8
15
60
3
64 74
3
94
1
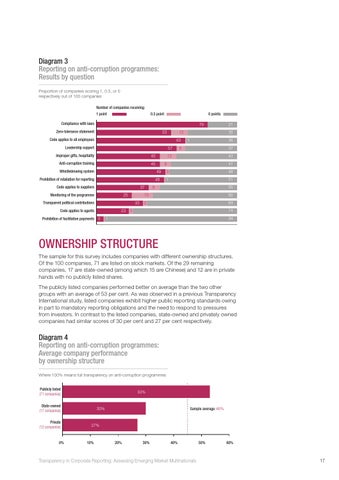
OWNERSHIP STRUCTURE The sample for this survey includes companies with different ownership structures. Of the 100 companies, 71 are listed on stock markets. Of the 29 remaining companies, 17 are state-owned (among which 15 are Chinese) and 12 are in private hands with no publicly listed shares. The publicly listed companies performed better on average than the two other groups with an average of 53 per cent. As was observed in a previous Transparency International study, listed companies exhibit higher public reporting standards owing in part to mandatory reporting obligations and the need to respond to pressures from investors. In contrast to the listed companies, state-owned and privately owned companies had similar scores of 30 per cent and 27 per cent respectively.
Diagram 4 Reporting on anti-corruption programmes: Average company performance by ownership structure Where 100% means full transparency on anti-corruption programmes Publicly listed (71 companies)
53%
State-owned (17 companies) Private (12 companies)
0%
30%
Sample average 46%
27%
10%
20%
30%
40%
Transparency in Corporate Reporting: Assessing Emerging Market Multinationals
50%
60%
17