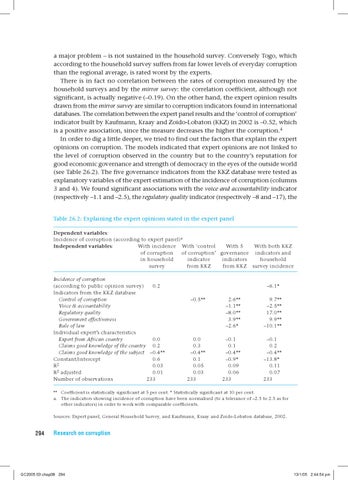
a major problem – is not sustained in the household survey. Conversely Togo, which according to the household survey suffers from far lower levels of everyday corruption than the regional average, is rated worst by the experts. There is in fact no correlation between the rates of corruption measured by the household surveys and by the mirror survey: the correlation coefficient, although not significant, is actually negative (–0.19). On the other hand, the expert opinion results drawn from the mirror survey are similar to corruption indicators found in international databases. The correlation between the expert panel results and the ‘control of corruption’ indicator built by Kaufmann, Kraay and Zoido-Lobaton (KKZ) in 2002 is –0.52, which is a positive association, since the measure decreases the higher the corruption.4 In order to dig a little deeper, we tried to find out the factors that explain the expert opinions on corruption. The models indicated that expert opinions are not linked to the level of corruption observed in the country but to the country’s reputation for good economic governance and strength of democracy in the eyes of the outside world (see Table 26.2). The five governance indicators from the KKZ database were tested as explanatory variables of the expert estimation of the incidence of corruption (columns 3 and 4). We found significant associations with the voice and accountability indicator (respectively –1.1 and –2.5), the regulatory quality indicator (respectively –8 and –17), the Table 26.2: Explaining the expert opinions stated in the expert panel Dependent variables: Incidence of corruption (according to expert panel)a Independent variables: With incidence With ‘control With 5 With both KKZ of corruption of corruption’ governance indicators and in household indicator indicators household survey from KKZ from KKZ survey incidence Incidence of corruption (according to public opinion survey) 0.2 Indicators from the KKZ database Control of corruption Voice & accountability Regulatory quality Government effectiveness Rule of law Individual expert’s characteristics Expert from African country 0.0 Claims good knowledge of the country 0.2 Claims good knowledge of the subject –0.4** Constant/intercept 0.6 R2 0.03 R2 adjusted 0.01 Number of observations 233
–6.1* –0.5**
2.6** –1.1** –8.0** 3.9** –2.6*
9.7** –2.5** 17.0** 9.9** –10.1**
0.0 0.3 –0.4** 0.1 0.05 0.03 233
–0.1 0.1 –0.4** –0.9* 0.09 0.06 233
–0.1 0.2 –0.4** –13.8* 0.11 0.07 233
** Coefficient is statistically significant at 5 per cent. * Statistically significant at 10 per cent. a. The indicators showing incidence of corruption have been normalised (to a tolerance of –2.5 to 2.5 as for other indicators) in order to work with comparable coefficients. Sources: Expert panel, General Household Survey, and Kaufmann, Kraay and Zoido-Lobaton database, 2002.
294
Research on corruption
GC2005 03 chap08 294
13/1/05 2:44:54 pm