GC2005 03 chap08 293
13/1/05 2:44:54 pm
Benin
Burkina Faso
16.3 57.1 10.5 32.9 96.9 76.4 88.9
60.7 5.2 29.2 91.0 72.3 94.1
Madagascar
16.5
Ivory Coast
67.2 78.1
88.4
33.3
5.0
52.0
10.1
Mali
62.3 72.7
91.6
33.8
3.1
56.1
8.2
Niger
69.4 80.5
87.9
35.5
2.2
51.1
10.8
Senegal
84.0 92.3
82.8
21.8
3.8
62.5
9.6
Togo
72.9 85.3
90.3
31.5
5.2
54.0
13.1
Average
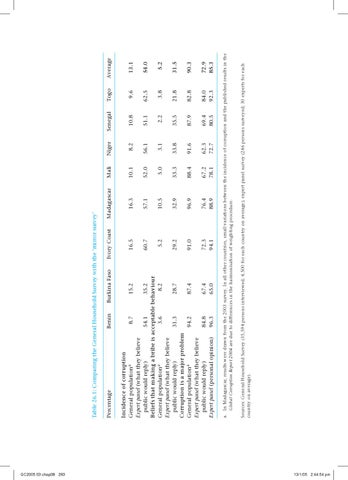
Sources: General Household Survey (35,594 persons interviewed; 4,500 for each country on average); expert panel survey (246 persons surveyed; 30 experts for each country on average).
a. In Madagascar, results were drawn from the 2003 survey. In all other countries, small variations between the incidence of corruption and the published results in the Global Corruption Report 2004 are due to differences in the harmonisation of weighting procedure.
Incidence of corruption General populationa 8.7 15.2 Expert panel (what they believe public would reply) 54.1 35.2 Beliefs that making a bribe is acceptable behaviour General populationa 3.6 8.2 Expert panel (what they believe public would reply) 31.3 28.7 Corruption is a major problem General populationa 94.2 87.4 Expert panel (what they believe public would reply) 84.8 67.4 Expert panel (personal opinion) 96.3 65.0
Percentage
Table 26.1: Comparing the General Household Survey with the ‘mirror survey’