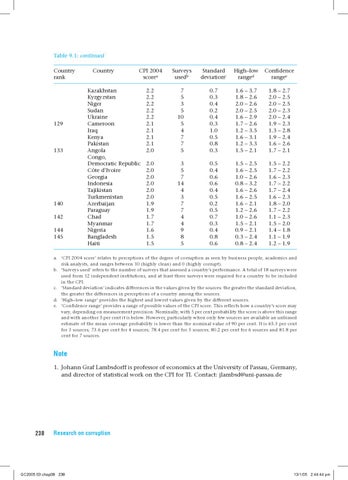
Table 9.1: continued Country rank
129
133
140 142 144 145
Country
CPI 2004 scorea
Kazakhstan Kyrgyzstan Niger Sudan Ukraine Cameroon Iraq Kenya Pakistan Angola Congo, Democratic Republic Côte d’Ivoire Georgia Indonesia Tajikistan Turkmenistan Azerbaijan Paraguay Chad Myanmar Nigeria Bangladesh Haiti
Surveys usedb
Standard deviationc
High–low ranged
Confidence rangee
2.2 2.2 2.2 2.2 2.2 2.1 2.1 2.1 2.1 2.0
7 5 3 5 10 5 4 7 7 5
0.7 0.3 0.4 0.2 0.4 0.3 1.0 0.5 0.8 0.3
1.6 – 3.7 1.8 – 2.6 2.0 – 2.6 2.0 – 2.5 1.6 – 2.9 1.7 – 2.6 1.2 – 3.5 1.6 – 3.1 1.2 – 3.3 1.5 – 2.1
1.8 – 2.7 2.0 – 2.5 2.0 – 2.5 2.0 – 2.3 2.0 – 2.4 1.9 – 2.3 1.3 – 2.8 1.9 – 2.4 1.6 – 2.6 1.7 – 2.1
2.0 2.0 2.0 2.0 2.0 2.0 1.9 1.9 1.7 1.7 1.6 1.5 1.5
3 5 7 14 4 3 7 7 4 4 9 8 5
0.5 0.4 0.6 0.6 0.4 0.5 0.2 0.5 0.7 0.3 0.4 0.8 0.6
1.5 – 2.5 1.6 – 2.5 1.0 – 2.6 0.8 – 3.2 1.6 – 2.6 1.6 – 2.5 1.6 – 2.1 1.2 – 2.6 1.0 – 2.6 1.5 – 2.1 0.9 – 2.1 0.3 – 2.4 0.8 – 2.4
1.5 – 2.2 1.7 – 2.2 1.6 – 2.3 1.7 – 2.2 1.7 – 2.4 1.6 – 2.3 1.8 – 2.0 1.7 – 2.2 1.1 – 2.3 1.5 – 2.0 1.4 – 1.8 1.1 – 1.9 1.2 – 1.9
a. ‘CPI 2004 score’ relates to perceptions of the degree of corruption as seen by business people, academics and risk analysts, and ranges between 10 (highly clean) and 0 (highly corrupt). b. ‘Surveys used’ refers to the number of surveys that assessed a country’s performance. A total of 18 surveys were used from 12 independent institutions, and at least three surveys were required for a country to be included in the CPI. c. ‘Standard deviation’ indicates differences in the values given by the sources: the greater the standard deviation, the greater the differences in perceptions of a country among the sources. d. ‘High–low range’ provides the highest and lowest values given by the different sources. e. ‘Confidence range’ provides a range of possible values of the CPI score. This reflects how a country’s score may vary, depending on measurement precision. Nominally, with 5 per cent probability the score is above this range and with another 5 per cent it is below. However, particularly when only few sources are available an unbiased estimate of the mean coverage probability is lower than the nominal value of 90 per cent. It is 65.3 per cent for 3 sources; 73.6 per cent for 4 sources; 78.4 per cent for 5 sources; 80.2 per cent for 6 sources and 81.8 per cent for 7 sources.
Note 1. Johann Graf Lambsdorff is professor of economics at the University of Passau, Germany, and director of statistical work on the CPI for TI. Contact: jlambsd@uni-passau.de
238
Research on corruption
GC2005 03 chap08 238
13/1/05 2:44:44 pm