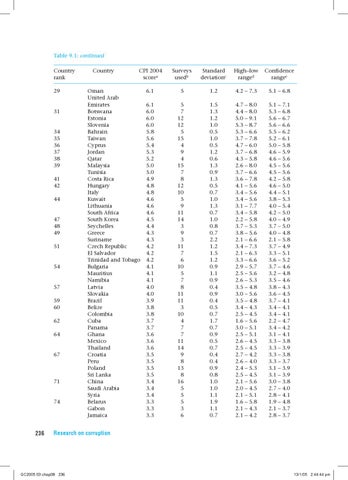
Table 9.1: continued Country rank 29 31 34 35 36 37 38 39 41 42 44 47 48 49 51 54 57 59 60 62 64 67
71 74
236
Country
CPI 2004 scorea
Oman United Arab Emirates Botswana Estonia Slovenia Bahrain Taiwan Cyprus Jordan Qatar Malaysia Tunisia Costa Rica Hungary Italy Kuwait Lithuania South Africa South Korea Seychelles Greece Suriname Czech Republic El Salvador Trinidad and Tobago Bulgaria Mauritius Namibia Latvia Slovakia Brazil Belize Colombia Cuba Panama Ghana Mexico Thailand Croatia Peru Poland Sri Lanka China Saudi Arabia Syria Belarus Gabon Jamaica
Surveys usedb
Standard deviationc
High–low ranged
Confidence rangee
6.1
5
1.2
4.2 – 7.3
5.1 – 6.8
6.1 6.0 6.0 6.0 5.8 5.6 5.4 5.3 5.2 5.0 5.0 4.9 4.8 4.8 4.6 4.6 4.6 4.5 4.4 4.3 4.3 4.2 4.2 4.2 4.1 4.1 4.1 4.0 4.0 3.9 3.8 3.8 3.7 3.7 3.6 3.6 3.6 3.5 3.5 3.5 3.5 3.4 3.4 3.4 3.3 3.3 3.3
5 7 12 12 5 15 4 9 4 15 7 8 12 10 5 9 11 14 3 9 3 11 7 6 10 5 7 8 11 11 3 10 4 7 7 11 14 9 8 13 8 16 5 5 5 3 6
1.5 1.3 1.2 1.0 0.5 1.0 0.5 1.2 0.6 1.3 0.9 1.3 0.5 0.7 1.0 1.3 0.7 1.0 0.8 0.7 2.2 1.2 1.5 1.2 0.9 1.1 0.9 0.4 0.9 0.4 0.5 0.7 1.7 0.7 0.9 0.5 0.7 0.4 0.4 0.9 0.8 1.0 1.0 1.1 1.9 1.1 0.7
4.7 – 8.0 4.4 – 8.0 5.0 – 9.1 5.3 – 8.7 5.3 – 6.6 3.7 – 7.8 4.7 – 6.0 3.7 – 6.8 4.3 – 5.8 2.6 – 8.0 3.7 – 6.6 3.6 – 7.8 4.1 – 5.6 3.4 – 5.6 3.4 – 5.6 3.1 – 7.7 3.4 – 5.8 2.2 – 5.8 3.7 – 5.3 3.8 – 5.6 2.1 – 6.6 3.4 – 7.3 2.1 – 6.3 3.3 – 6.6 2.9 – 5.7 2.5 – 5.6 2.6 – 5.3 3.5 – 4.8 3.0 – 5.6 3.5 – 4.8 3.4 – 4.3 2.5 – 4.5 1.6 – 5.6 3.0 – 5.1 2.5 – 5.1 2.6 – 4.5 2.5 – 4.5 2.7 – 4.2 2.6 – 4.0 2.4 – 5.3 2.5 – 4.5 2.1 – 5.6 2.0 – 4.5 2.1 – 5.1 1.6 – 5.8 2.1 – 4.3 2.1 – 4.2
5.1 – 7.1 5.3 – 6.8 5.6 – 6.7 5.6 – 6.6 5.5 – 6.2 5.2 – 6.1 5.0 – 5.8 4.6 – 5.9 4.6 – 5.6 4.5 – 5.6 4.5 – 5.6 4.2 – 5.8 4.6 – 5.0 4.4 – 5.1 3.8 – 5.3 4.0 – 5.4 4.2 – 5.0 4.0 – 4.9 3.7 – 5.0 4.0 – 4.8 2.1 – 5.8 3.7 – 4.9 3.3 – 5.1 3.6 – 5.2 3.7 – 4.6 3.2 – 4.8 3.5 – 4.6 3.8 – 4.3 3.6 – 4.5 3.7 – 4.1 3.4 – 4.1 3.4 – 4.1 2.2 – 4.7 3.4 – 4.2 3.1 – 4.1 3.3 – 3.8 3.3 – 3.9 3.3 – 3.8 3.3 – 3.7 3.1 – 3.9 3.1 – 3.9 3.0 – 3.8 2.7 – 4.0 2.8 – 4.1 1.9 – 4.8 2.1 – 3.7 2.8 – 3.7
Research on corruption
GC2005 03 chap08 236
13/1/05 2:44:44 pm