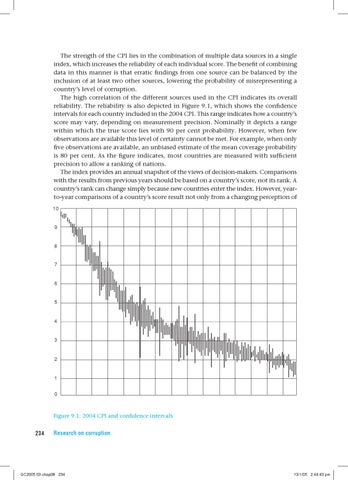
The strength of the CPI lies in the combination of multiple data sources in a single index, which increases the reliability of each individual score. The benefit of combining data in this manner is that erratic findings from one source can be balanced by the inclusion of at least two other sources, lowering the probability of misrepresenting a country’s level of corruption. The high correlation of the different sources used in the CPI indicates its overall reliability. The reliability is also depicted in Figure 9.1, which shows the confidence intervals for each country included in the 2004 CPI. This range indicates how a country’s score may vary, depending on measurement precision. Nominally it depicts a range within which the true score lies with 90 per cent probability. However, when few observations are available this level of certainty cannot be met. For example, when only five observations are available, an unbiased estimate of the mean coverage probability is 80 per cent. As the figure indicates, most countries are measured with sufficient precision to allow a ranking of nations. The index provides an annual snapshot of the views of decision-makers. Comparisons with the results from previous years should be based on a country’s score, not its rank. A country’s rank can change simply because new countries enter the index. However, yearto-year comparisons of a country’s score result not only from a changing perception of �� � � � � � � � � � �
Figure 9.1: 2004 CPI and confidence intervals
234
Research on corruption
GC2005 03 chap08 234
13/1/05 2:44:43 pm