2 minute read
What’s Flying in the Twitterverse


The following are some industry Tweets from early August 2022.
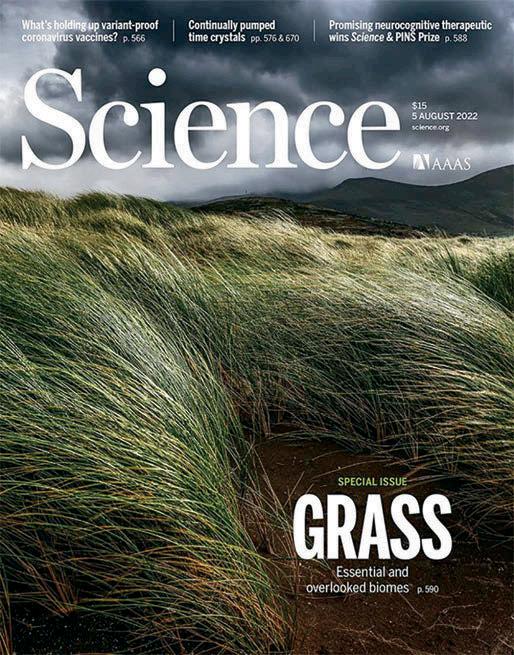
Grasses tend to be undervalued but have influenced the trajectory of human history through their domestication as food staples, as well as natural ecosystems worldwide. A special issue of Science explores the unrecognized value of grass: fcld.ly/bo80dpr
https://www.science.org/toc/science/377/6606
Retweeted on August 7 by TWCA @_tgwca From a Science Magazine tweet @ScienceMagazine
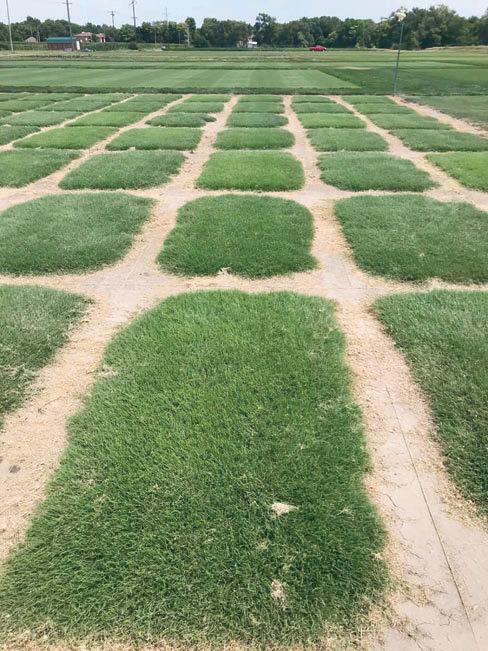
Nice to visit Lincoln and see some of the new lines of buffalograss varieties being developed in the UNL breeding program. Although it’s early in the evaluation process, many of these are looking great after being established by plugs in May.
Tweeted on August 6 by Geoffrey Rinehart, PhD @ gjrinehart
@GCSAA’s recent water management study showed promising trends in water usage on U.S. golf facilities. Get the
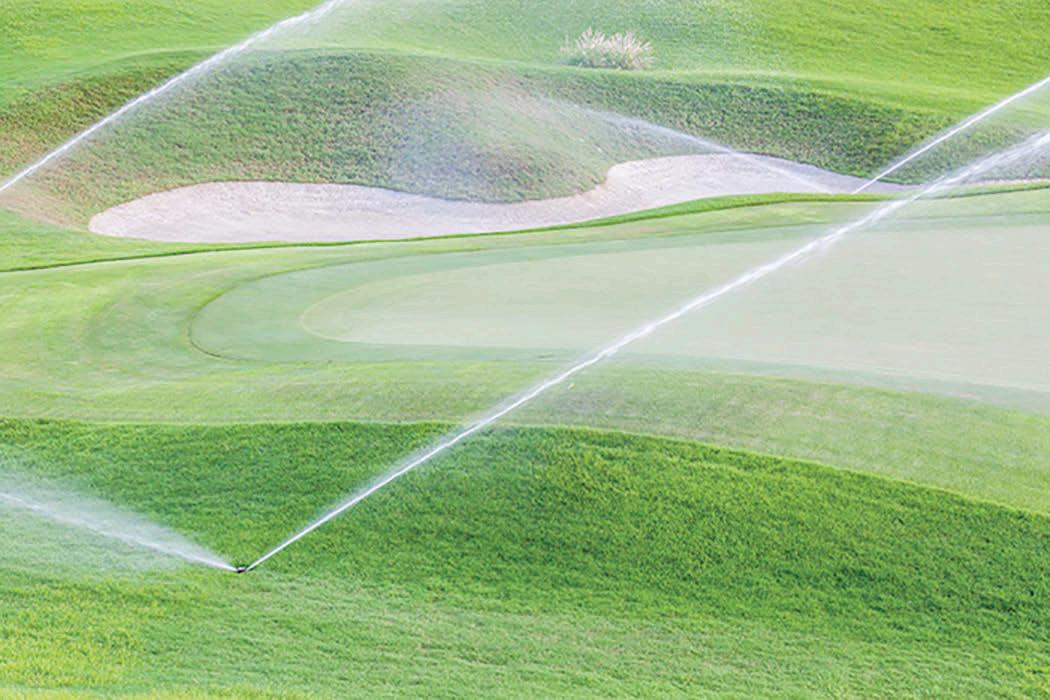
breakdown here: bit.ly/3P3Nj3V https://gcmonline.com/research/news/watermanagement-study-results-2022
Retweeted on August 7 by Dan Sandor, PhD @VTTurfTeaching From a Golf Course Management magazine tweet @ GCM_Magazine
Kentucky bluegrass fans – looking for the best bluegrass for your fall plantings? Our latest data is now out on our website. ntep.org/reports/kb17/k… ntep.org/reports/kb17/kb17_229/kb17_22-9.htm
Tweeted on August 5 by Kevin Morris @kmorris_NTEP

WELCOME NEW & RETURNING MEMBERS
Jon Clark
Rhino Ag 916 N. 600 E Road Sibley, IL 61773 217-714-3507 jclark@rhinoag.com
Kelsey Sease
Crop Vitality, Tessenderlo Kerley 2910 N. 44 St., Ste 100 Phoenix, AZ 85018 480-364-0916 kelsey.sease@tkinet.com
WEATHER WATCH

Track drought conditions across the U.S. using the current weekly Drought Summary Map, like the one above. Updated information is posted each week with the most recent map available at the link that follows. https:// droughtmonitor.unl.edu/CurrentMap.aspx For local details and impacts, contact your State Climatologist at the American Association of State Climatologists (https://stateclimate.org/) or your Regional Climate Center of the National Oceanic and Atmospheric Administration (NOAA) (https://www.ncdc.noaa.gov/customer-support/partnerships/regional-climate-centers) An always current resource for sod producers is the Crop Condition and Soil Moisture Analytics (Crop-CASMA), a web-based tool to help visualize soil moisture and crop vegetation conditions. It was designed and developed by the National Agricultural Statistics Service (NASS) in collaboration with the U.S. National Aeronautics and Space Administration (NASA) and the George Mason University (GMU) Center for Spatial Information Science and Systems. This tool is free to the public and available at: https://cloud.csiss.gmu.edu/Crop-CASMA/. Crop-CASMA is not available for print because it is a web-based cloud image that constantly changes.


