
59 minute read
The Lawn Institute Turfgrass Research Update


THE LAWN INSTITUTE
TURFGRASS RESEARCH UPDATE
By Casey Reynolds, PhD
The Lawn Institute (TLI) has a long-standing history of funding natural grass research at nationally and globally recognized universities. Each year, TLI sends out a call for proposals to university researchers throughout the world to be compiled and reviewed by the TLI Research Committee at the TPI International Education Conference. The 2022 TLI Research Committee members listed in Table 1 are comprised of TPI members, staff, university educators, and industry personnel in order to ensure that TPI members and their interests are fully represented in the process while also leaning on university, United States Golf Association (USGA), and National Turfgrass Evaluation Program (NTEP) personnel for input on current research at other institutions.
Table 1. 2022 TLI Research Committee Members Committee Member Position Company
Duane Klundt Chair Mountain View Seeds Lindy Murff TPI Board Liaison Murff Turf Farm Larry LeMay TPI Board Liaison A-G Sod Farms, Inc. Steve Griffen Member Saratoga Sod Farm, Inc. Spencer Mendenhall Member Raft River Sod Sarah Nolte Member Blue Grass Enterprises, Inc. Jack Karlin Member TWCA Casey Reynolds, PhD Advisor TPI Jay McCurdy, PhD Advisor Mississippi State University Aaron Patton, PhD Advisor Purdue University John Sorochan, PhD Advisor University of Tennessee Kevin Morris Advisor NTEP
*Advisors to the committee do not vote on projects but are present to provide technical input on the quality and potential impact of proposals.
Applications for research funds can be requested on any topic, but the TLI Research Committee places priority on specific research areas that serve natural turfgrass producers and the turfgrass industry. With the help of the TLI research committee, these areas are updated each year and are listed below. Other basic guidelines of the proposals include: applicants are encouraged to adhere to all TLI forms, formats, and deadlines for full consideration of proposals; proposals for single or multiple-year projects will be considered as long as the years and funding amounts are clearly stated; funds cannot be used for faculty salaries; proposals seeking funds for capital expenditures will be reviewed on a case-by-case basis; and overhead or administrative costs shall be held to an absolute minimum, but will not exceed 16 percent.
TLI Research Focus Areas
• Cultural Impacts of Natural Grass - Research that includes, but is not limited to, societal health and well-being, fitness, athletic field safety, socioeconomics, consumer attitudes, etc. • Environmental Awareness of Natural Grass - Research that includes, but is not limited to, carbon sequestration, heat abatement, pollution entrapment, soil remediation, run-off reductions, etc. • Natural Grass Input Reductions - Research that includes, but is not limited to, drought tolerance, reduced water use, nutrient requirements, traffic tolerance, integrated pest management, etc. • Extending Harvested Shelf-Life of Natural Grass • Reducing Production Costs of Natural Grass • Natural Grass Research Communication & Education - Information that can be used to develop content on
The Lawn Institute website for educating policymakers, homeowners, and the general public on turfgrass science, management, impacts, etc. This can include literature reviews on environmental impacts, natural grass benefits, region-specific natural grass selection and management, weed/insect/disease control, and more.
Last year, the committee received seven research proposals focused on items such as genotype screening for specific traits or stress responses, irrigation requirements for diverse landscapes, sod installation techniques, insect control, reclaimed water, and soil health. Following individual review and ranking of the projects, The Lawn Institute Research Committee met during the February 2022 TPI International Education Conference to review, discuss, and vote on these research proposals. The university research projects selected for funding in 2022 are listed below in Table 2 along with past projects that are still currently being funded or that were concluded in 2021. These projects represent a wide range of topics that can benefit TPI members both locally and globally.
Table 2. Research Projects Funded by The Lawn Institute in 2022.
TLI Research Project Title Principal Institution Approved Total Grant
Determining the Impact of Post-planting Cultural Practices on Sodded Lawn Water Needs in the Cool-Humid Region Athlete Hydration during Physical Activity in Excessive Heat on Artificial Turf and Natural Grass
Long-term Environmental Impacts and Energy Balance of Lawn Removal and Conversion to Alternative Landscapes Sod Strength Characteristics of 24 Fine fescue Cultivars Cale Bigelow, PhD Purdue University 2020-21 $20.000
Chase Straw, PhD, and Steven Reichman, PhD Texas A&M 2021 $5,000
Ben Wherley, PhD Texas A&M 2021-23 $30,000
Aaron Patton, PhD, and Ross Braun Purdue University 2021-23 $20,351
Irrigation Requirements and Consumer Preference for Six Diverse Landscapes in the Arid Western U.S.
Investigating Environmental Implications of Reclaimed Water Use for Turfgrass Areas
Stress Response Characteristics Facilitated by Endophytes in Commercially Available Perennial Ryegrass, Tall Fescue, and Fine Fescue Cultivars in Oregon USGA/NTEP National Water-Use Trial – Warm-Season Species Tony Koski, PhD Colorado State University 2022-24 $9,450
Marco Schiavon, PhD University of Florida 2022-23 $19,780
Alec Kowalewski, PhD Oregon State University 2022-23 $20,000
Kevin Morris NTEP 2018-21 $30,000
(2020-21, $20,000)
The overall goal of this project is to document the effects of various post-planting cultural management practices that could help to reduce supplemental water needs of sodded Kentucky bluegrass lawns.
Experimental Procedures
A locally sourced (Purdy Sod, Lafayette, IN) Kentucky bluegrass sod blend was planted in a fixed roof rain-out shelter in the fall of 2019 on a silt-loam soil at the William H. Daniel Turfgrass Research Center in West Lafayette, IN. The study area was divided in the fall of 2019 to assess the effects of various post-planting cultural inputs for their effect on managing the sod layer. A factorial arrangement of four cultural practices were implemented, they were: spring/fall core aeration (3/4-inch [1.905 cm.] tines), spring/fall compost (vermicompost), a surfactant (liquid applied in 2020 and using surfactant on an organic fertilizer granular carrier in 2021) and overseeding with a turf-type tall fescue blend (10 lbs./1000 sq. ft. [4.536 kg./92.903 sq. m.]) in the autumn of 2019 and 2020 in conjunction with compost application. Soil cultivation was stripped across each replication while compost, soil surfactant, and overseeding treatments were randomized within each strip with three replications of each treatment.
Treatments were initiated in the fall of 2019 with core aeration and .50 cubic ft. (.0142 cubic m.) of compost applied on 22 October 2019; 22 April and 5 June 2020; and a liquid soil surfactant applied on 25 October 2019, and 5 June 2020, and watered into the soil; overseeding occurred on 24 October 2019, and 22 October 2020, using ‘Hound-Dogs’ turf-type tall fescue blend (DLF-Pickseed, Halsey, OR). The turf was maintained at 3 inches (7.5 cm.) using a rotary mower and mowed twice weekly prior to the
deficit irrigation cycle. Following study initiation, mowing was only done as needed to minimize any wheel tracking of stressed turf which might affect digital imaging. The area received approximately 3.0 lbs. (1.361 kg.) of nitrogen annually from a predominantly controlled release granular fertilizer.
Supplemental irrigation needs were determined using a deficit irrigation strategy based on a 70 percent green color threshold (GCT70). The deficit irrigation program began on 30 June 2021, and ended on 13 September 2021. Prior to the deficit irrigation period the entire area was uniformly hydrated via overhead irrigation to maximize the soil water reservoir of this silt-loam soil. Thereafter, the center of each plot was imaged using a digital camera and light box every three to four days depending upon turf response. Images were analyzed for digital green color using a Java-based software program, Turf Analyzer. Once an individual plot fell below the 70 percent green color threshold that plot received .50 inch (1.27 cm.) of water from a hose equipped with a flow meter and the application was split into two .25 inch (.635 cm.) applications approximately 30 minutes apart to prevent runoff and border effects. The GCT70 threshold was selected based on previous experience in maintaining a lawn turf at a minimally acceptable level of green color and density. Additionally, visual quality was regularly rated on a 0 to 10 scale where 0=brown, dead turf; 6=minimally acceptable lawn turf; and 10=optimal uniformity, density, and color.
Key Findings
In the second year of the study the supplemental irrigation treatments received 5.3 to 8.6 inches (13.462 to 21.844 cm.) of water (Figure 1). Comparatively, in the first year, supplemental irrigation needs ranged from 7.7 to 8.9 inches (19.558 to 22.606 cm.) of water with only slight differences among treatments. As in year one, the core aeration treatment benefits were negligible and thus data pooled across cultivation. The non-treated sod and the sod receiving compost only required the most supplemental irrigation (8.6 and 8.3 inches) (21.844 to 21.082 cm.), respectively. The granular surfactant and surfactant + vermicompost received 7.7 and 7.1 inches (19.558 to 18.034 cm.), respectively. The most impact occurred in any treatment that had been overseeded with turf-type tall fescue (TTTF) with supplemental irrigation ranging from 5.3 to 6.3 inches (13.462 to 16.002 cm.).
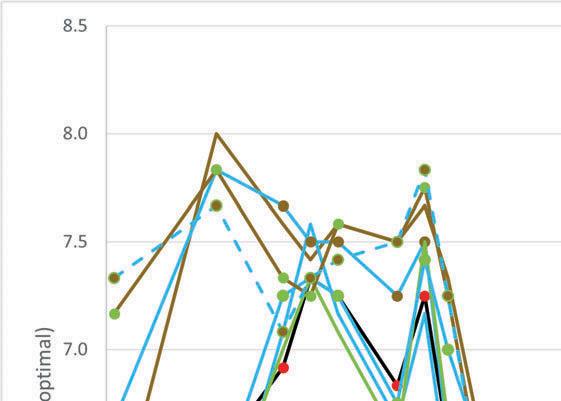
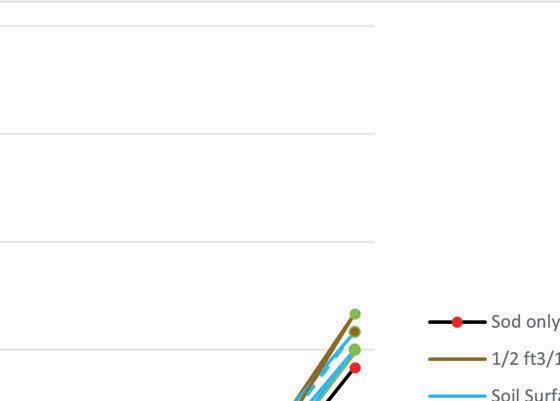
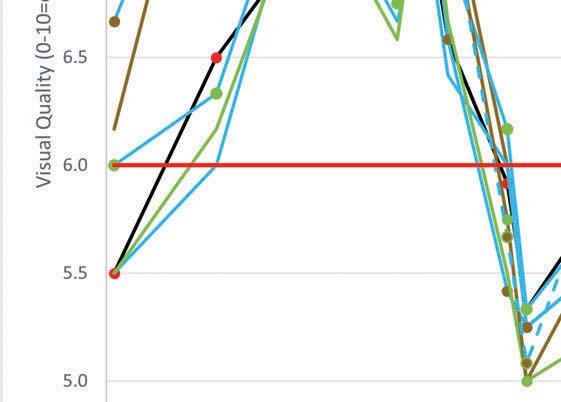
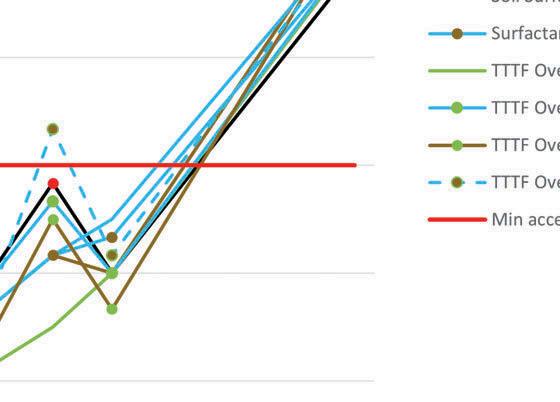
For seasonal turf appearance (April – September) values ranged from 5.3-8.0 (Figure 2). Higher values were associated with any treatment that received compost applications in the early spring, and during the deficit supplemental irrigation phase, those treatments that had been overseeded with TTTF had a higher visual appearance. For digital green color during the supplemental irrigation phase values ranged from roughly 80-90 percent at the beginning of the trial with lower values associated with the non-treated sod, vermicompost, or granular surfactant only treatments (Figure 3). Higher values were associated with those treatments containing TTTF overseeding combined with vermicompost and/or a surfactant. All treatments except the TTTF overseeding alone fell below the 70 percent green color threshold approximately 30 days after initiation. In general, those treatments containing TTTF or a surfactant appeared to be more responsive and resilient in terms of summer green color to the supplemental irrigation treatments.
This study will be continued in 2022 to determine if there are long term effects and benefits of these cultural inputs on the supplemental irrigation needs of sodded Kentucky bluegrass lawns.
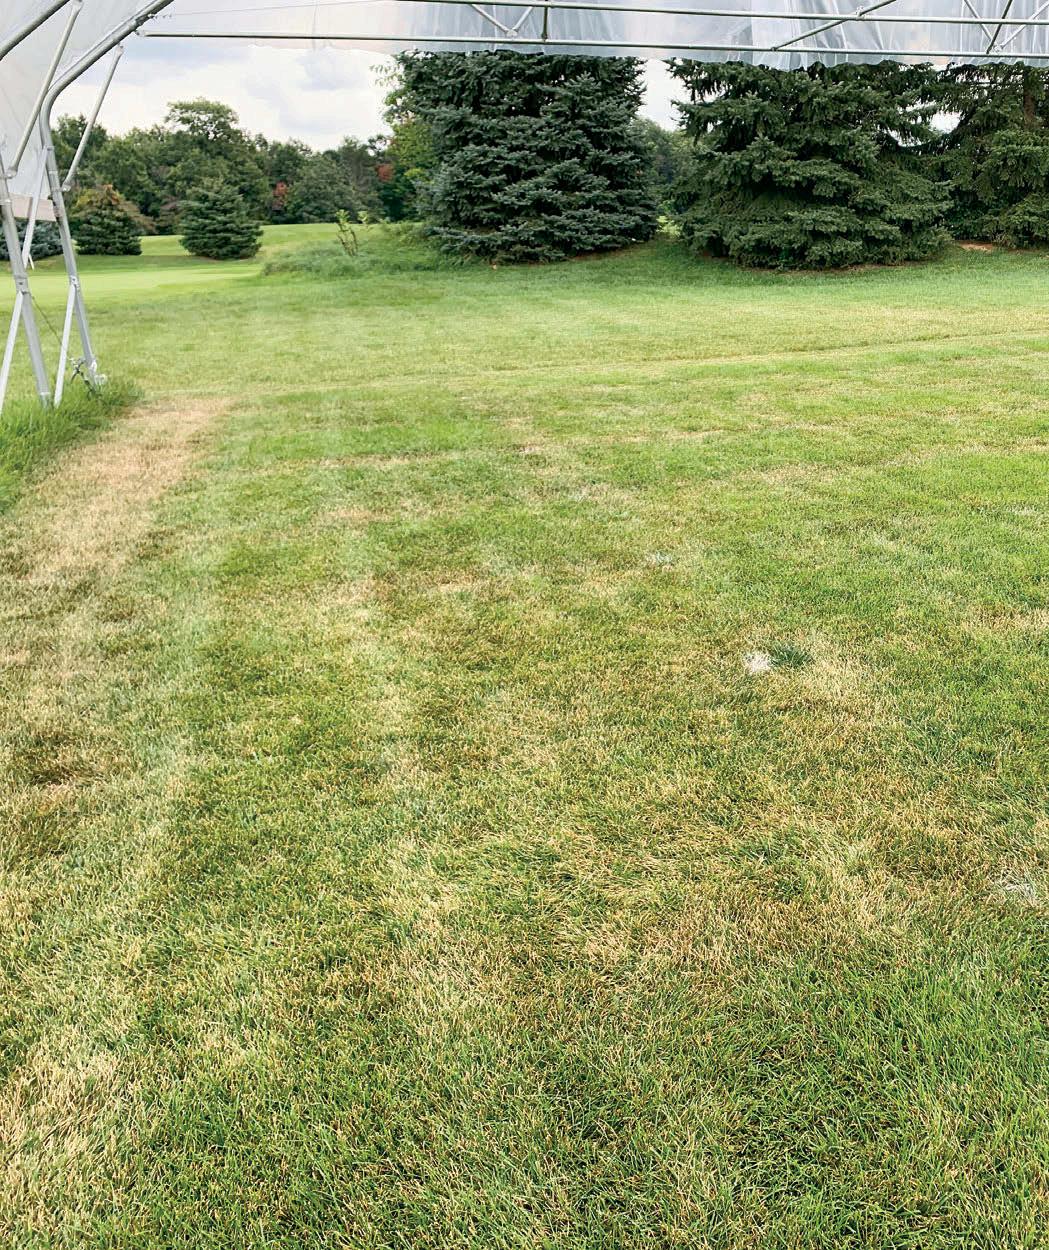
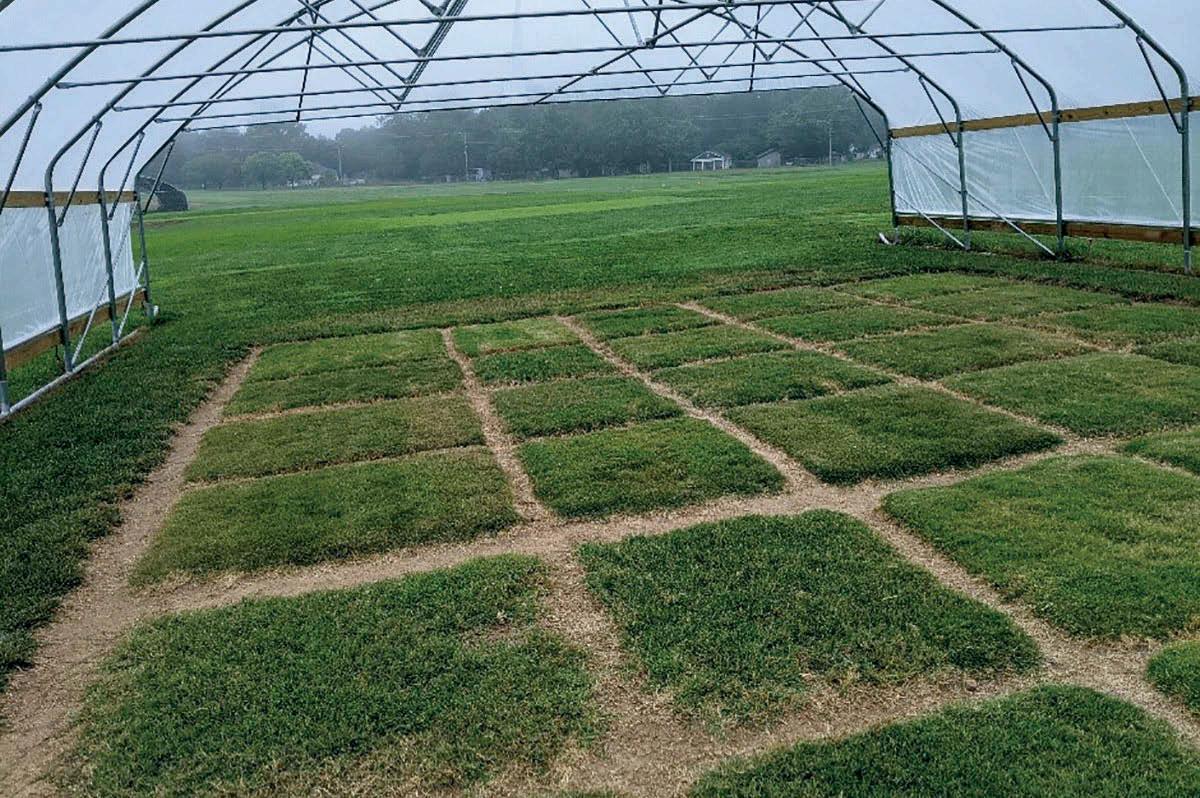
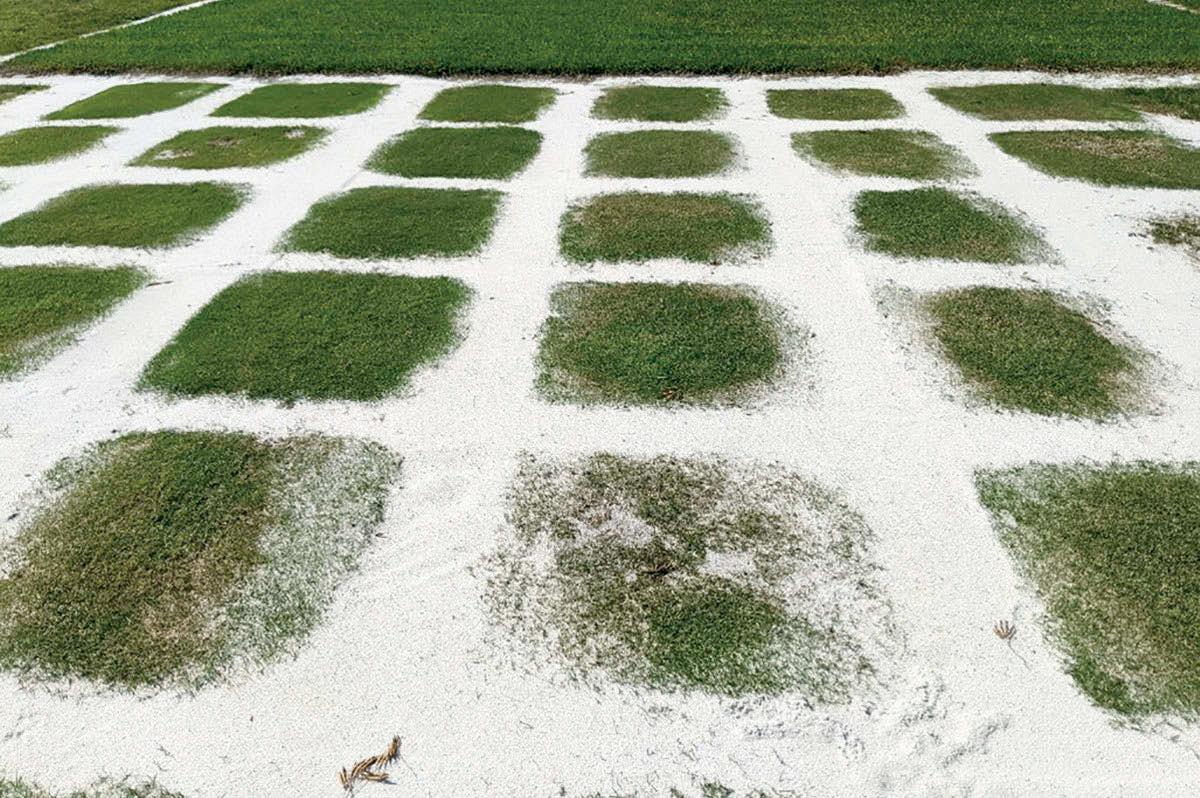
Research plots are shown under the fixed roof rain-out shelter for the project: Determining the Impact of Post-planting Cultural Practices on Sodded Lawn Water Needs in the Cool-Humid Region. Lead researcher for this project is Cale Bigelow, PhD, Purdue University.
Figure 1. Kentucky bluegrass sod summer supplemental irrigation needs as affected by compost, soil surfactant application, and turf-type tall fescue overseeding – 2021 (study year 2)
Figure 2. Seasonal trends in visual quality for a Kentucky bluegrass sod as affected by compost, soil surfactant application, and turf-type tall fescue overseeding – 2021 (Study year 2) – Decficit supplemental irrigation occurred from 30 June to 13 September 2021
(2021, $5,000)
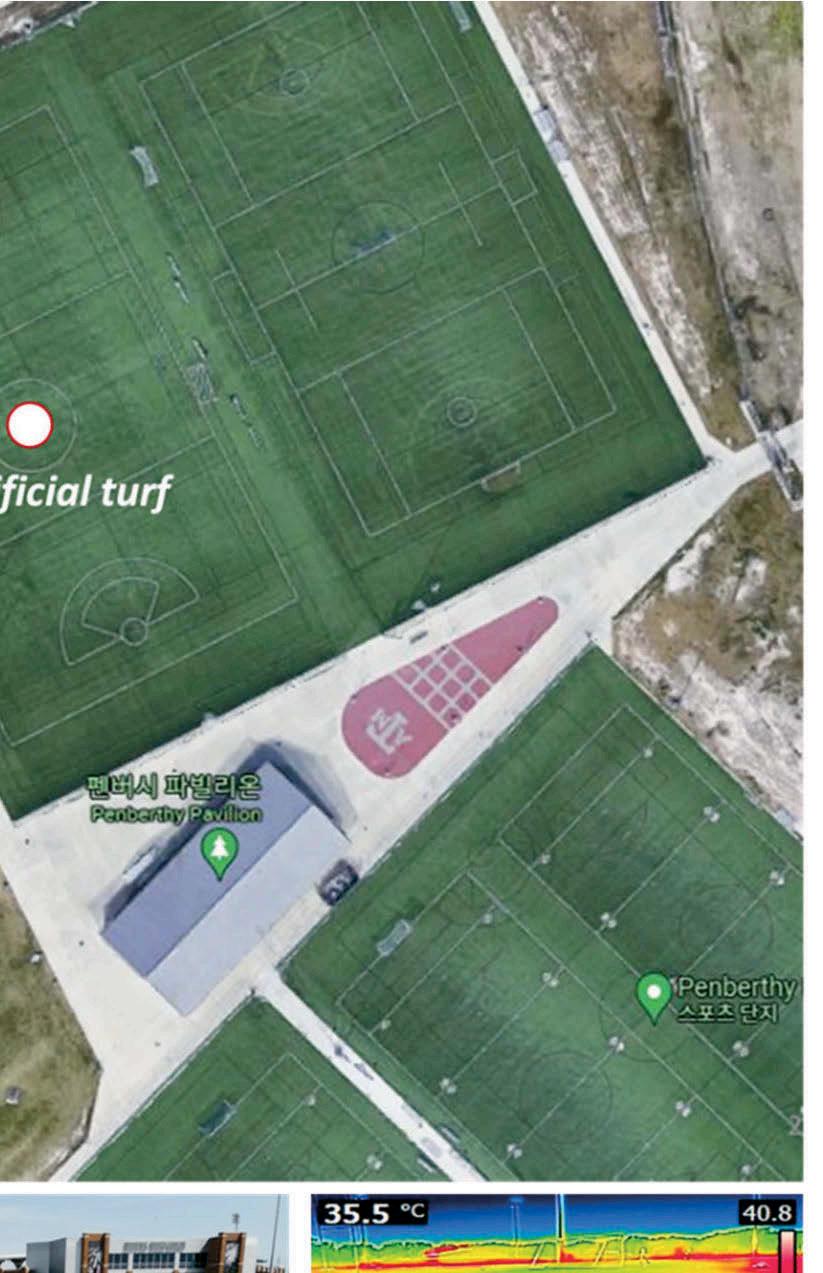
Editor’s Note: An earlier report of this research project was featured in the article, “Assessing Differences in the Thermal Stress of Soccer Players on Natural Turfgrass and Artificial Turf,” in the April 2022 issue of SportsField Management magazine.
Study site
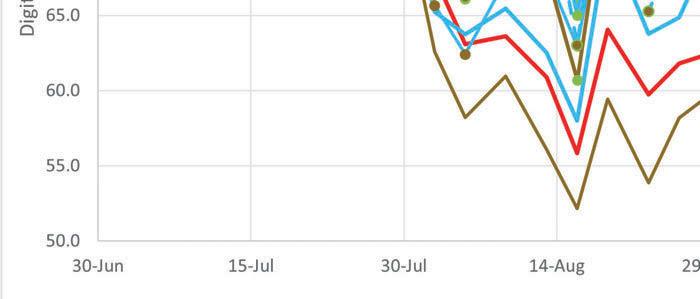
Two soccer fields at Penberthy Rec Sports Complex in College Station, Texas, were selected as sites for the study. According to the Köppen climate classification, College Station’s climate is considered Humid Subtropical Climate (Cfa), where the average daily high temperature between June and September is above 88.8 degrees Fahrenheit (F) [31.56 degrees Celsius (C)].
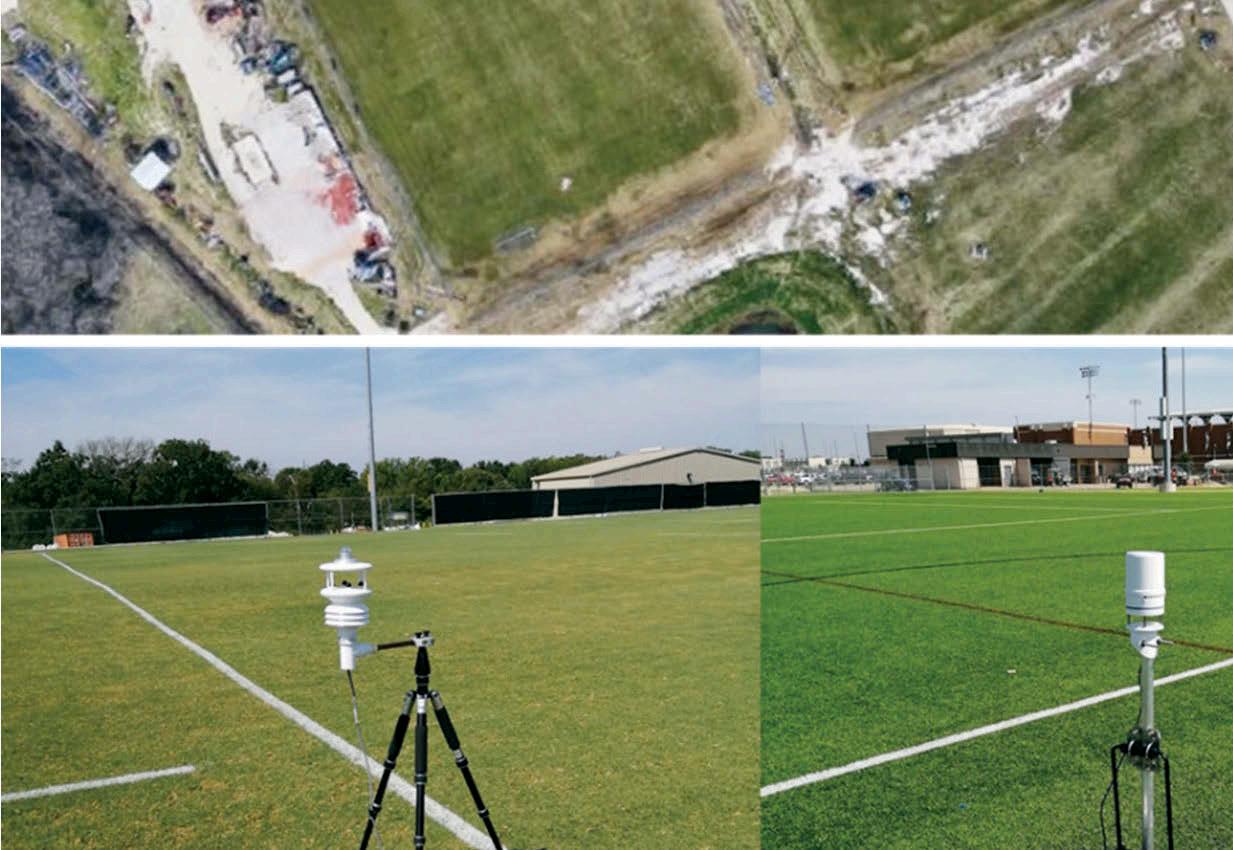
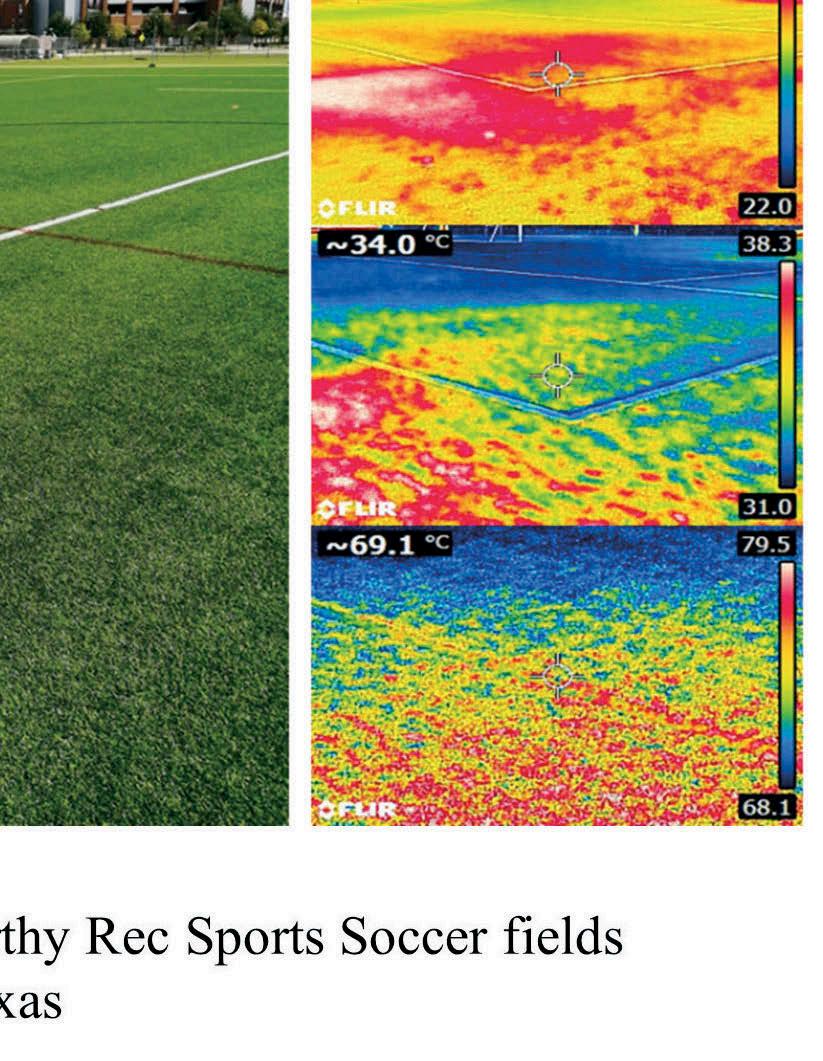
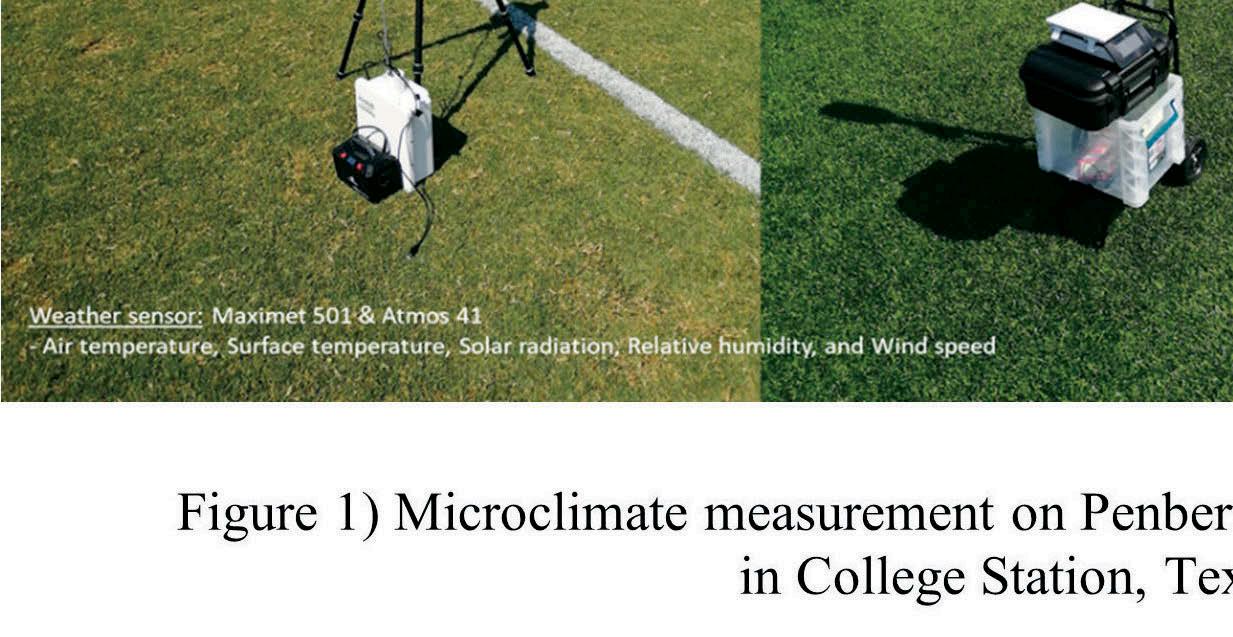
Both soccer fields are managed by SSC Services for Education at Texas A&M University. The NT field was 105,000 sq. ft. (9,754.82 sq. m) and consisted of ‘Tifway 419’ hybrid bermudagrass on native soil, and the AT was 115,000 sq. ft. (10,683.85 sq. m) and consisted of Astroturf RootZone 3D3 Blend 52 that was installed in 2008 and had a blend of monofilament, slit film, and nylon “root-zone” fibers with crumb rubber infill. The area around the fields was wide-open with no presence of natural or man-made objects nearby (e.g., buildings, water bodies, trees, and vehicle roads) that may potentially affect thermal conditions. The study area location, field layouts, photographs of the weather sensors used, and infrared thermal imagery taken from grass and turf are shown in Figure 1.
Project Report by YouJoung Kim, PhD, Department of Landscape Architecture and Urban Planning; Chase Straw, PhD, Department of Soil and Crop Sciences; Steven E. Riechman, PhD, Department of Health and Kinesiology; Brown D. Robert, PhD, Department of Landscape Architecture and Urban Planning; Texas A&M University, College Station, Texas.
Playing soccer on a scorching hot summer day may affect athletes’ physical performance and lead to exertional heat illness. Microclimates, human-level meteorological conditions modified by nearby man-made and natural objects, have been shown to be significantly impacted by differences between natural turfgrass (NT) and artificial turf (AT) (Francis, 2018; Jim, 2017; Guyer, 2020). But less attention has been paid to how athletes’ thermal sensation is affected between the two field types. Therefore, the purpose of this study was to compare Texas A&M University Men’s Club Soccer players’ thermal stress when competing on NT and AT fields. While quantifying objective and subjective thermal comfort, particular attention was given to determine differences in the players’ physiological and perceived thermal stress on each field type. Microclimate and questionnaire survey data were collected on each field type and from all players, respectively over four summer days in September 2021. An energy budget model that can estimate human thermal comfort using energy flux theory was used to quantify their physiological thermal stress.
Data Collection Microclimate measurement
Microclimate conditions of the soccer fields were measured on hot, sunny summer days (September 7, 8, 21, and 22 of 2021). Two sets of weather sensors (Maximet 501 and ATOMS 41) were installed at the center of each natural turfgrass and artificial turf field. The microclimate—air temperature (degrees F), relative humidity (percentage), wind speed (miles per hour [mph]), wind direction, and solar radiation (watts per square meter [W/m2])—was collected from 11:00 AM to 6:00 PM CST with a one-minute recording interval. In addition, the surface temperature was measured every 15 minutes on both field types by two trained surveyors using a thermal infrared camera (FLIR IR E5). The measurement height of those sensors was five feet above the ground to represent the thermal conditions at an athlete’s chest level. The summary of measured microclimate over four days is presented in Table 1. Although the same weather sensors were not used for data collection, they were thoroughly calibrated prior by multiple field tests.
Table 1) Summary of Microclimate Condition on Penberthy Soccer Field
Date Air temperature (°F) Solar radiation (W/m2) Relative humidity (%) Wind speed (mph)
Sep 7 Mean 91.92 810.26 33.75 3.81 Sd 2.52 156.61 7.25 0.46
Sep 8 Mean 91.49 622.89 32.23 7.41 Sd 1.65 314.81 3.43 1.70
Sep 21 Mean 91.27 570.96 55.71 6.54 Sd 3.09 136.72 8.53 1.84
Sep 22 Mean 83.18 736.66 26.15 8.27 Sd 0.40 105.07 0.36 0.59
Total Mean 89.46 685.19 36.96 6.50
Sd 1.91 178.30 4.89 1.15
* Standard deviation (Sd)
Questionnaire survey
An on-site questionnaire survey was adopted to measure the perceived thermal stress that the soccer players felt during matches. Over the four days of data collection, six soccer matches (6 versus 6) were played with TAMU Men’s Club Soccer players who volunteered as study participants. Two matches were held approximately 11:00 AM to 1:00 PM CST, and the other four matches approximately 2:00 to 4:00 PM CST to have a wide range of daytime field thermal conditions. Matches consisted of four quarters, where each quarter of a match lasted 22.5 minutes with a 10-minute break in between. At each break, three out of 12 players were randomly asked to respond to eight questions about how thermally comfortable they were during the matches with a 10-point rating scale, where 0 represented “much too cold” and 10 represented “much too hot”. These questions can be grouped in three parts: 1) perceived exertion (i.e., a laborious or perceptible effort), 2) perceived surface heat conditions, 3) perceived thermal stress. The response rate was 87.5 percent, meaning 63 out of 72 participants responded to the survey without missing values.
Estimation of objective thermal stress
To evaluate the athlete’s physiological thermal stress, the COMFA energy budget model was employed. It is an outdoor thermal comfort index that estimates the objective thermal comfort of a person based on energy budget equation. In other words, it calculates the physiological thermal load that the human body receives to maintain thermal balance with the surrounding outdoor environment. The energy budget is described as follows:
where ΔS is the change in heat storage (W/m2). When the change in heat storage is near 0, the inputs and outputs of energy would nearly balance, and a person would be thermally comfortable. A large positive value would suggest that a person is receiving much more heat than they are giving off, and they would feel too hot. A large negative
value would have the opposite effect. The major energy streams are convective heat loss (C), evaporative heat loss (E), conductive heat loss (K), radiative exchange (R), and metabolic heat production (M) (Kenny et al, 2009). The estimated physiological thermal stress, also called energy budget value, can be measured as watt per square meter of a person’s surface area (W/m2), a unit of energy density. The measured microclimate and the athlete’s surveyed exertion level were the main inputs to the COMFA model estimation. The metabolic rate of a running person ranged between 300 – 650 W/m2 depending on exertion level, and the summer uniform was selected to determine the clothing insulation level.
Results Microclimate condition
Surface temperature showed a significant difference between NT and AT. The differences in microclimate between the two field types are summarized in Table 2. Regarding the overall pattern, all the measurement values of AT’s microclimate (e.g., air temperature, solar radiation, relative humidity, and wind speed) were slightly higher than NT. However, except for surface temperature, the degree of their difference is not significant considering their error ranges of measurement. In contrast, the surface temperature presented a large deviation between AT and NT, whose average difference was over 70.0 degrees F (21.11 C).
Table 2) AT – NT difference in microclimate conditions
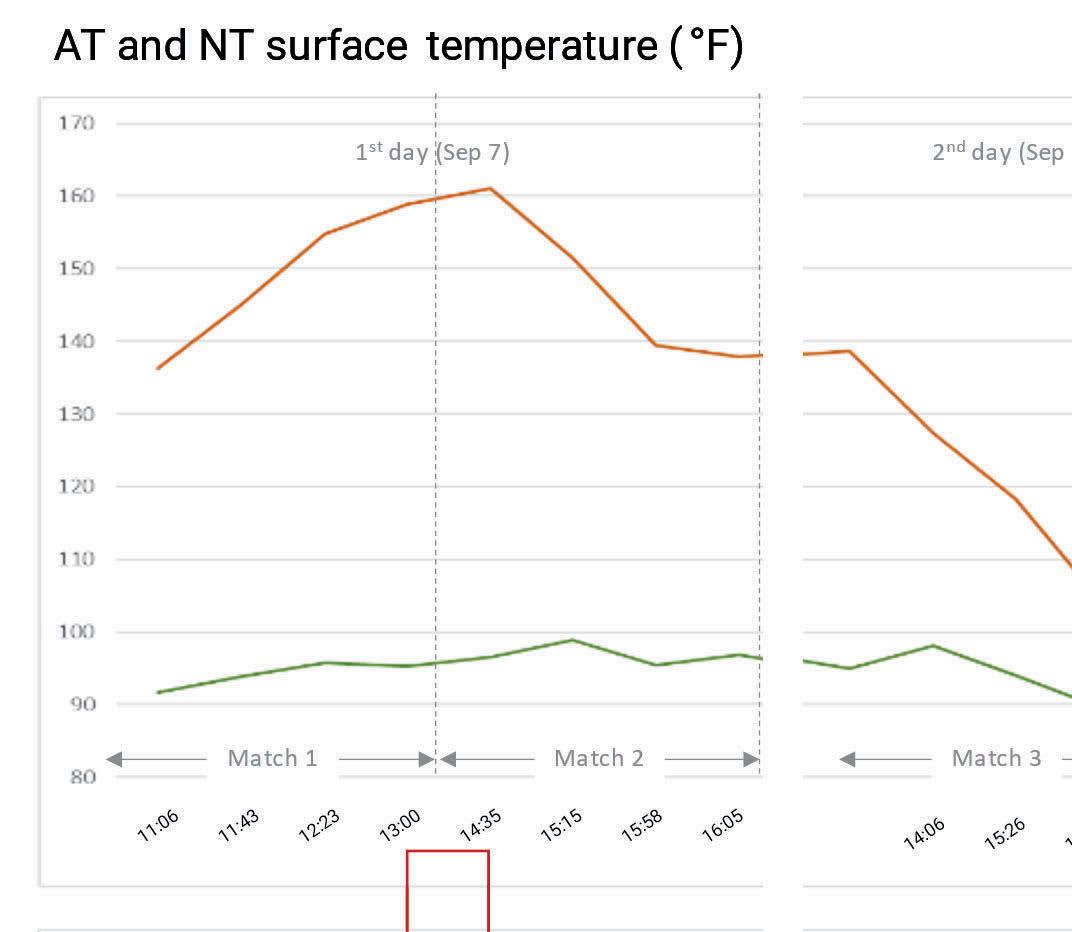
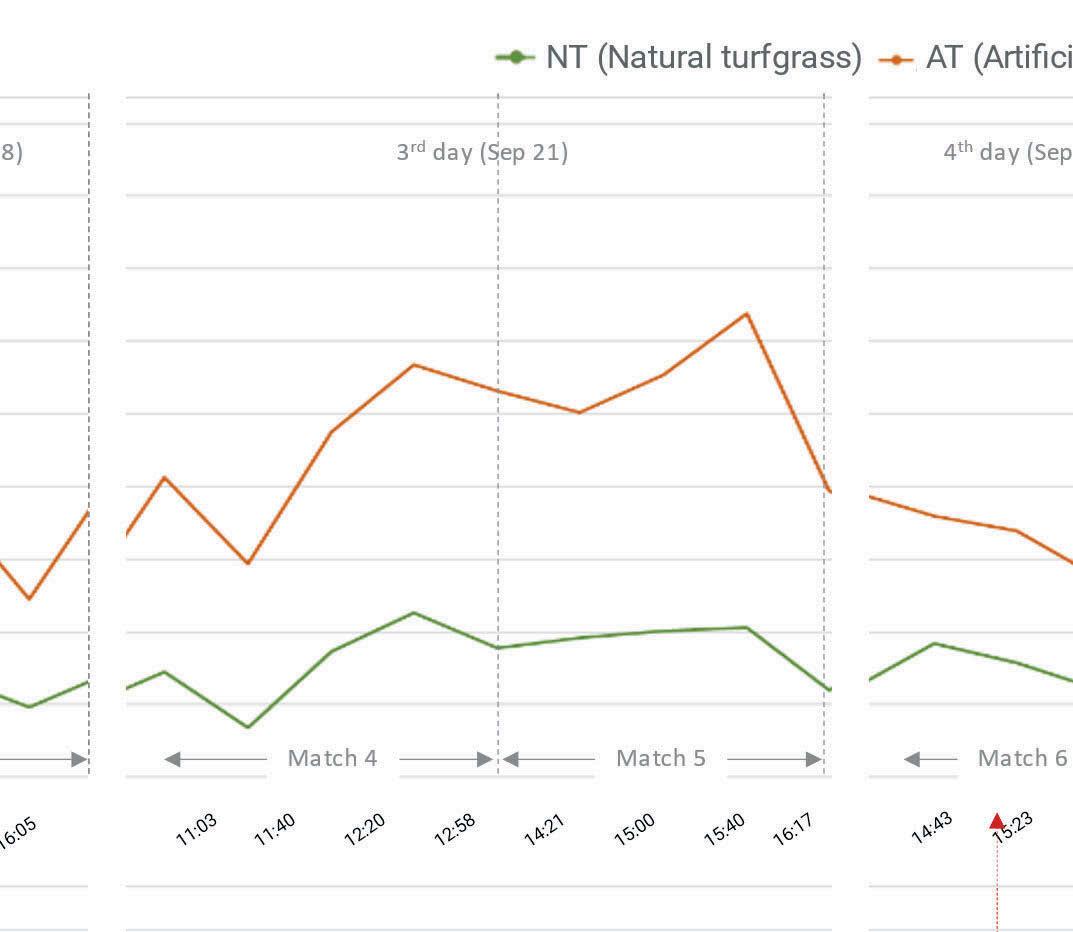
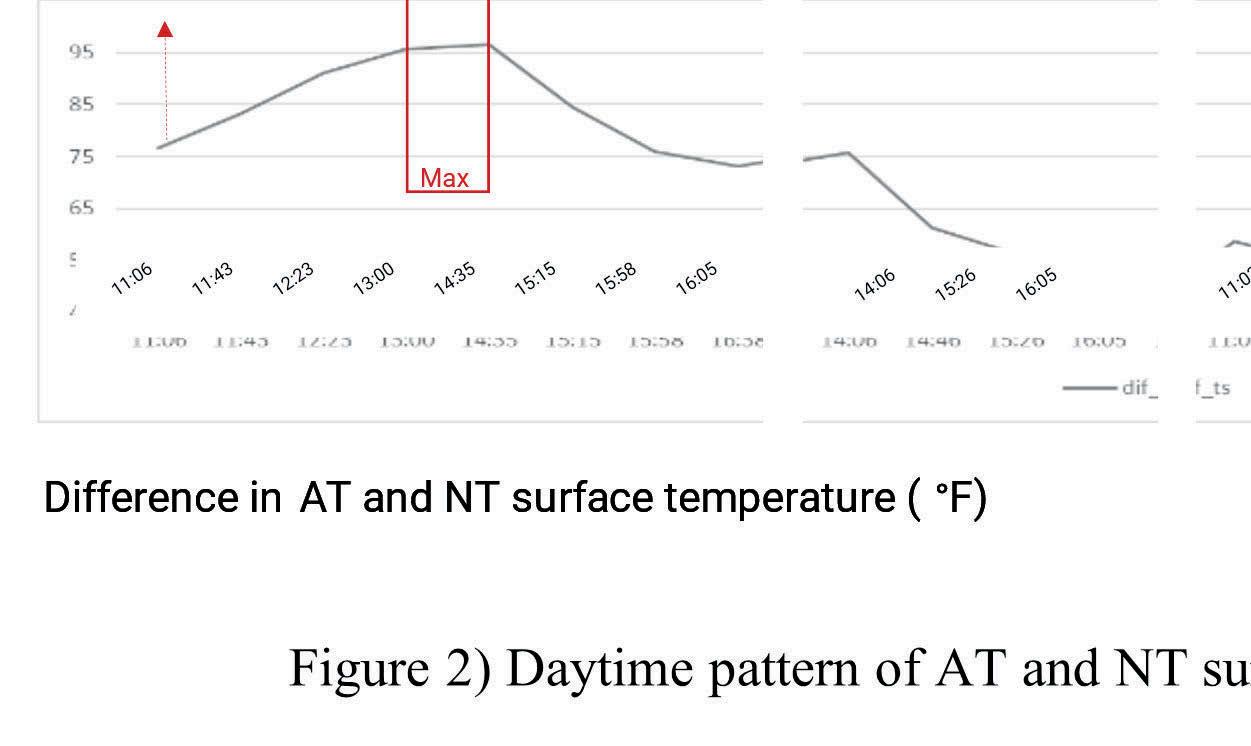
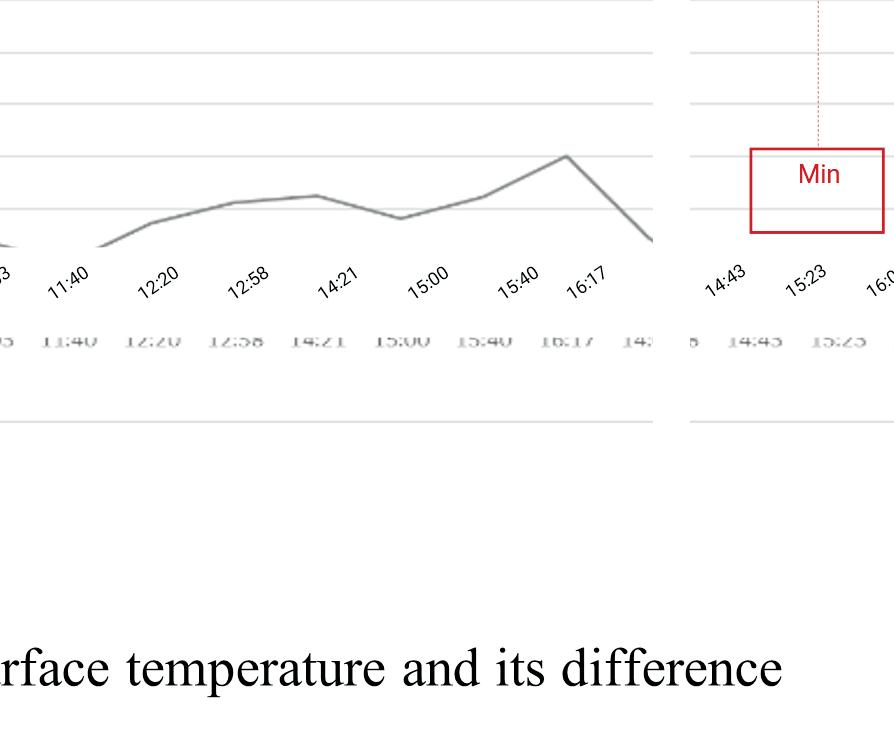
*Standard deviation (Sd) *Difference (Diff.) The daytime pattern of AT and NT surface temperature was further explored to identify the difference in variation over the day (Figure 2). AT’s surface temperature showed considerable fluctuation over time compared to NT’s. Over the four-days of measurements, the surface temperature ranged between 104.6 degrees F (40.33 degrees C) and 161.6 degrees F (72 degrees C) for AT and between 86.8 degrees F (30.44 degrees C) and 102.6 degrees F (39.22 degrees C) for NT. It seems that their daytime mean surface temperature was primarily affected by cloud cover. Overall, the surface temperatures peaked on September 7 when the cloud cover was at the lowest at 10 percent. Meanwhile, surface temperatures were lowest on September 22 when the cloud cover was relatively higher at 40 percent, with a somewhat cooler ambient temperature. The AT – NT difference in surface temperature showed similar daytime patterns with the mean surface temperature. Their difference reached a peak of 96.5 degrees F (35.83 degrees C) at 2:30 PM CST, September 7, and lowest at 46.8 degrees F (8.22 degrees C) on 3:30 PM CST, September 22. The degree of temperature gap was likely due to increase from morning to high solar noontime at around 1:00 PM CST and after then declining toward evening time at 4:00 PM CST. As surface temperature was the microclimate component primarily determined by field characteristics, we expected it to be a crucial driver causing differences in players’ thermal stress.
Variable Mean Sd Min Max
Diff. in Air temperature (°F) 33.12 0.38 32.57 33.90
Diff. in Solar radiation (W/ m2)
Diff. in Relative humidity (%)
16.58 35.76 -29.54 74.76
2.97 0.95 1.33 4.38
Diff. in Wind speed (mph) 1.67 1.40 -1.57 4.56
Diff. in Surface temperature (°F) 70.15 14.39 46.88 96.50
Perceived thermal stress (Survey Response)
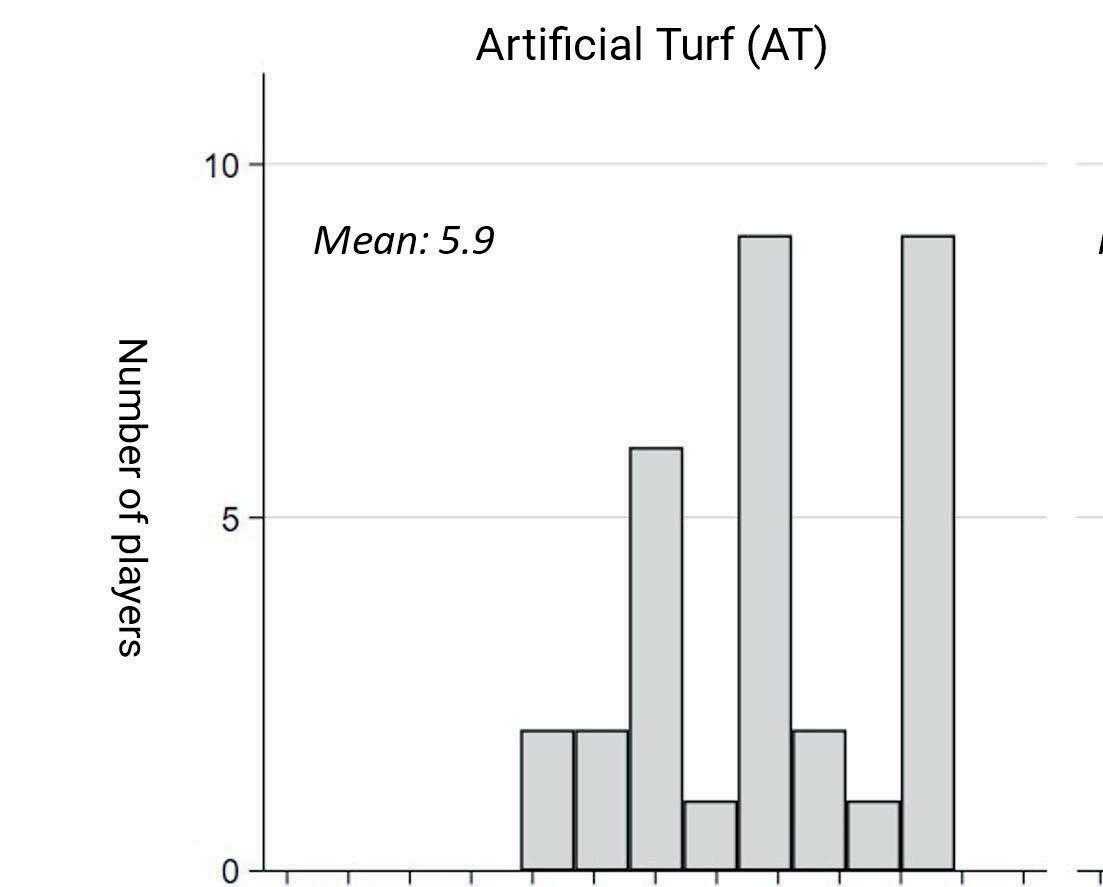
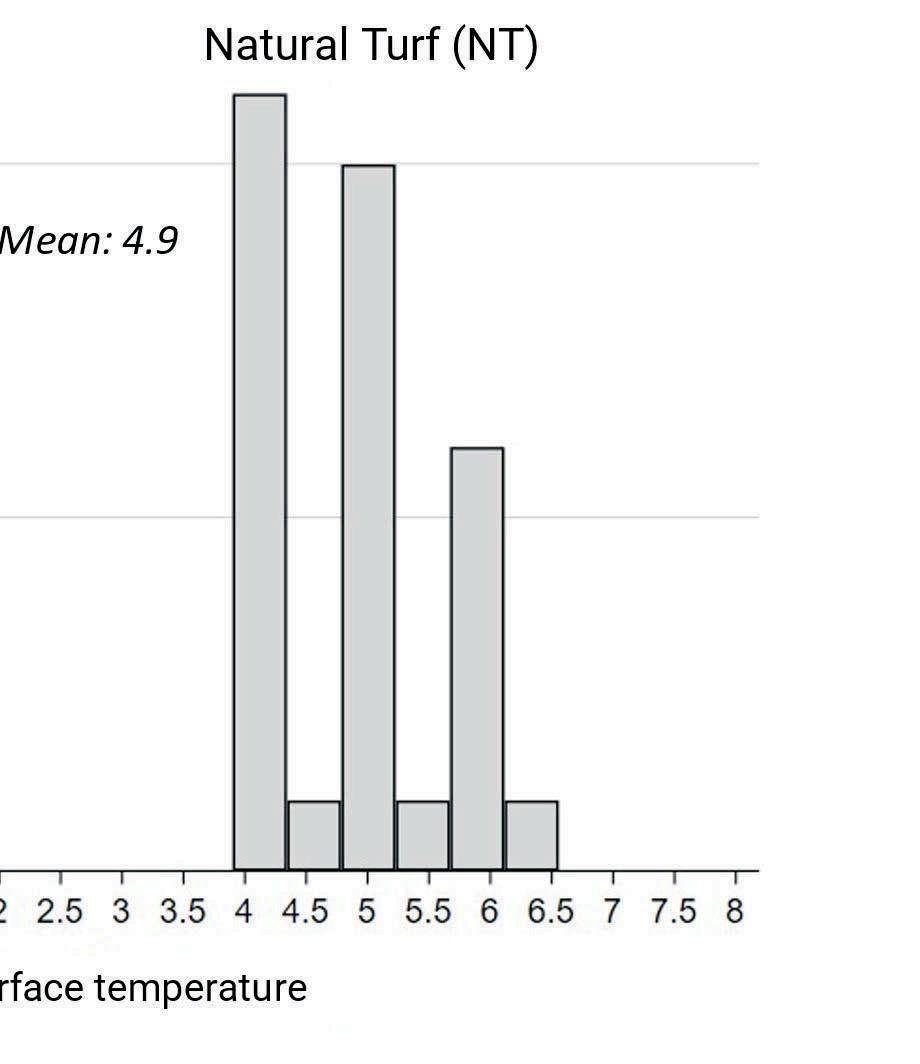
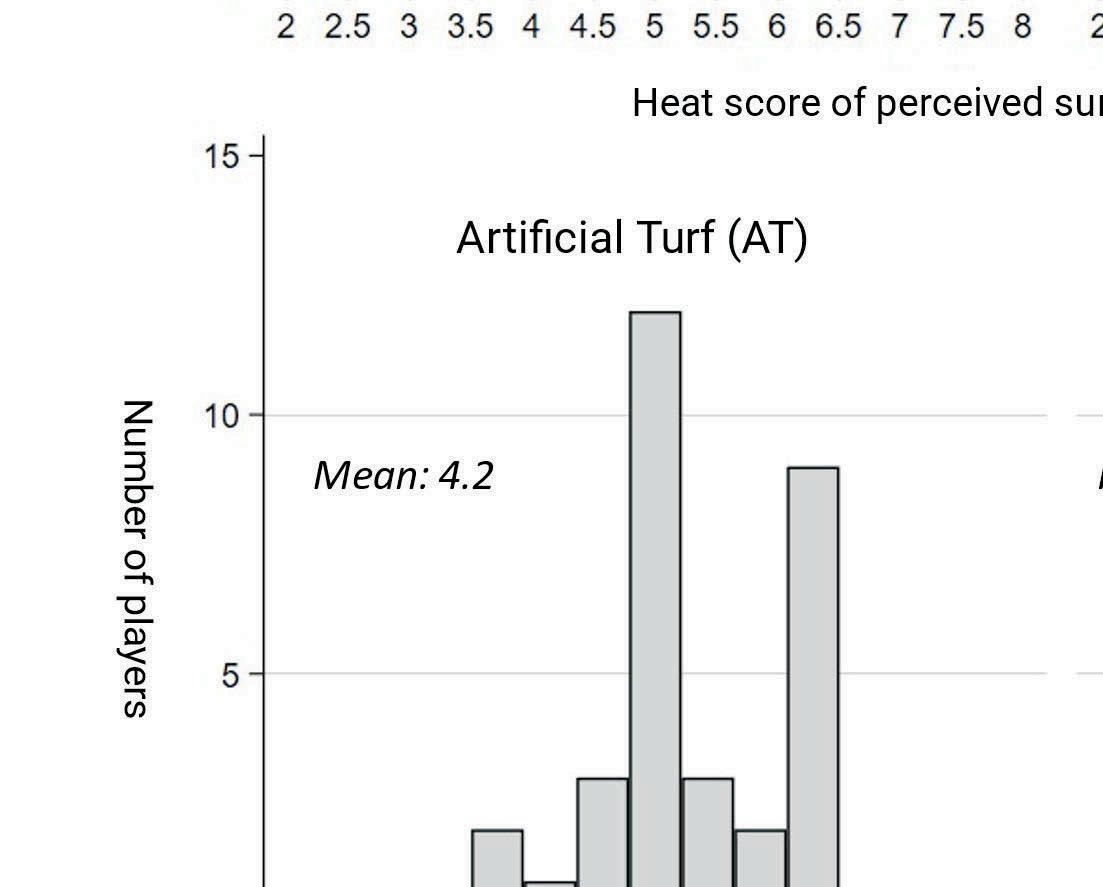
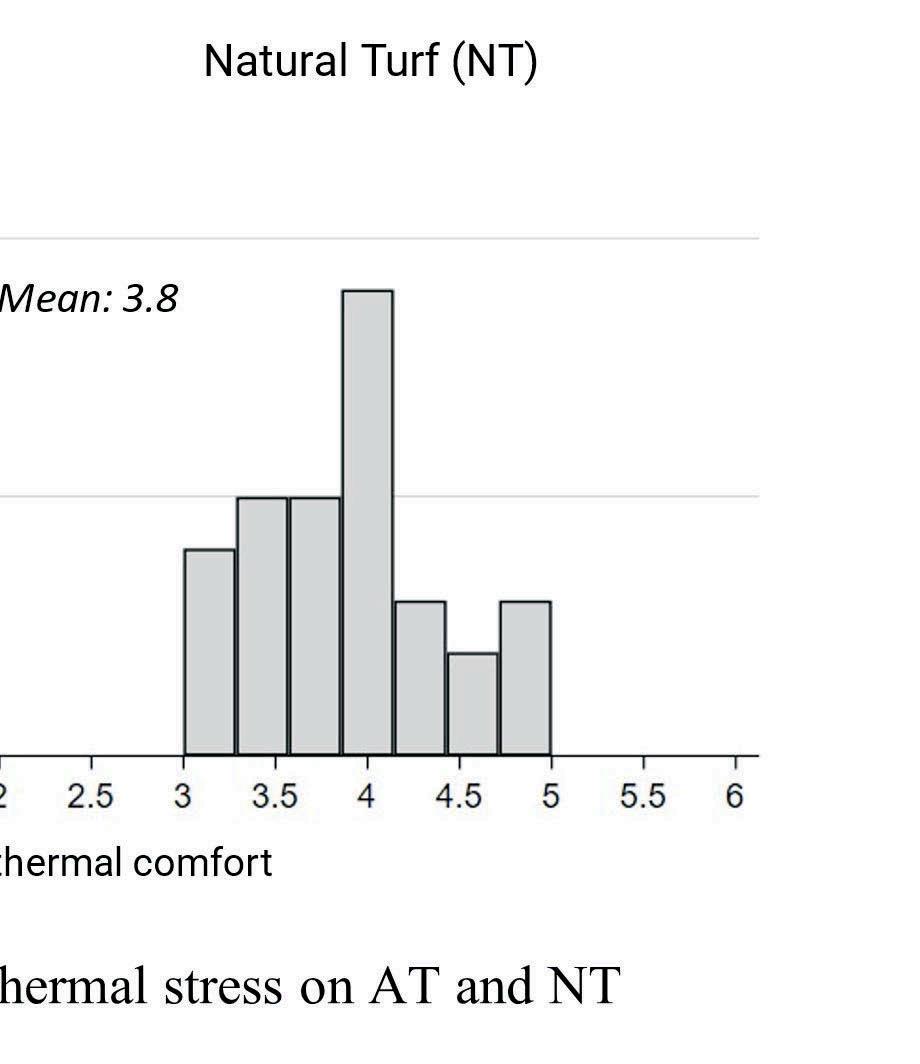
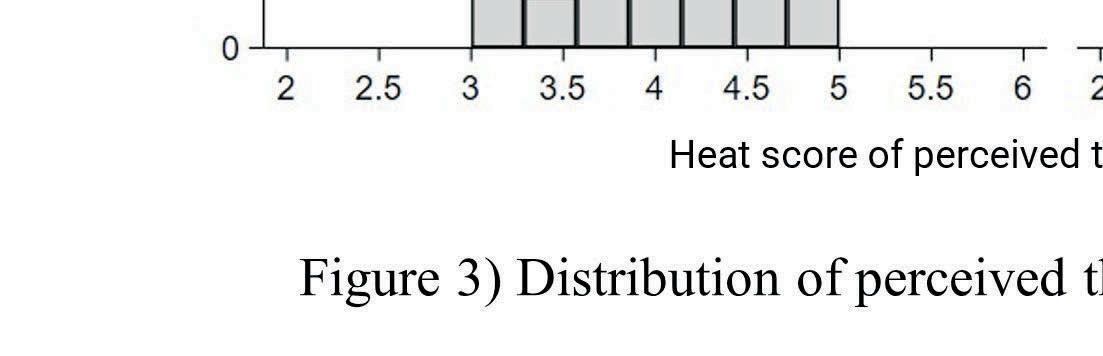
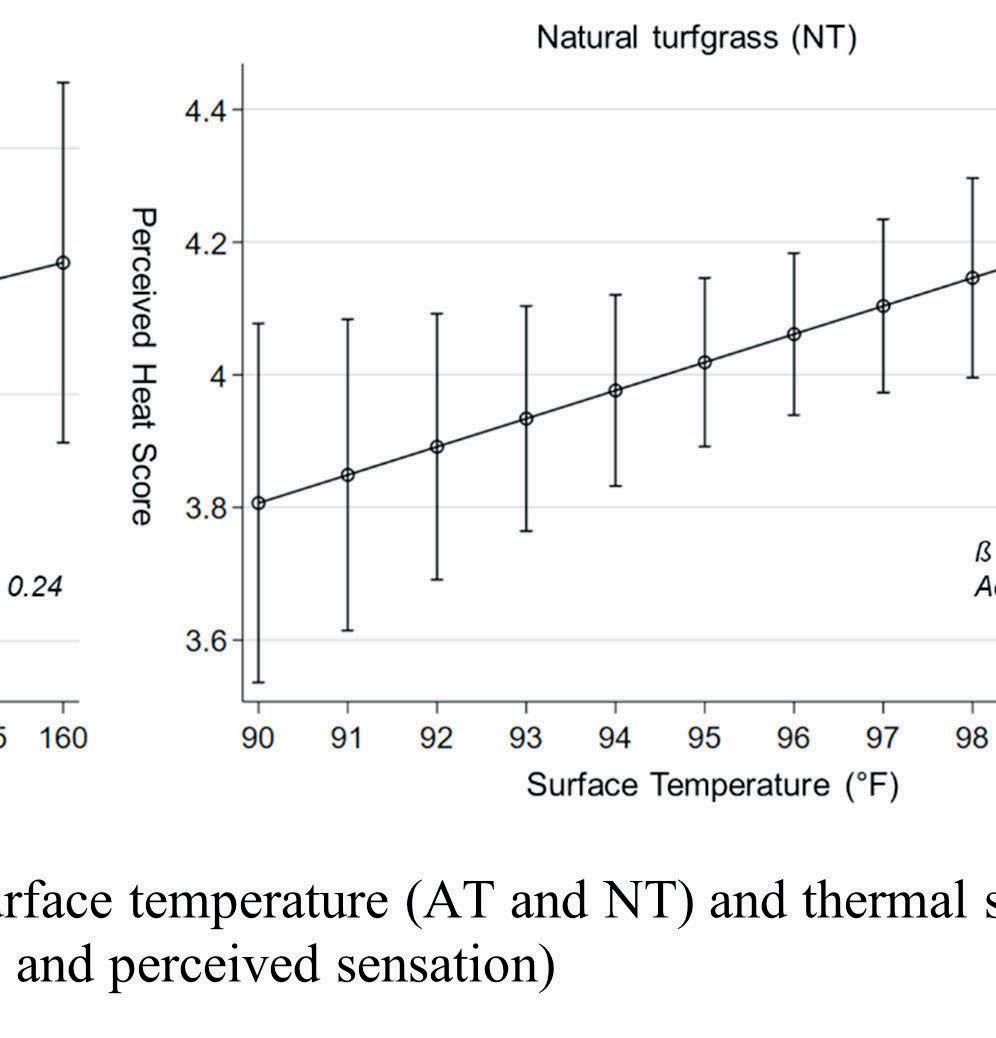
Soccer players felt higher thermal stress when playing on artificial turf (AT) than natural turf (NT). Figure 3 (shown on the previous page) presents the frequency distributions of players' perceived level of surface temperature and thermal stress for AT and NT. The X axis is the heat scores of perceived surface temperature (upper figure) and perceived thermal comfort (bottom figure), respectively. These values reflect how thermally comfortable they were on each field type during match. And the Y axis is the number of players choosing each score. The upper histogram shows that AT has a relatively higher perceived surface temperature score with a broader range than NT. The frequency distribution curve also indicates that the mean AT's heat score is 6 points which is one point higher than the mean NT's. Moreover, the heat score of the AT ranges between 4 to 7.5, which is slightly broader than that of the NT. Regarding the perceived thermal comfort, although the range of heat score range is identical as it ranges between 3 to 5, the mean AT score is at 4.3 points, which is higher than the mean NT score of 3.8.
Objective thermal stress (Energy budget model) Evaluation of thermal stress on natural and artificial turf
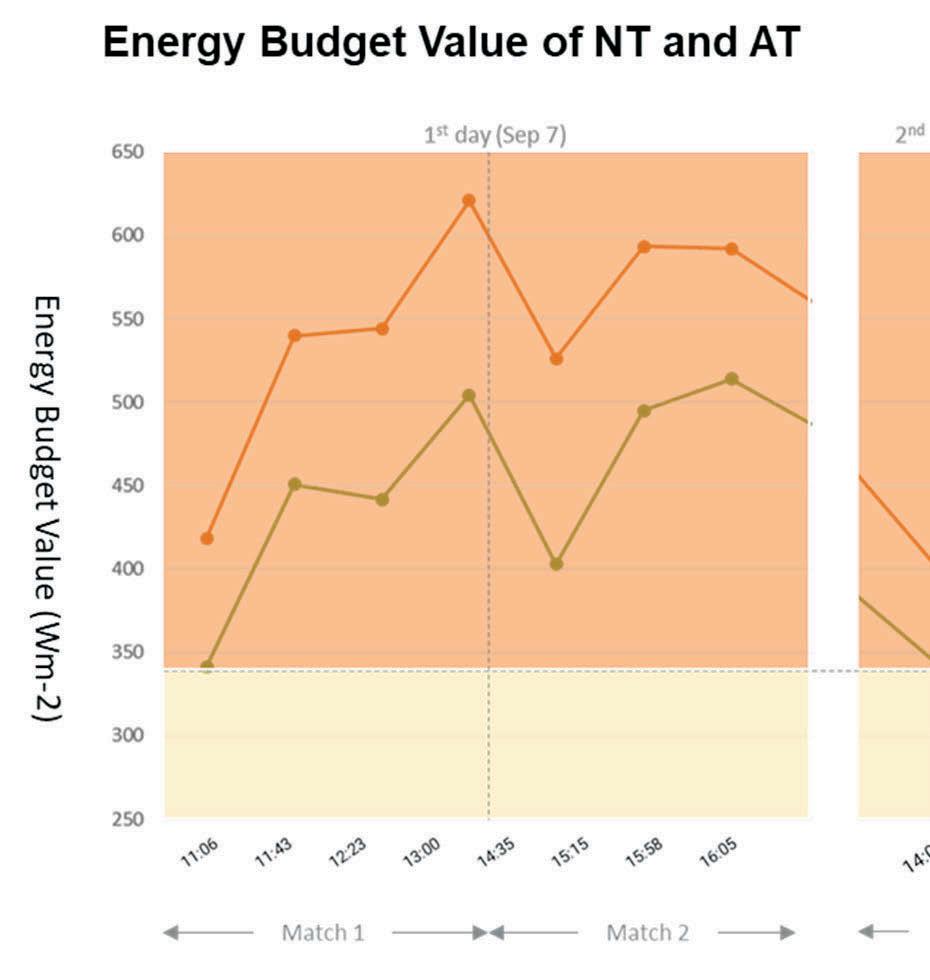
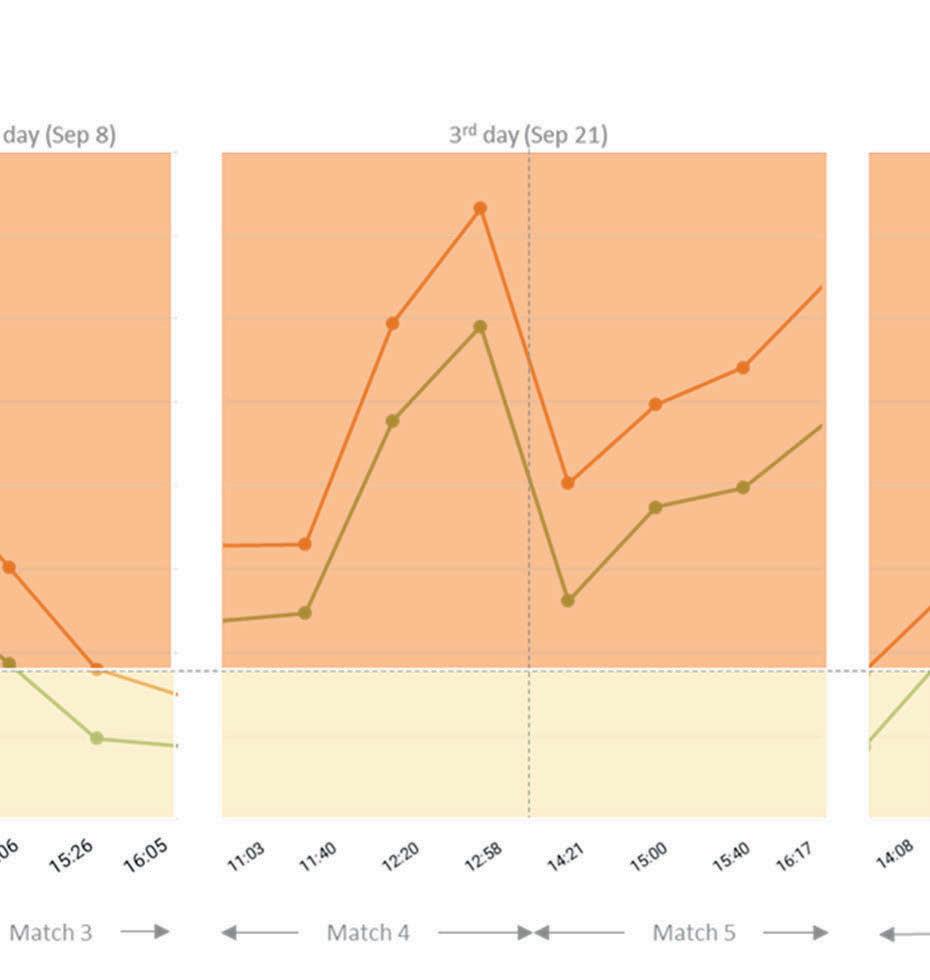

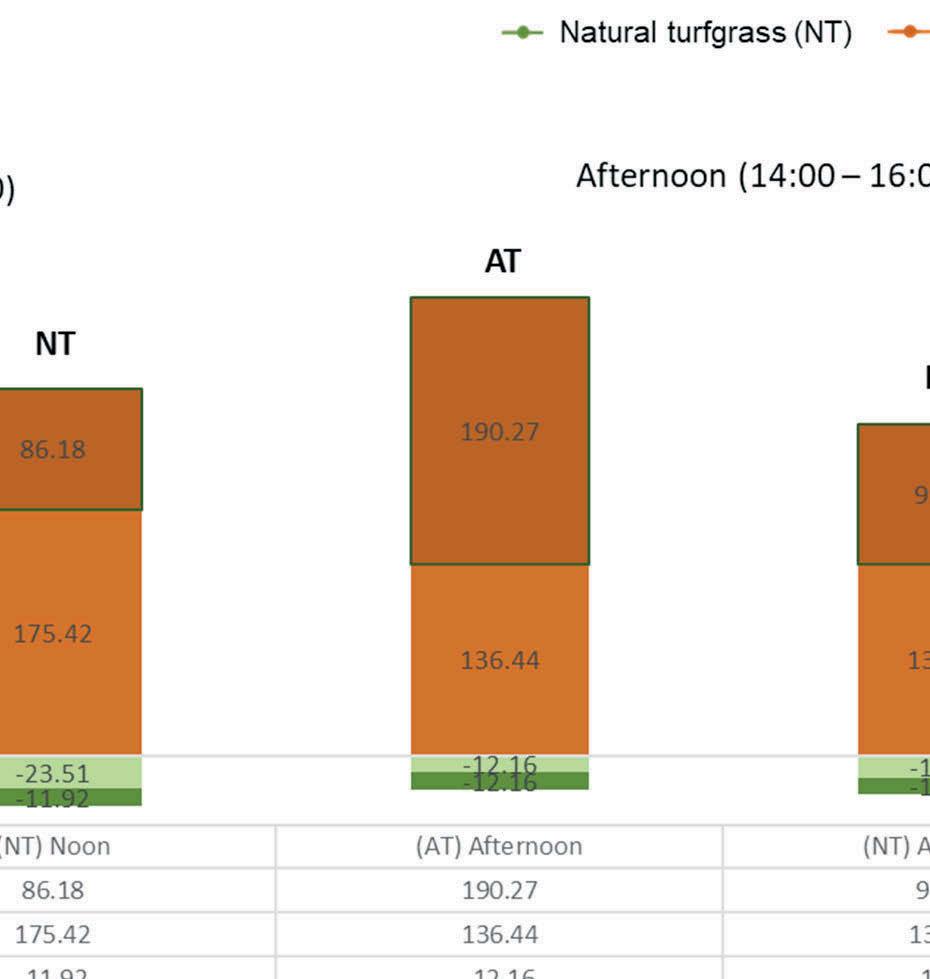
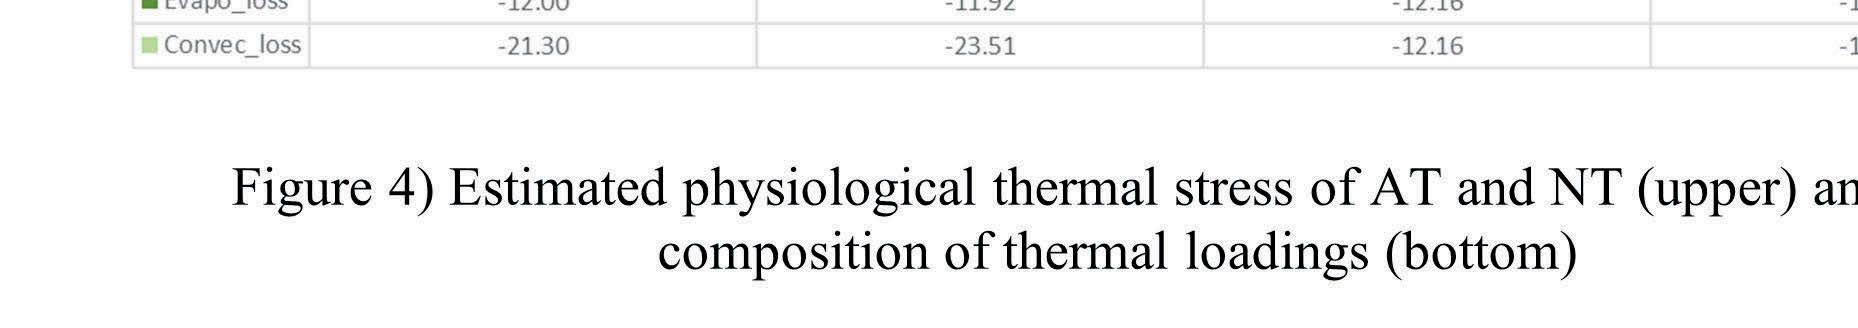
Physiological thermal stress of soccer players on the two field types were evaluated using the COMFA model. The estimated COMFA output was described as energy budget values that can be categorized into four classified thresholds of heat stress values (Harlan et al., 2006): Caution (65–120 W/m2), Extreme caution (121–200 W/m2), Danger (201–339 W/m2), and Extreme Danger (340 or higher W/m2). According to the classification, Figure 4 showed that, for the majority of the match, the players felt very hot and had Extreme Danger levels of thermal stress. Energy budget values reached the peak of 620 W/m2 at 2:00 PM CST, September 7 and arrived at the low of 300 W/m2 at 4:00 PM CST, September 8, and 2:00 PM CST, September 22. Only limited periods, from 2:00 to 4:00 PM CST on September 8 and from 2:00 to 2:30 PM CST on September 22, fell into Danger level of thermal. Their daytime patterns with peak and bottom hours were highly coupled with surface temperature. When it comes to the AT-NT difference in physiological thermal stress, it was found that NT can reduce the thermal stress of soccer players by up to 20 percent compared to AT. Overall daytime patterns of thermal stress demonstrated that the difference in energy budget values between AT and NT was 10.6 percent higher in the afternoon than the noon during clear sunny days. Their highest difference was on September 7 around 3:00 PM CST at 124 W/m2, while their lowest difference was on September 22 around 4:00 PM CST at 25 W/m2. It seemed that the magnitude of disparities in thermal stress was likely to increase when the shortwave solar radiation (or direct solar beam) coming from the sky was strong. Meanwhile, their disparities tended to decline when the cloud cover was relatively larger with high wind speed. The most significant components of thermal loading to which players are exposed are Kabs for NT and Labs for AT. Figure 4 indicates individual contribution of four energy components [absorbed solar radiation (Kabs), absorbed terrestrial radiation (Labs), convective heat loss (C), and evaporative heat loss (E)] to thermal loadings that athletes received during daytime hours. The Kabs are the amount of incoming shortwave solar radiation that a player absorbs, and the Labs are the amount of absorbed longwave ground radiation emitted from the field. Evaporative heat loss is the loss of body heat that occurs through respiration and perspiration, whereas convective heat loss is the transfer of heat from the body due to the wind. Kabs and Labs comprise the largest proportion of the net energy budget, leading to the overall increase in thermal stress of players. As the Kabs was determined by exposure level to direct solar radiation, no difference was observed between the field types. Meanwhile, the LABS of AT was 97.7 percent and 91.5 percent higher at the noon and the afternoon, respectively, compared to NT.
Effects of AT and NT surface temperate on player’s thermal stress
Effects of AT and NT surface temperate on player’s thermal stress (continued from page 19)
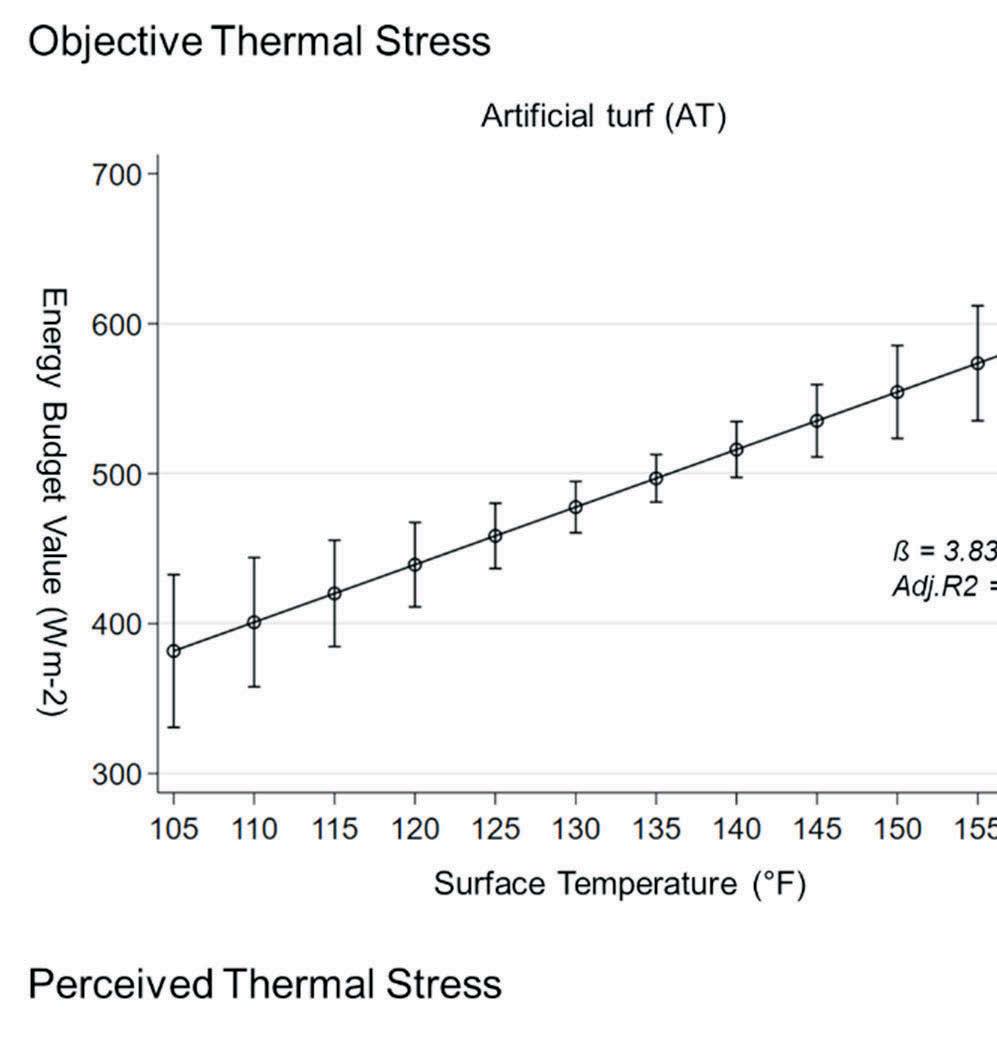
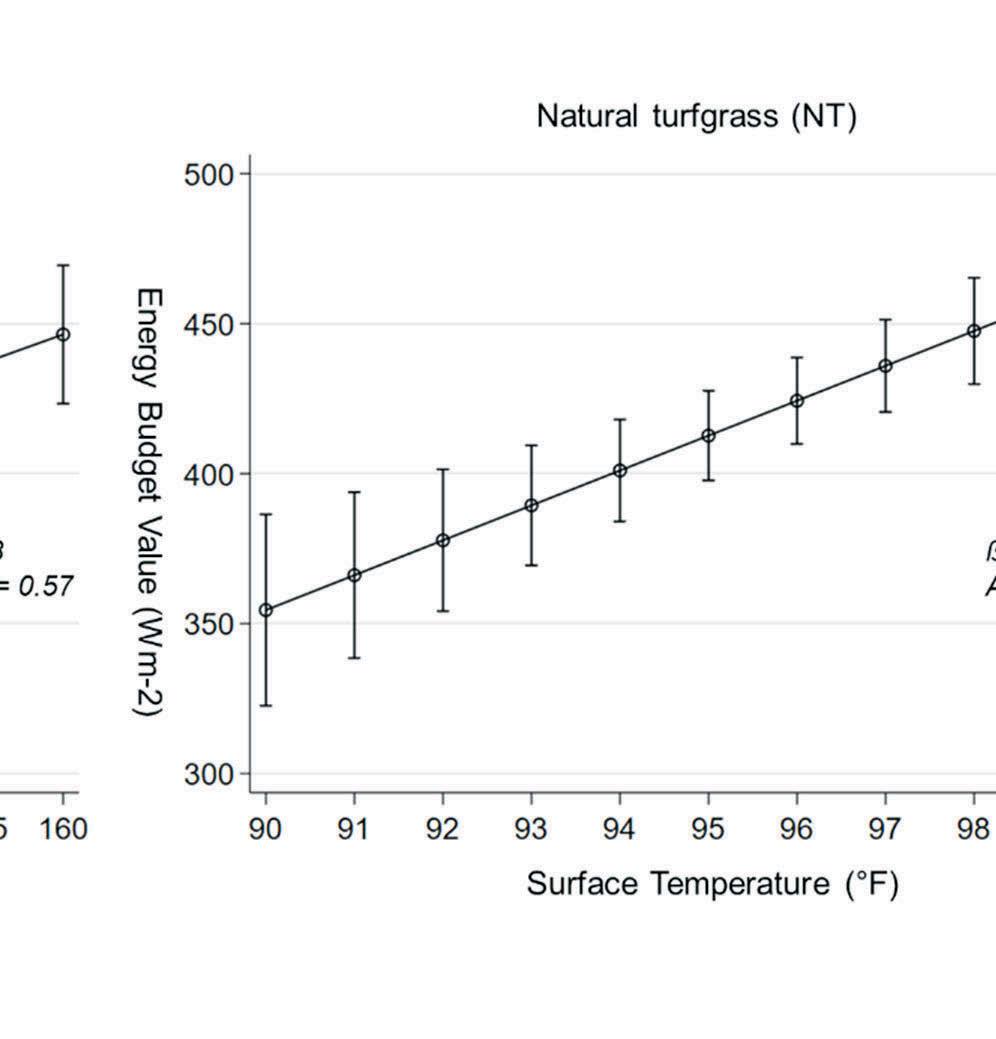
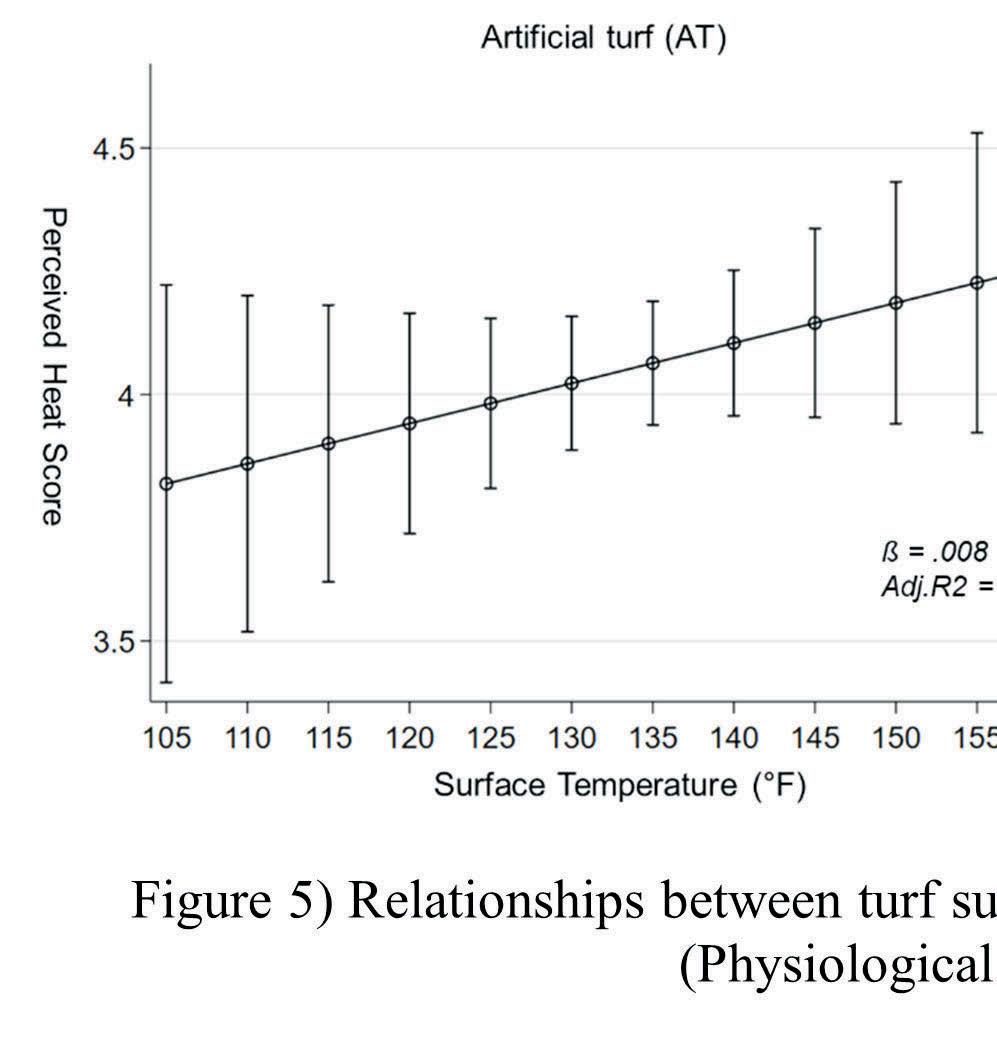
The impact of AT and NT surface temperature on players' thermal stress was estimated using a statistical modeling procedure called multiple linear regression, where time of day and day of week were considered. Two sets of models were developed for players on each field type—physiological thermal stress and perceived thermal stress. The Figure 5 graphic showing this data in on the previous page. Particular attention was given to (1) the comparison of the impact of turf surface temperature on different types of thermal stress, as well as to (2) investigate the explanatory capacity of turf surface temperature as a proxy of thermal stress. Upper plots showed the predicted changes in physiological thermal stress (W/m2) by an increase in one Fahrenheit degree of AT and NT surface temperature, whereas the bottom plot indicated the predicted shifts in perceived thermal stress. All models were statistically significant, indicating that both field types affect physiological and perceived thermal stress significantly. The impact of surface temperature on athletes' thermal stress is higher on NT than AT. The coefficient slope of NT is 11.6 for physiological thermal stress, meaning that the one-degree F increase in surface temperature led to 11.6 growth in energy budget values (W/m2). The coefficient slope of AT was 6.9 which was three times less than NT. Interestingly, a similar outcome was found in perceived thermal stress, where NT's coefficient slope (0.014) was higher than AT’s (0.008). These findings indicate that both the perceived and physiological thermal stress of the players are more sensitive when they are performing on NT. We assume that this is mainly due to the higher thermal stress level on AT that may result in the reduced performance (or amount of activity) and lower metabolic rates leading to decreases in thermal stress of players compared to NT. Explanatory power of surface temperature for thermal stress varies on the types of thermal stress. In this study, explanatory power indicates the ability on how much variations in players' thermal stress can be explained by the surface temperature. Overall, the surface temperatures showed better performance in explaining athletes’ physiological thermal stress than the perceived thermal stress model. In the physiological thermal stress model, the explanatory power (or adjusted r-squared) values are 57 percent and 49 percent for AT and NT respectively, which are around 30 percent higher than the perceived thermal stress model. This implies that, considering their high explanatory power of around 50 percent, surface temperature can be considered a superior proxy when it is used for measuring the physiological thermal stress of soccer players.
Conclusion
This study compared the perceived and physiological thermal stress of soccer players performing on AT and NT. Microclimate was measured on each field type during four hot, sunny, summer days in 2021. Questionnaire surveys and the COMFA model were adopted to measure perceived and physiological thermal stress, respectively. Our findings confirmed that surface temperature is the main driving factor that leads to an increase in both perceived and physiological thermal stress of the soccer players in summer daytime. The highlights of the key findings are as follows: • Mean AT-NT difference in surface temperature was over 68.0 degrees F (20 degrees C), which tends to be more pronounced when the direct solar beam is stronger, and the time reaches solar noon at around 1:00 PM CST
• Athletes performing on AT had higher perceived and physiological thermal stress than those on NT.
Compared to AT, NT can reduce the physiological thermal stress by up to 20 percent in a setting of a clear, hot, and sunny day. The findings of this study are useful for biometeorology and sports field management to enhance the athletes’ safety from heat stress and increase their match performance. Future studies need to address how the difference in thermal stress induced by AT and NT affects the athlete’s physical performance and physiological body changes, such as hydration.
REFERENCES
Francis, R. A. (2018). Artificial lawns: Environmental and societal considerations of an ecological simulacrum. Urban
Forestry & Urban Greening, 30, 152-156.
Guyer, H. (2020). Athletic Surfaces’ Influence on the Thermal
Environment: An Evaluation of Wet Bulb Globe Temperature in the Phoenix Metropolitan Area. Arizona State University,
Temple, AZ
Harlan, S. L., Brazel, A. J., Prashad, L., Stefanov, W. L., & Larsen, L. (2006). Neighborhood microclimates and vulnerability to heat stress. Social science & medicine, 63(11), 2847-2863.
Jim, C. Y. (2017). Intense summer heat fluxes in artificial turf harm people and environment. Landscape and Urban Planning, 157, 561-576.
Kenny, N. A., Warland, J. S., Brown, R. D., & Gillespie, T. G. (2009).
Part A: Assessing the performance of the COMFA outdoor thermal comfort model on subjects performing physical activity.
International Journal of Biometeorology, 53(5), 415-428.
Long-term Environmental Impacts and Energy Balance of Lawn Removal and Conversion to Alternative Landscapes
(2021-23, $30,000)
As population growth in urban areas continues to rise, water conservation is becoming a key priority for many municipalities. In recent years many municipalities have begun to offer rebate programs which incentivize removal of natural turfgrass areas and conversion to alternative ‘waterefficient’ landscapes, with the goal of reducing outdoor water use. In fact, the environmental impacts and changes to ecosystem services associated with such landscape alterations are still not well understood. As a result, ‘Ecosystem Services and Impacts’ of lawns was recently identified as one of the top research priority areas through the NTF/FFAR National Turfgrass Stakeholder Summit. A two-year The Lawn Institute/Scotts Miracle-Gro funded research project was conducted at the Urban Landscape Runoff Research Facility at Texas A&M during 2018 and 2019. The results of the initial two-year study highlighted many differences in rainfall capture and runoff dynamics, surface temperatures, and management requirements between natural turfgrass lawns, xeriscapes, mulched, and artificial turf landscapes. However, as these landscape treatments continue to mature, there is a need to evaluate longer-term environmental impacts/runoff dynamics, and to characterize energy balance, greenhouse gas emissions, and soil nutrient pools. This progress report provides a summary of results of the first year of the currently funded project. This two-year study is being conducted at the Urban Landscape Runoff Facility located at the Texas A&M University Soil and Crop Sciences Field Research Laboratory, College Station, TX. The facility consists of 24 individually irrigated 13-foot by 27-foot (3.962-m by 8.229-m) plots originally established in 2012 with ‘Raleigh’ St. Augustinegrass. Each plot has its own runoff collection system composed of an ISCO flow meter and sampler, which provides full documentation of the amount of water lost to runoff as well as collection of water samples for subsequent measurement of the chemical content of the runoff. In August 2018, 16 of the formerly natural grass plots were converted to the following alternative waterefficient landscapes. The treatments were then:
1. St. Augustinegrass Lawn: Original ‘Raleigh’ St. Augustinegrass (non-converted) 2. Water Efficient Landscape: Xeriscape: Native plants (covers 50 percent of the entire plots) planted on 3 inches (7.62 cm) of compacted decomposed granite following sod removal. 3. Water Efficient Landscape: Mulch: Native plants (covers 50 percent of the entire plots) planted on 2 inches (5.08 cm) of dark shredded wood mulch following sod removal. 4. Artificial Turf: Synthetic turf installed atop of compacted decomposed granite base, with grit silica sand infill following sod removal. 5. Sand-Capped Lawn: Washed Raleigh St. Augustinegrass sod laid atop of a 4-inch (10.16-m) sandcap layer following sod removal.
Data collection for this project was initiated in April 2021 and will continue until June 2023. Parameters of interest in this study include: Runoff and Rainfall Capture Dynamics - (pH, electrical conductivity (EC), Nitrogen (Total N, NO3-N, NH4-N, organic N) and orthophosphate-P concentrations),
Nutrient losses through denitrification and volatilization
Energy Balance – Net radiation, albedo, spectral irradiance (400 to 1100 nm), spectral reflectance, surface temperature, soil heat flux density, atmospheric humidity, and wind speed).
Sensible heat flux density (rate of heating or cooling of air) and latent heat flux density (rate of evapotranspiration) will be estimated by energy balance theory.
Soil nutrient dynamics - Soil nitrate-N, ammonium-N and total Carbon will be analyzed on the soil cores to understand the long-term implications on soil nutrient pools.
Runoff dynamics have been continually monitored since the start of the study. To date, 10 runoff events have been measured in the study. Total and cumulative runoff volumes for each date and landscape type are shown in Figure 1. Not surprisingly, runoff volumes have been highly correlated to rainfall depth, and a minimum of 20 mm (.787 in.) of rainfall has been required to generate noticeable runoff from most of the landscapes. The effect of landscape type on total runoff volumes from treatments appears to be consistent with the prior two-year study with Artificial turf (AT) and Xeriscaping (XE) consistently generating the most runoff among all landscapes (Figure 1). St. Augustinegrass lawn plots occasionally show similar volumes of runoff as AT and XE, but usually only when rainfall occurs within 24 hours of irrigation. However, when rainfall amounts are greater than 60 mm (2.362 in.), differences in runoff volumes between St. Augustinegrass lawn and AT and XE become more apparent. Also
consistent with the previous project, the Sand-Capped lawn plots continue to provide excellent rainfall retention (i.e., runoff mitigation), during the majority of rainfall events. In terms of runoff quality analysis, samples for each runoff event have been collected, filtered, and frozen for future testing at the end of the project. Analysis of these samples was delayed slightly due to the retirement of our former water quality specialist, Dr. Aitkenhead-Peterson. Following this season, samples will be analyzed and provided in next year’s final report.
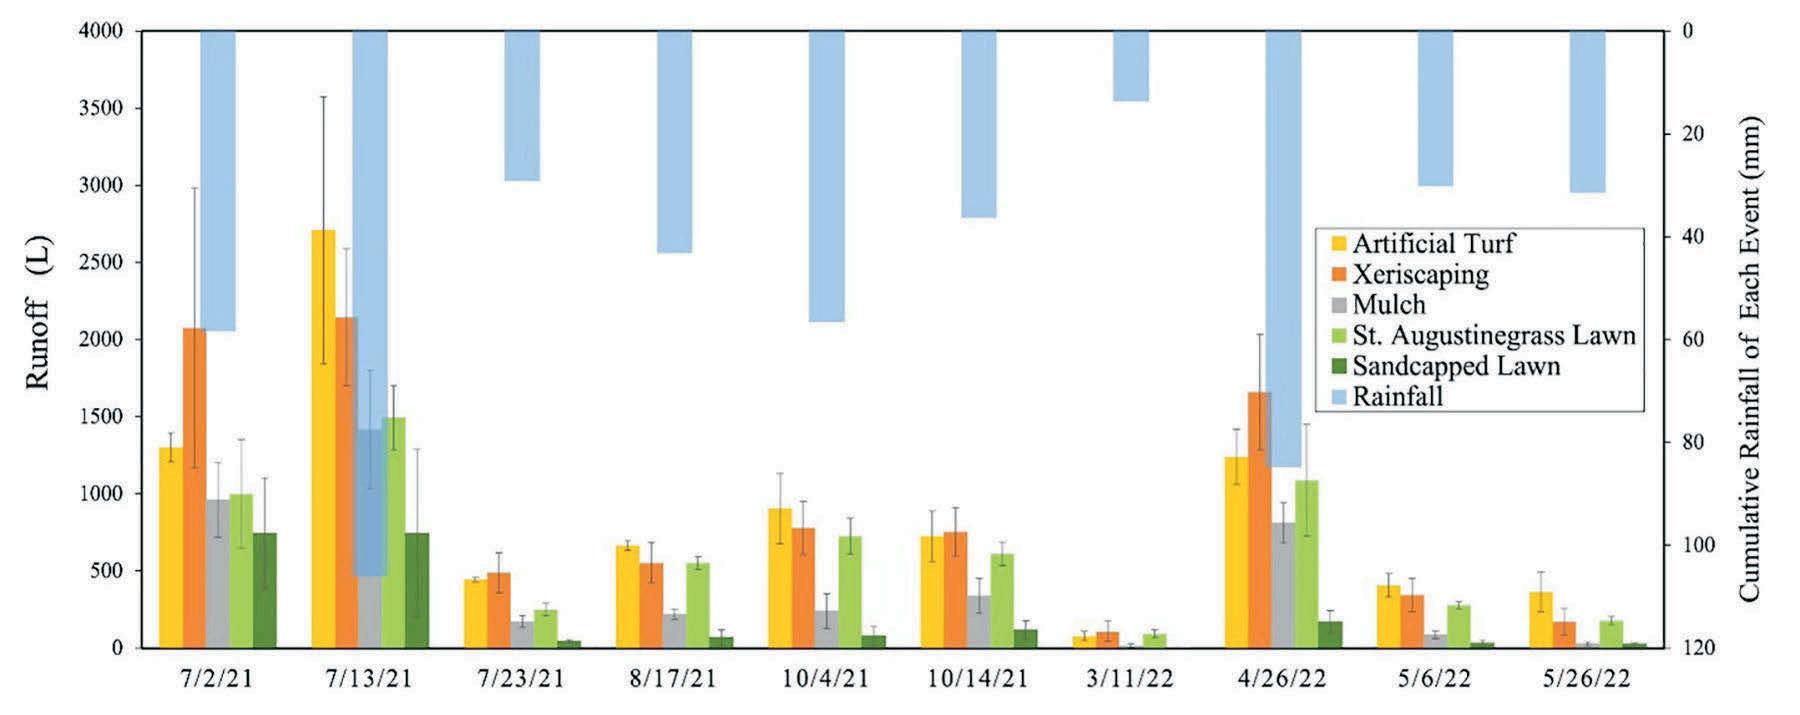
Figure 1. Total Runoff (L) and Cumulative Rainfall (mm) for each runoff event and total runoff (L) of all landscapes for each runoff event during the study period. Error bars represents standard error.
Greenhouse gas emissions including CO2, N2O, CH4, and NH3 were monitored several times during 2021 using a portable gas analyzer (Figure 2). The first measurements were conducted on 7/28/21, which showed the background level of gaseous emissions prior to fertilization (of St. Augustinegrass lawn and Sand-Capped plots) and irrigation (of all plots). On 8/2/21, all turf plots were then fertilized at a rate of 1 lb. N per 1000 sq ft. [.454 kg. per 92.903 sq. m.]) using Scotts Turf Builder (32-0-10), plots were irrigated that evening (.5 inch [1.27 cm.] of water). Subsequent gas measurements were collected at one day (8/3/21), seven days (8/10/21), and 14 days (8/17/21) afterwards.
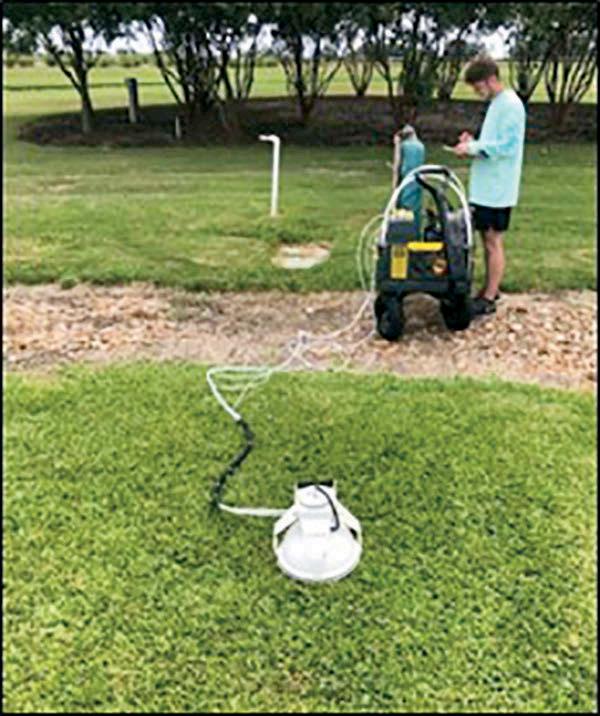
Figure 2. Measurement of gaseous emissions being taken for St. Augustinegrass Lawn plots during the Texas A&M landscape study.
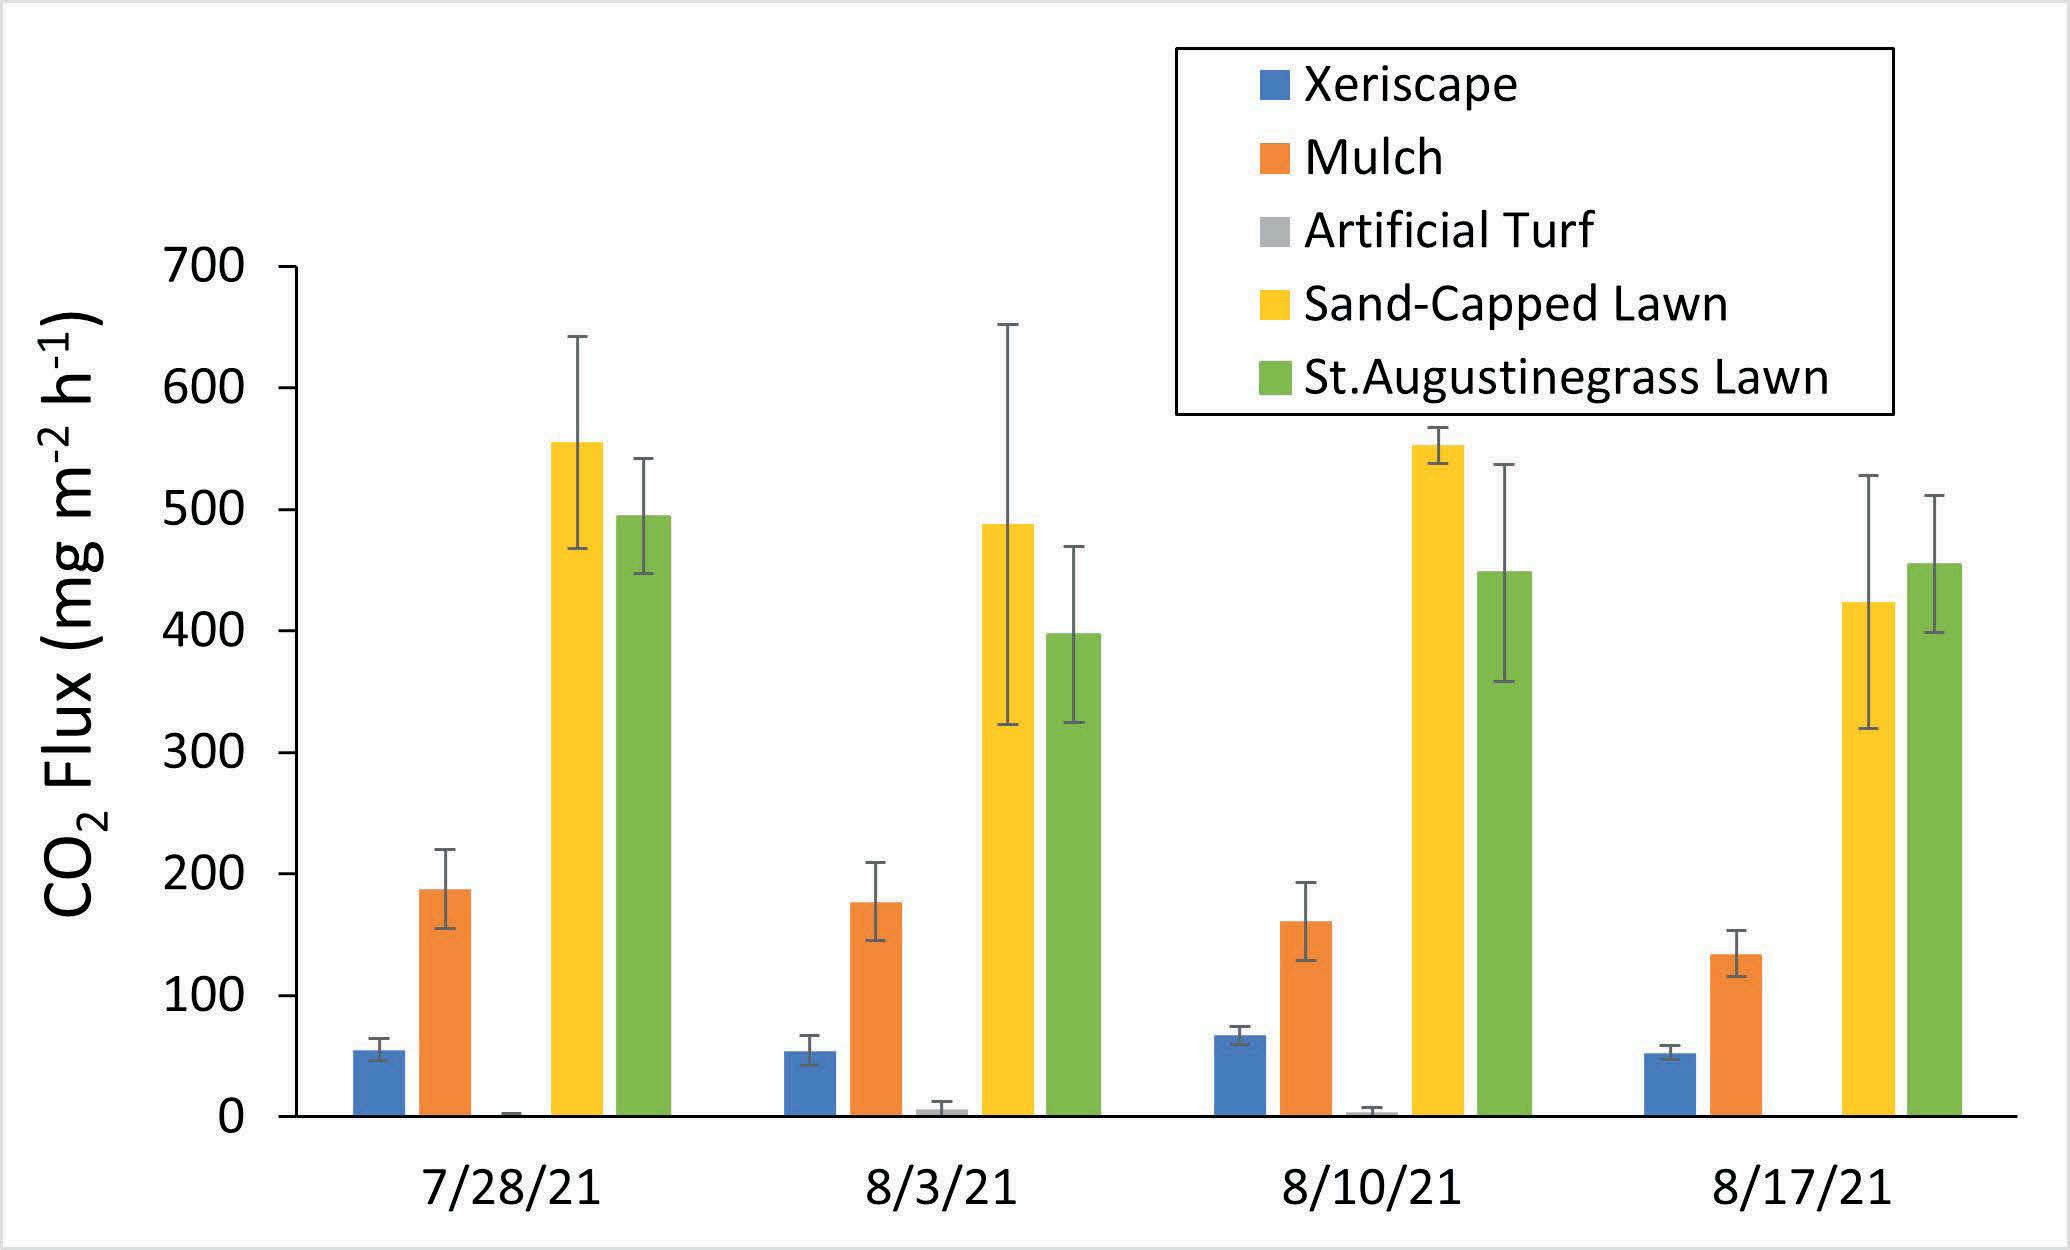
Figure 3. CO2 flux of each landscape type, measured prior to (7/28/21) and at one-day, seven-days, and 14-days after the 8/2/21 fertilization and irrigation event. Measurements were conducted in the morning on each day. Error bars represent standard error.
Neither CH4 nor NH3 were detected for any landscapes on any measurement date, and thus, only the results of CO2 and N2O are presented. The CO2 flux appeared to be correlated primarily with the presence of plant biomass and associated decomposing clippings/thatch, as well as the overall soil organic pool associated with a given landscape type. The highest CO2 flux level was found for Sand-Capped Lawn and St. Augustinegrass Lawn treatments, which we attribute to greater amounts of soil carbon and microbial activity (Figure 3). Even though the same plant palette was used for xeriscape and mulch, CO2 flux was higher on Mulch compared to Xeriscape plots. This is likely to be related to the elevated amounts of
organic matter in the hardwood mulch plots as compared to the decomposed granite-based xeriscape plots. In addition, the CO2 flux seemed unaffected by fertilization/irrigation, as measured emissions did not increase beyond the baseline for any treatments including St. Augustinegrass or Sand-Capped Lawns. It should also be noted that the measured CO2 flux reported here should not be confused with net carbon balance of a given landscape system. This is because the chamber used to measure gas emissions blocked sunlight to the turf, which would have resulted in stomatal closure and prevented gas exchange from the turf during the measurement period. Mulch showed the highest N2O flux among all landscapes over all four measurement dates (Figure 4). This finding suggests that hardwood mulch may produce intermittent anaerobic soil conditions that intensifies N losses through denitrification. Further, irrigation appeared to contribute to elevated N2O flux measured in mulched plots. In addition, except Mulch, N2O flux primarily occurred following irrigation and decreased over time, with no detected amounts two weeks after irrigation/fertilization for any landscapes. Interestingly, there was no N2O flux occurring from the SandCapped Lawn Treatment. Gas emission measurements will be repeated during the summer of 2022.
Subsurface temperatures were monitored from January to August 2021 at the 2 in. (5.08 cm.) soil depth. Data were collected as daily high, low, and average temperatures for all landscapes. As seen in Figure 5., xeriscaping and artificial turf are more sensitive to ambient temperature changes than the other landscapes. For example, during an unusually cold period in February 2021, the lowest temperatures were observed on Xeriscape and Artificial turf (AT). However, during the warmer times of the year, their temperatures became greatly higher than that of the Sand-Capped lawn and St. Augustinegrass lawn, especially when with respect to daily high and daily average temperatures. The daily high temperature for the two lawn types never exceeded 30 degrees C (86 degrees F) during the summer, and in comparison, the daily high temperature of Xeriscape and AT were regularly within the 30 to 45 degree C (86 to 113 degrees F) temperature range. The high subsurface temperature of Xeriscape and AT could have an influence on surface thermal comfort and also may alter the soil microbial activities, which are worth a further investigation in the future study. More extensive measurements including radiation measurements will also be taken during summer 2022.
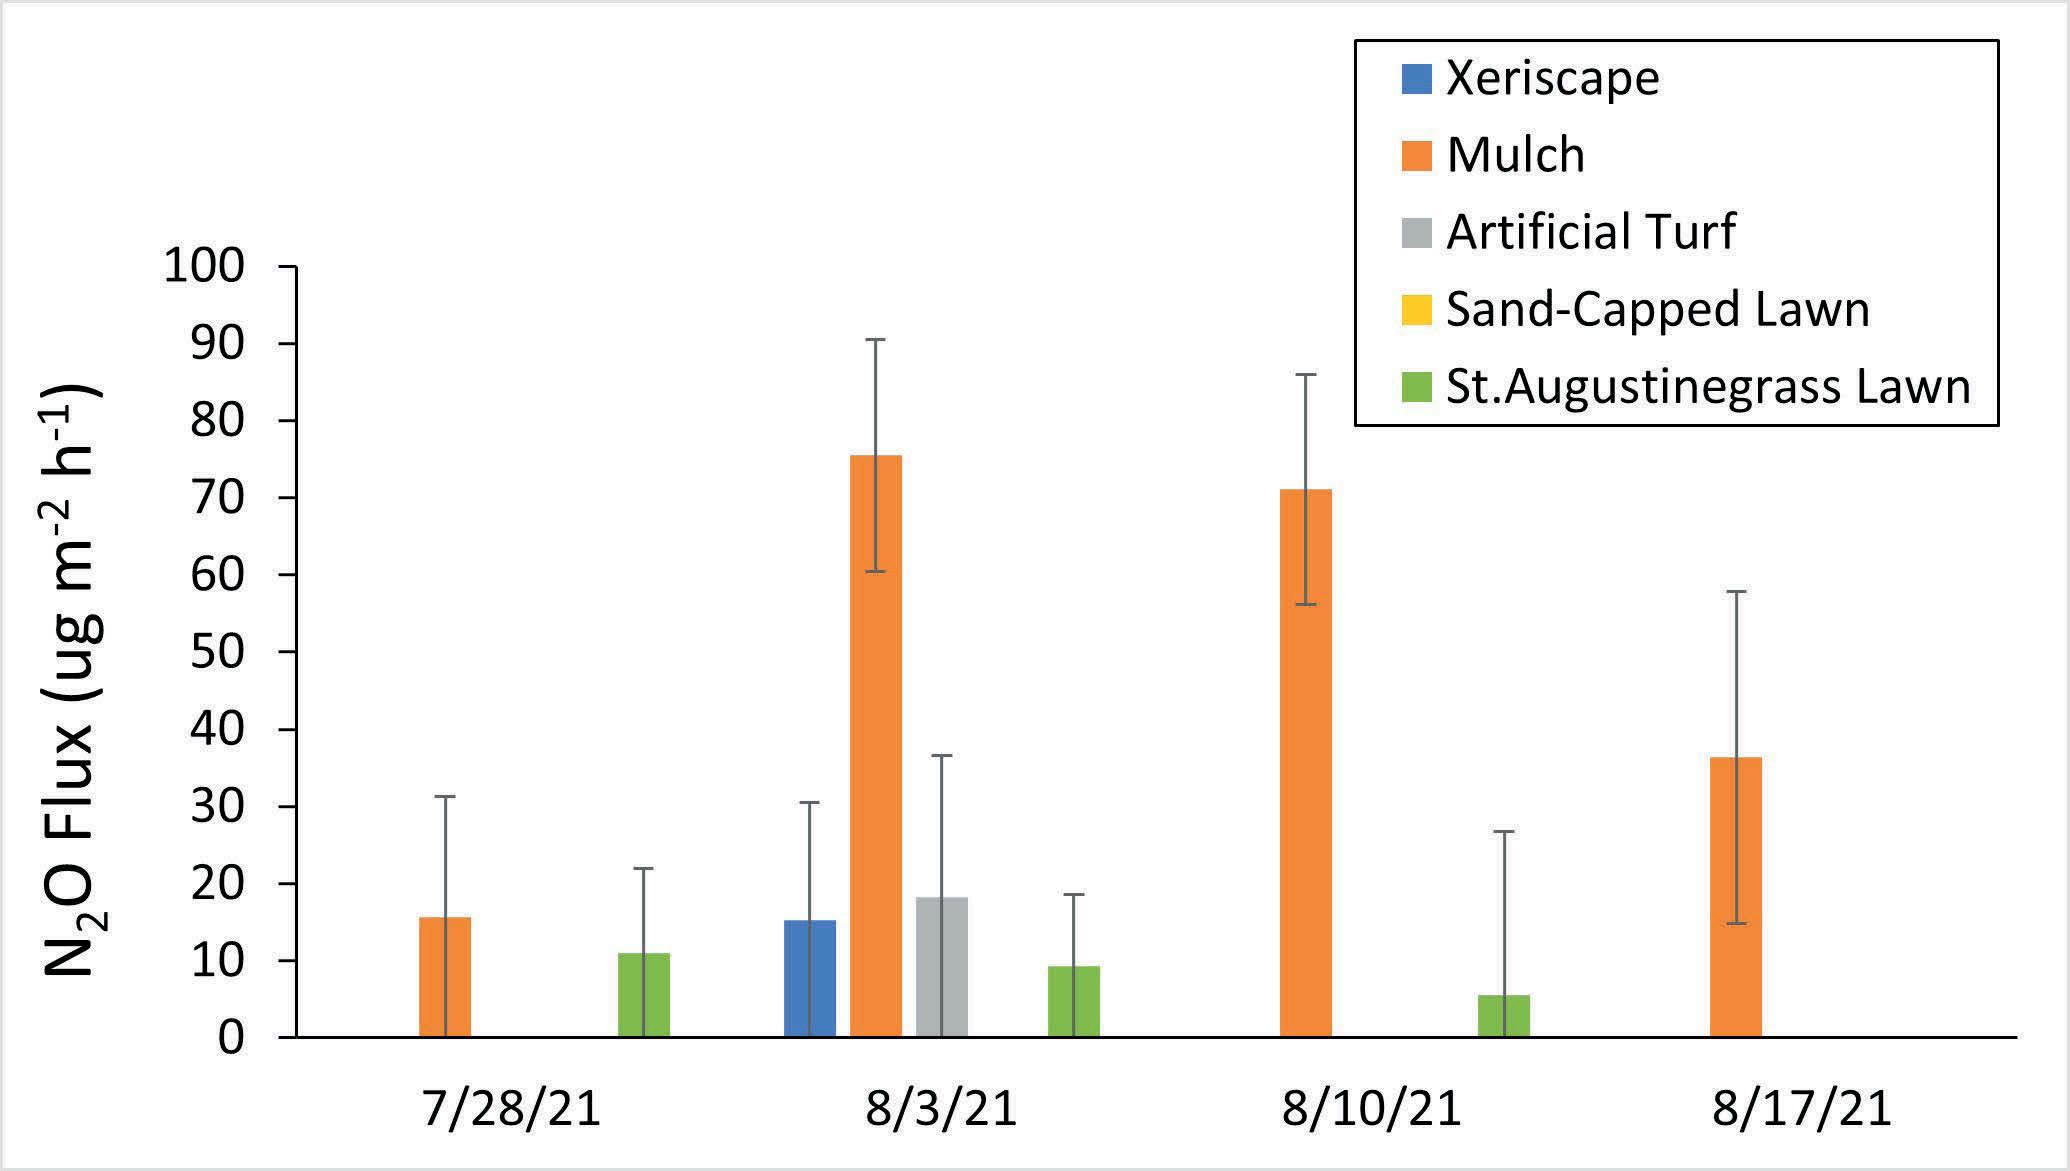
Figure 4. N2O flux of each landscape type, measured prior to (7/28/21) and at one-day, seven-days, and 14days after the 8/2/21 fertilization and irrigation event. Measurement was conducted in the morning on each day. Error bars represent standard error.
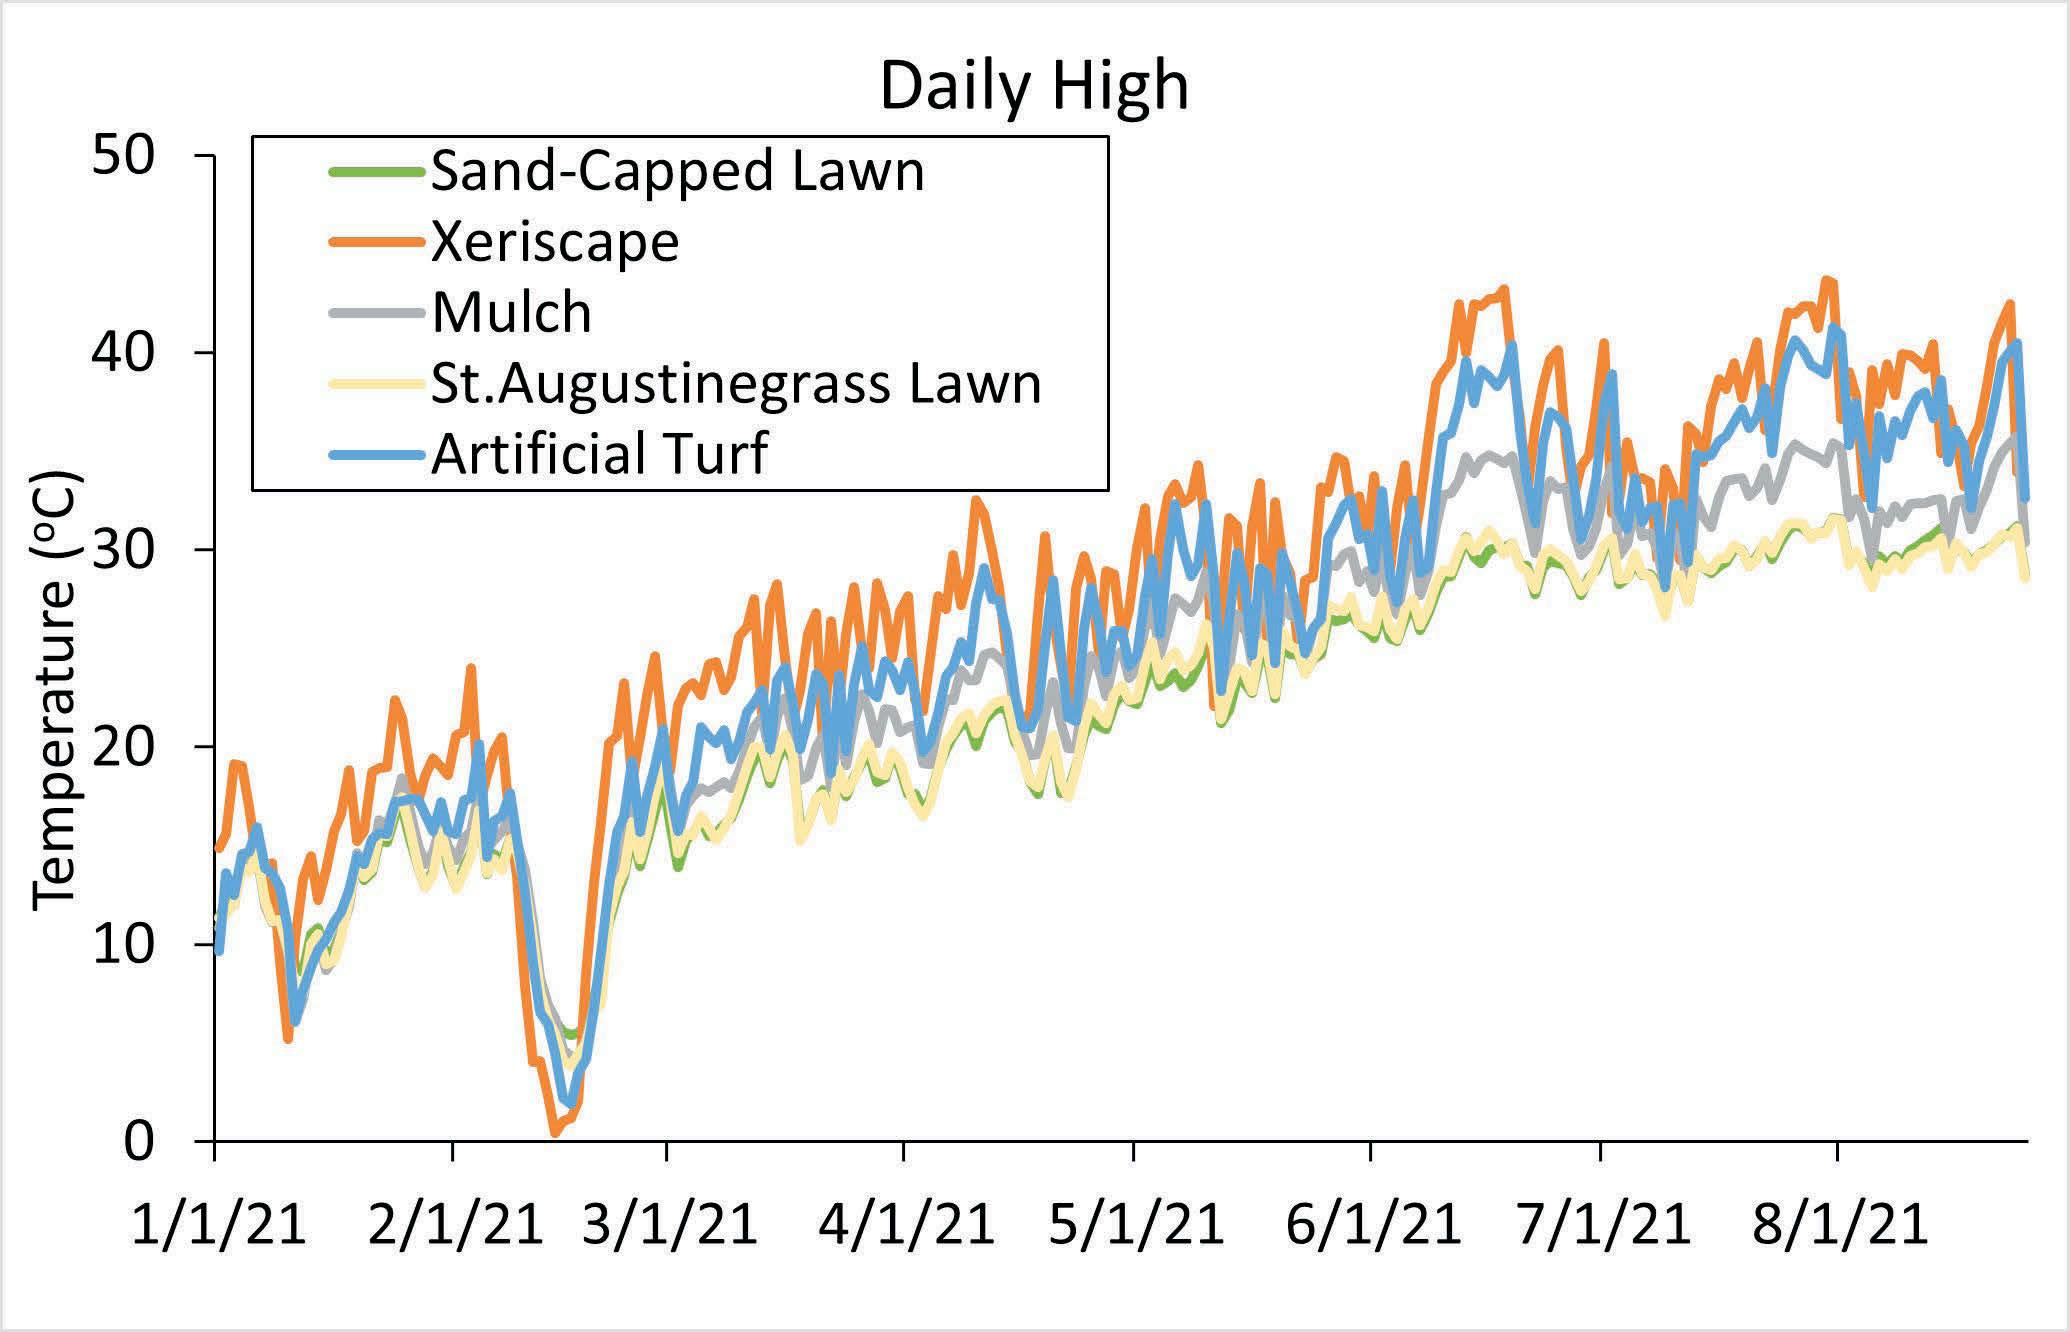
Figure 5. Daily high subsurface (2 in. [5.08 cm.] soil depth) temperature of all landscapes in the Texas A&M Landscape Study.
Recent research has shown that elevated soil nitrate levels may be a concern in the years following removal of turfgrass in landscape conversion plots. In order to better ascertain soil nitrogen levels in plots, soil samples (0-6 in. [0-15.24 cm.] depth) were collected from each plot on 10/19/21, with two cores removed from the center of each plot. Soil cores were divided into upper and lower depths and composited per plot for a single upper and lower sample. The soil sampling approach taken should provide us an ability to monitor the subsurface nitrogen status of each landscape. It seems that the top layer of SC, Xeriscape, and AT are stable three years after the installation, as the depth of sand and granite used for those landscapes have not noticeably changed over time. The only plot onto which surface materials are annually topdressed are Mulch, which is reapplied at 1-in. (.454-kg.) depth annually due to mulch decomposition and vulnerability to water and wind erosion/runoff.
For soil nutrient dynamics, all soil samples have sent to the Texas A&M University soil testing lab for analysis. Requested testing parameters include NH4-N, NO4-N, and organic matter, and samples are still being analyzed. Results will be available in our final report. We are also planning to take soil samples one more time in October 2022.
Sod Strength Characteristics of 24 Fine fescue Cultivars
(2021-23, $20,351)
Editor’s Note: This project has been delayed a year due to a field trial failure. Below is a recap of the research activity to date, along with an overview of what is planned as the project moves forward. There is a clear desire for lower-input sod species, such as fine fescue (Festuca spp.) from consumers (Hugie et al., 2012; Yue et al., 2012). In addition, increasing concerns over the environmental impacts of soil erosion from industrial and infrastructure development are also expected to be rapidly increasing sources of demand for sod. However, despite the fact that many different turfgrass species exist, most sites today in the northern U.S. are planted as sod with the same varieties of Kentucky bluegrass (Poa pratensis), regardless of site management. Recent genetic improvements in low-input turfgrass species now provide sod farms other options when selecting what to plant (Braun et al., 2020). Since the selection of turfgrasses (either low- or high-input) by sod farms ultimately impacts the level of input required by those receiving sod installations (homeowners), decisions made by sod farmers and landscape contractors can have a tremendous impact on the environment and efforts to manage turf sustainably. Preliminary 2019-2020 data from collaborative research at Purdue University and University of Minnesota investigating low-input sod production funded by USDAAMS is showing some promising results with fine fescue sod production, especially with strong creeping red fescue (Festuca rubra ssp. rubra) because of its rhizome system. Results from this USDA funded sod research also show us that there is much variability in horizontal spread between genotypes of strong creeping red fescue. This indicates there may be potential differences among cultivars within a fine fescue species or subspecies. In addition, preliminary results from a The Lawn Institutefunded experiment in 2020 at Purdue University titled “Identification of Successful Nitrogen Fertilization Establishment Regimes for Fine Fescue Sod Production” is showing that strong creeping red fescue is producing the highest sod strength, slender creeping red fescue (F. rubra ssp. littoralis) is the next highest, and then Chewings fescue, and hard fescue (Festuca brevipila) is the lowest sod strength among fine fescues. Preliminary results from this experiment are also demonstrating that plant genetics and not nitrogen fertilization has the greatest impact on sod strength. Overall, the preliminary results from these previous experiments consistently show there are differences in sod strength among the fine fescue taxa (i.e., species and subspecies). New release of fine fescue cultivars, as well as variable cultivar performance in differing environments (NTEP, 2014, 2018), necessitates further sod strength research to continue to provide more information and options for sod producers. Therefore, the objective of this experiment is to identify the best performing cultivars of fine fescues for sod production.
As originally scheduled, this field experiment was to be planted in early September 2021 and again in September 2022 with harvests to occur the following year. The experiment will include 24 cultivar treatments arranged in a randomized, complete-block design with four blocks. All plots will receive the same rate of starter fertilizer at planting and the same annual Nitrogen (N) rate of 2.5 lb. N/1000 sq ft. (1.134 kg. N/92.903 sq. m.) per year. The cultivars in the study include nine varieties of Strong creeping red fescue, six varieties of Slender creeping red fescue, five varieties of Chewings fescue, and four varieties of Hard fescue.
Sod harvests will occur at 9, 11, and 14 months after planting (MAP). These sod harvest timings were selected based on preliminary sod harvest data timings from lowinput sod production experiments, which include various fine fescues and other cool-season turfgrass species at Purdue University at 11, 12, and 14 MAP funded by USDA-AMS. Data collection at each sod harvest timing will include measurements of sod tensile strength
(maximum tensile load and work required to tear sod) per the methods of Friell et al. (2017) and a categorical characterization of sod handling per methods of Gopinath et al. (2015), as well as turf quality and soil moisture. Purdue has a tensile strength device that we are currently using to conduct other research funded by USDA-AMS. Results from this experiment will be incorporated into an extension publication on sod production, showcased at our turf field day, and also discussed at a future TPI meeting. A write-up of the project results will be published in Turf News. Further, results will be distributed via social media (Twitter, Facebook, etc.) and be shared with peers through an open-access, refereed publication, and scientific presentations.
Irrigation Requirements and Consumer Preference for Six Diverse Landscapes in the Arid Western U.S.
(2022-24, $9,450)
Home landscapes—of which lawns often comprise 50 percent or more of total area—provide numerous aesthetic, economic, environmental, recreational, sociologic, and psychological benefits to individuals and society. However, not all landscapes are equal in the benefits they provide and poorly designed and/or maintained landscapes can negatively affect the environment and be expensive to maintain. While only approximately three percent of all Colorado water is used to maintain urban landscapes, green landscapes and their irrigation (especially the lawn/ turfgrass part of landscapes) are a constant target of antiturfgrass/green landscape groups—who lobby for lawn replacement and limitations on the size of lawn area in landscape codes. Further, lawns, parks, and golf courses are the first landscape areas targeted for water restrictions or irrigation bans during drought events. There are numerous unintended consequences of restricting or banning lawn/landscape irrigation—of which these groups and governmental agencies are unaware (or refuse to consider) when implementing restrictions on turfgrass area, turfgrass species, and when instituting irrigation bans. Providing homeowners, government agencies, and anti-turfgrass/landscape groups with factual information on irrigation requirements of lawns and other parts of green landscapes can help them make better management decisions, and will better inform policymakers on the benefits of green landscapes and the relatively small amount of water needed to keep landscapes healthy. Unfortunately, information on total landscape water requirement is lacking in the western U.S.—especially measuring lawn water requirement separate from/and in contrast to the rest of the landscape (trees, perennials, shrubs). This project will document total landscape water use—but also compare irrigation requirement of the lawn (including different turfgrass species) with the other elements of the landscape (trees, shrubs, perennials). Six different “front yard” landscapes (each approximately 1600 square feet [148.645 square meters] in size; 800 square feet [74.322 square meters] of lawn, 800 square feet of mulched ornamentals) will be constructed. Each landscape will be identical in size but will differ from the others in turfgrass type (bluegrass, tall fescue, buffalograss), landscape plant species (trees, shrubs, perennials, groundcovers), or level of irrigation technology. Lawn area size will be identical in each “yard”—as will planting bed size. Each landscape will be irrigated independently of the others—according to plant species’ needs and to provide acceptable/desirable plant vigor and aesthetics. The lawns and ornamental beds in each landscape will be metered separately to allow comparisons within and between the individual yards. Wireless soil moisture sensors (developed by and manufactured at Colorado State University) will be distributed throughout the landscapes, having the potential to drive irrigation controllers for each landscape and their respective lawn and landscape components. Soil quality development over time under lawns and ornamental beds will be monitored using CO2 respiration/burst, soil amino-N, and aggregate stability. Visitors will be encouraged to complete short surveys on preference for landscape type, enhanced understanding of the value of green landscapes and lawns, and knowledge gained during their visit to the gardens. Robotic mowing of the lawn areas will be demonstrated. Construction and maintenance costs of each landscape will be provided to visitors, along with plant lists. An unusual—and perhaps controversial—aspect of this study is that one of the lawns will be synthetic. The goal of including a synthetic lawn in the study is to document the true costs of installing and maintaining a synthetic lawn, and to demonstrate that synthetic lawns do not provide the environmental benefits/services that natural lawns do, including the synthetic lawns’ excessive heating effects of landscapes and potential negative impacts on soil health beneath the synthetic surface—and to demonstrate that synthetic lawns require considerable care to maintain their quality.
Investigating Environmental Implications of Reclaimed Water Use for Turfgrass Areas
(2022-23, $19,780)
Growing populations and declining water resources have forced many communities to critically evaluate how water is being used in the urban sector, particularly because a large portion (~ ≥50 percent) is used for landscape irrigation, which is considered nonessential. Reclamation of municipal wastewater shows promise as a means to meet the continued demand and growing pressure on irrigation water resources. Unlike potable water reserves, quantities of reclaimed wastewater continue to increase due to population growth and provide a readily available source of irrigation. Consequently, irrigation of landscape with treated effluent water (also called reclaimed, reused, recycled, or wastewater) has become a common practice in response to the increasing awareness of potable water shortages. Because raw effluent typically contains significant quantities of many essential plant nutrients, particularly nitrogen and phosphorus, its use to irrigate landscapes could reduce the need and reliance on commercial fertilizers. Thus, irrigating with effluent may provide plants with similar quantities of essential plant nutrients to those delivered via fertigation with a dilute concentration of fertilizer. Conversely, the additive effect of effluent water and fertilizer application may result in enhanced nutrient leaching. Changing the water source will not only affect the grass itself but might also have an impact on plant-associated microbial communities. The microbiome of plants, which is pivotal to both key components of the fitness of plants, growth, and survival, is mostly shaped by nutrient availability and drastic changes in nutrient content in the water will most likely alter their structure and function. The importance of healthy microbiomes for turfgrass is starting to be recognized in the industry, although neither solid data on community structure nor metabolic functions of turf microbiomes have been well described in the scientific literature. Detailed molecular analyzes will compare and contrast microbial communities before and after treatments.
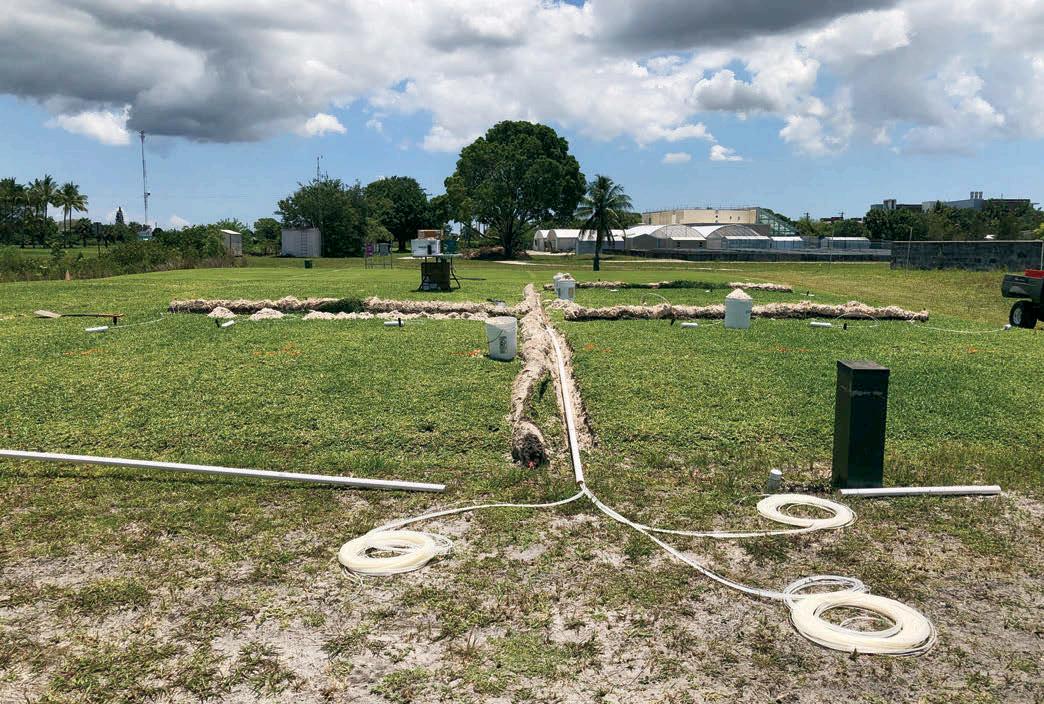
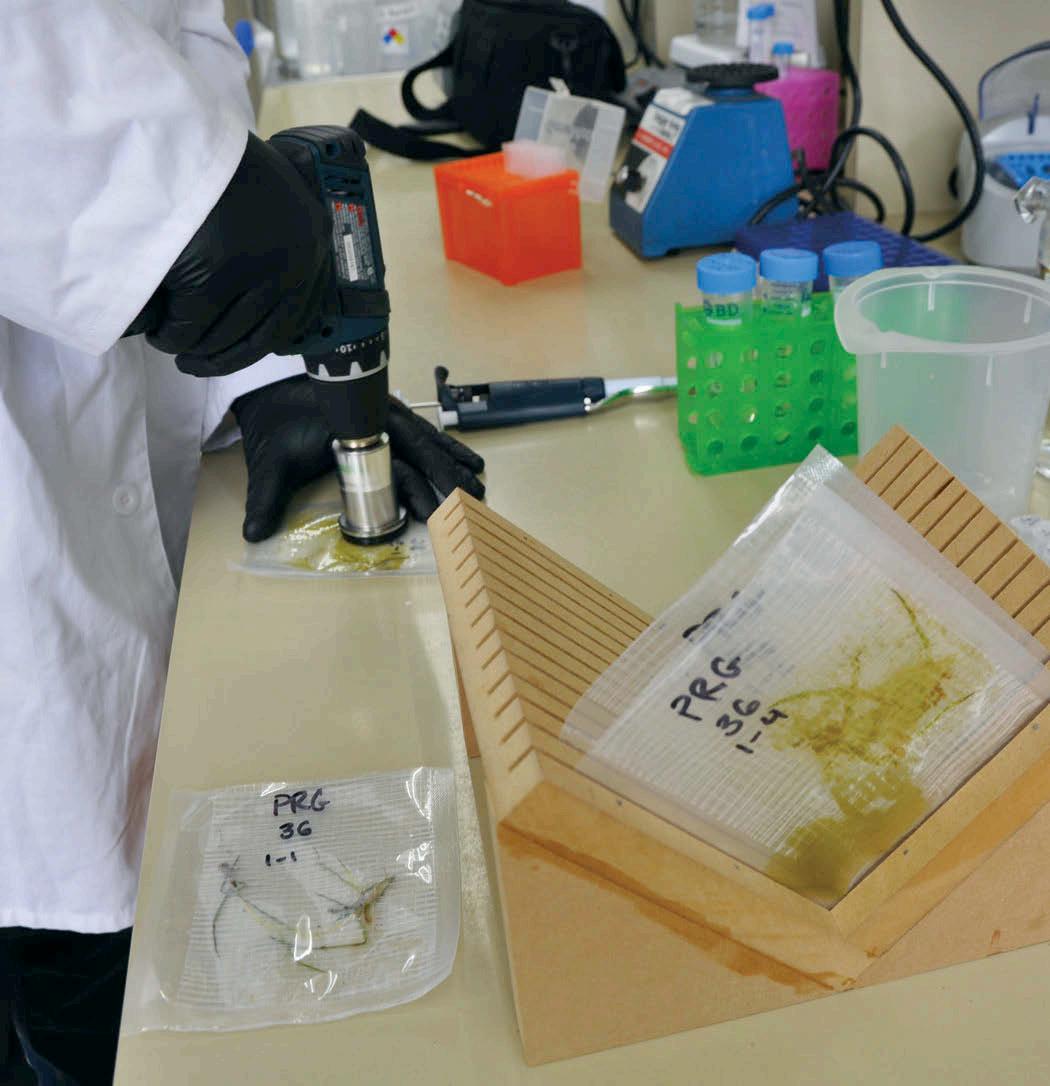
The field study site was established using fresh water. Six irrigation zones of 20 ft. by 20 ft. (6.096 m.) were constructed on native soil in January 2021. ‘CitraBlue’ St. Augustinegrass was sodded on February 8, 2021. Within the irrigation plots, subplots consist of two N fertilization plots. Suction lysimeters were installed in December 2021, and half the area was switched to reclaimed irrigation in the Spring of 2022. Plots are mowed three times per week at 3 inch (7.62 cm.) and watered daily based on previous week evapotranspiration (ET). Nitrogen rates include low and high rates for St. Augustinegrass fertilization.
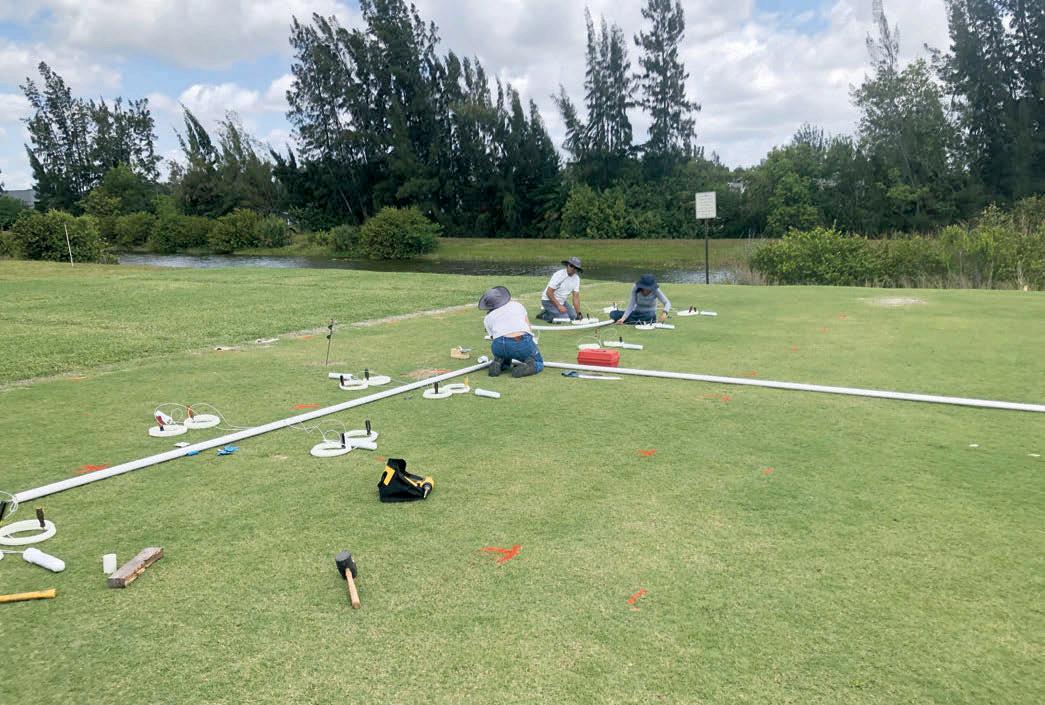
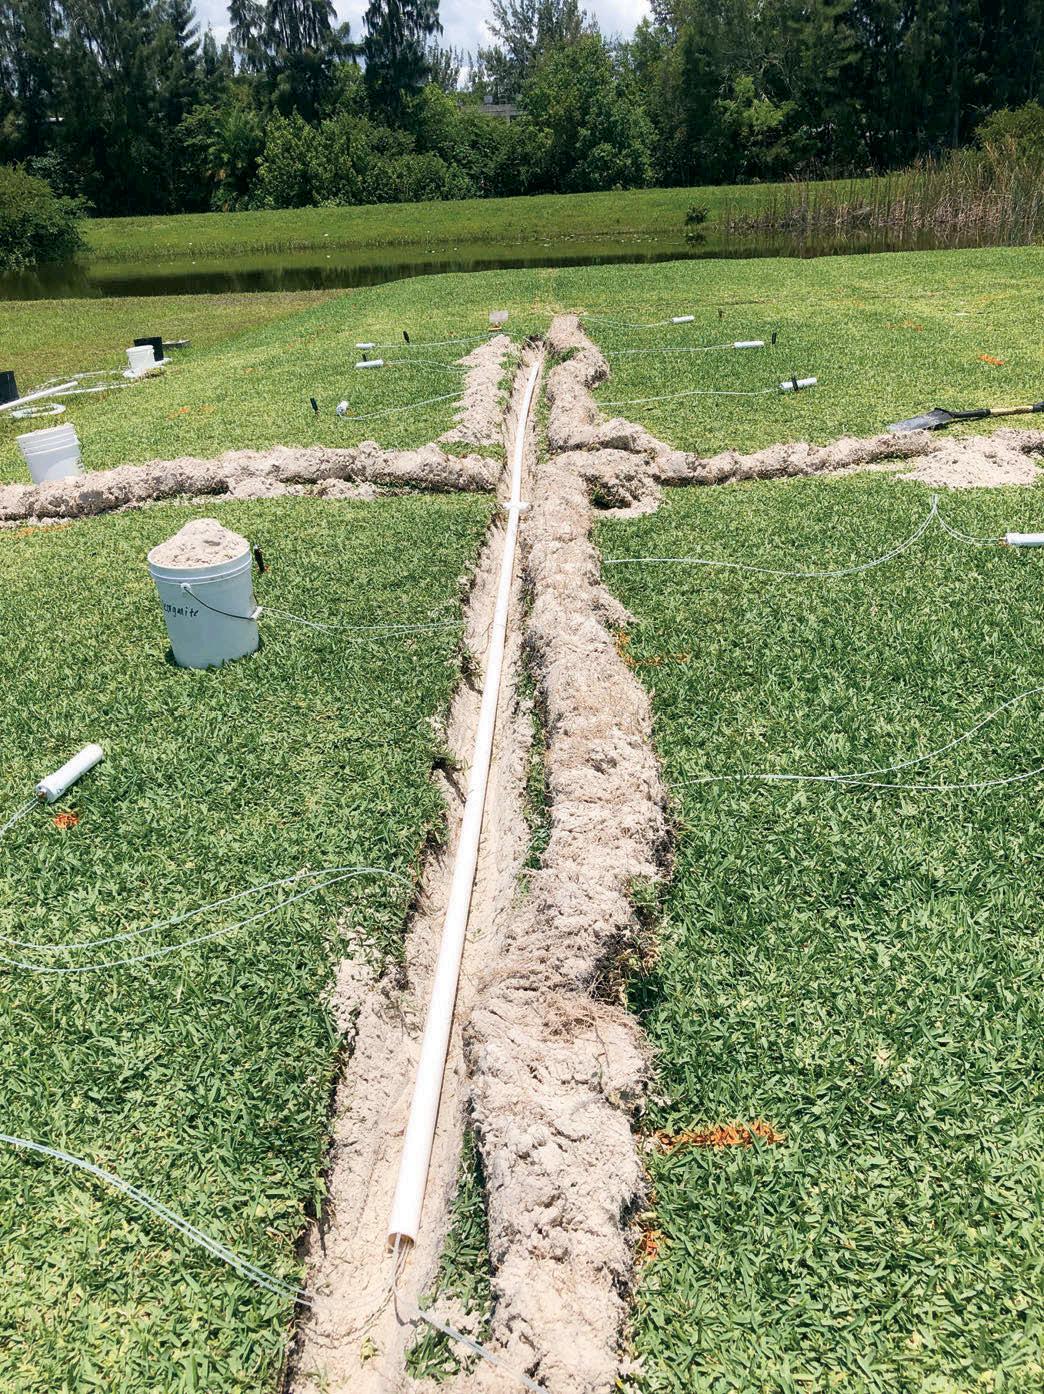
Plot preparation—system lay out
Plot Preparation—Trenching for installation—View one
Plots will be evaluated every two weeks for visual turf quality (1-9 scale), volumetric soil water content (VWC) using time domain reflectometry (TDR), Normalized Difference Vegetation Index (NDVI), and percentage green coverage and dark green color index using digital image analysis. Leachate samples will be collected biweekly by removing all leachate by vacuum extraction for volume determination, and a 20-mL subsample will be analyzed for nitrate (NO3-N) and ammonium (NH4-N) and ortho P concentrations using a continuous segmented flow analyzer (SEAL Analytical, Mequon, WI) at the University of Florida FLREC chemistry laboratory. Tissue samples will be collected monthly to determine growth rate and N content.
Plot Preparation—Trenching for installation—View two
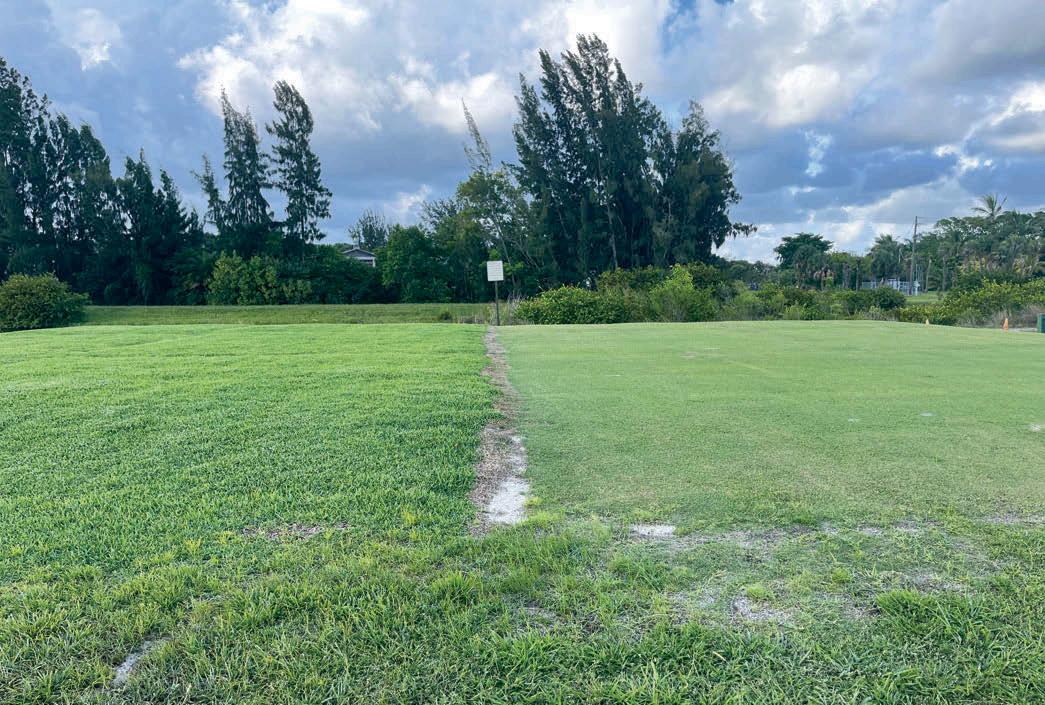
Plots are ready for research
Rhizosphere samples for microbial community analyzes will be collected seasonally from individual plots with a standard 1-inch (2.54-cm.) corer. In this part of the project, researchers will analyze potential changes in microbial structure and function of the microbiome of turfgrass and general soil microbes as a response to treatment with effluent water. Results will help define “healthy” turfgrass microbiomes (when analyzed with fresh water), and identify changes associated with the use of impaired water sources over time.
Potential benefits include enhanced use of wastewater and development of Best Management Practices (BMP) for homeowners and landscapers when reclaimed water is used to irrigate turfgrass, and ultimately decreasing fertilizer use. Studying turfgrass microbiome will lead to a deeper understanding of soil-water-crop dynamics and can lead to better acceptance of turfgrass as a ‘healthy’ environmentally friendly crop, where microorganisms are alive and active and could interact with the surrounding environment. Moreover, better understanding of bacteria and fungi and their function on the soil and their interactions with the host could potentially lead to development of biocontrol treatments.
Stress Response Characteristics Facilitated by Endophytes in Commercially Available Perennial Ryegrass, Tall Fescue, and Fine Fescue Cultivars in Oregon
(2022-23, $20,000)
Endophytes are natural fungal symbionts of many important turfgrass species, including perennial ryegrass, tall fescue, and fine fescues. Endophytes provide several benefits to turfgrass, such as mediated disease resistance, drought tolerance, and insect predation tolerance. However, a current, comprehensive record of endophyte presence in commercially available cool-season turfgrass cultivars is not available.
Endophyte persistence from seed to established turfgrass can be difficult. Endophytes will often perish during the process of seed harvest, storage, distribution, and plant establishment. Turfgrass stress and environmental conditions once the plants are established can also diminish endophyte populations. An assessment of endophyte after turfgrass establishment would be useful to show which variety-endophyte combinations are most viable and easy to maintain.
Finally, comparing endophyte status and populations to available turfgrass data (germination/establishment rates, color, quality, drought tolerance and traffic tolerance) collected from a large number of commercially available turfgrass cultivars also would be advantageous in determining which endophytes can be used to improve turfgrass management.
Objectives
The objectives of this project are to 1) Identify endophyte presence and type in large scale fine fescue, tall fescue, and perennial ryegrass cultivar studies at Oregon State University, Corvallis, Oregon, and 2) Correlate endophyte presence with response variables (establishment, visual quality, visual color, drought tolerance, and traffic tolerance) collected from these cultivar studies.
This will be done by exploring endophytes present in 25 fine fescue cultivars in the 2022 Alliance for Low Input Sustainable Turfgrass (A-LIST) Fine Fescue trial. Fine fescue quality and drought tolerance will be compared to endophyte presence and type for this study. Researchers also will explore endophytes in the 2016 NTEP Perennial Ryegrass Trial in Corvallis, OR. For this portion
of the project, researchers will be evaluating the endophyte population for the 50 commercially available perennial ryegrass cultivars in the study. Tiller field samples will be collected for each plot for endophyte analysis. Establishment, monthly color, monthly quality, and traffic tolerance will be compared to endophyte presence and type for this study. In the fall of 2023, endophyte exploration will occur in the 2018 NTEP Tall Fescue trials located in Corvallis, OR, which includes 42 commercially available cultivars. Tiller field samples will be collected for each plot for endophyte analysis. Establishment, monthly color, monthly quality, and cold tolerance will be compared to endophyte presence and type for this study. Polymerase Chain Reaction (PCR) will be used for evaluation of endophyte status and type.
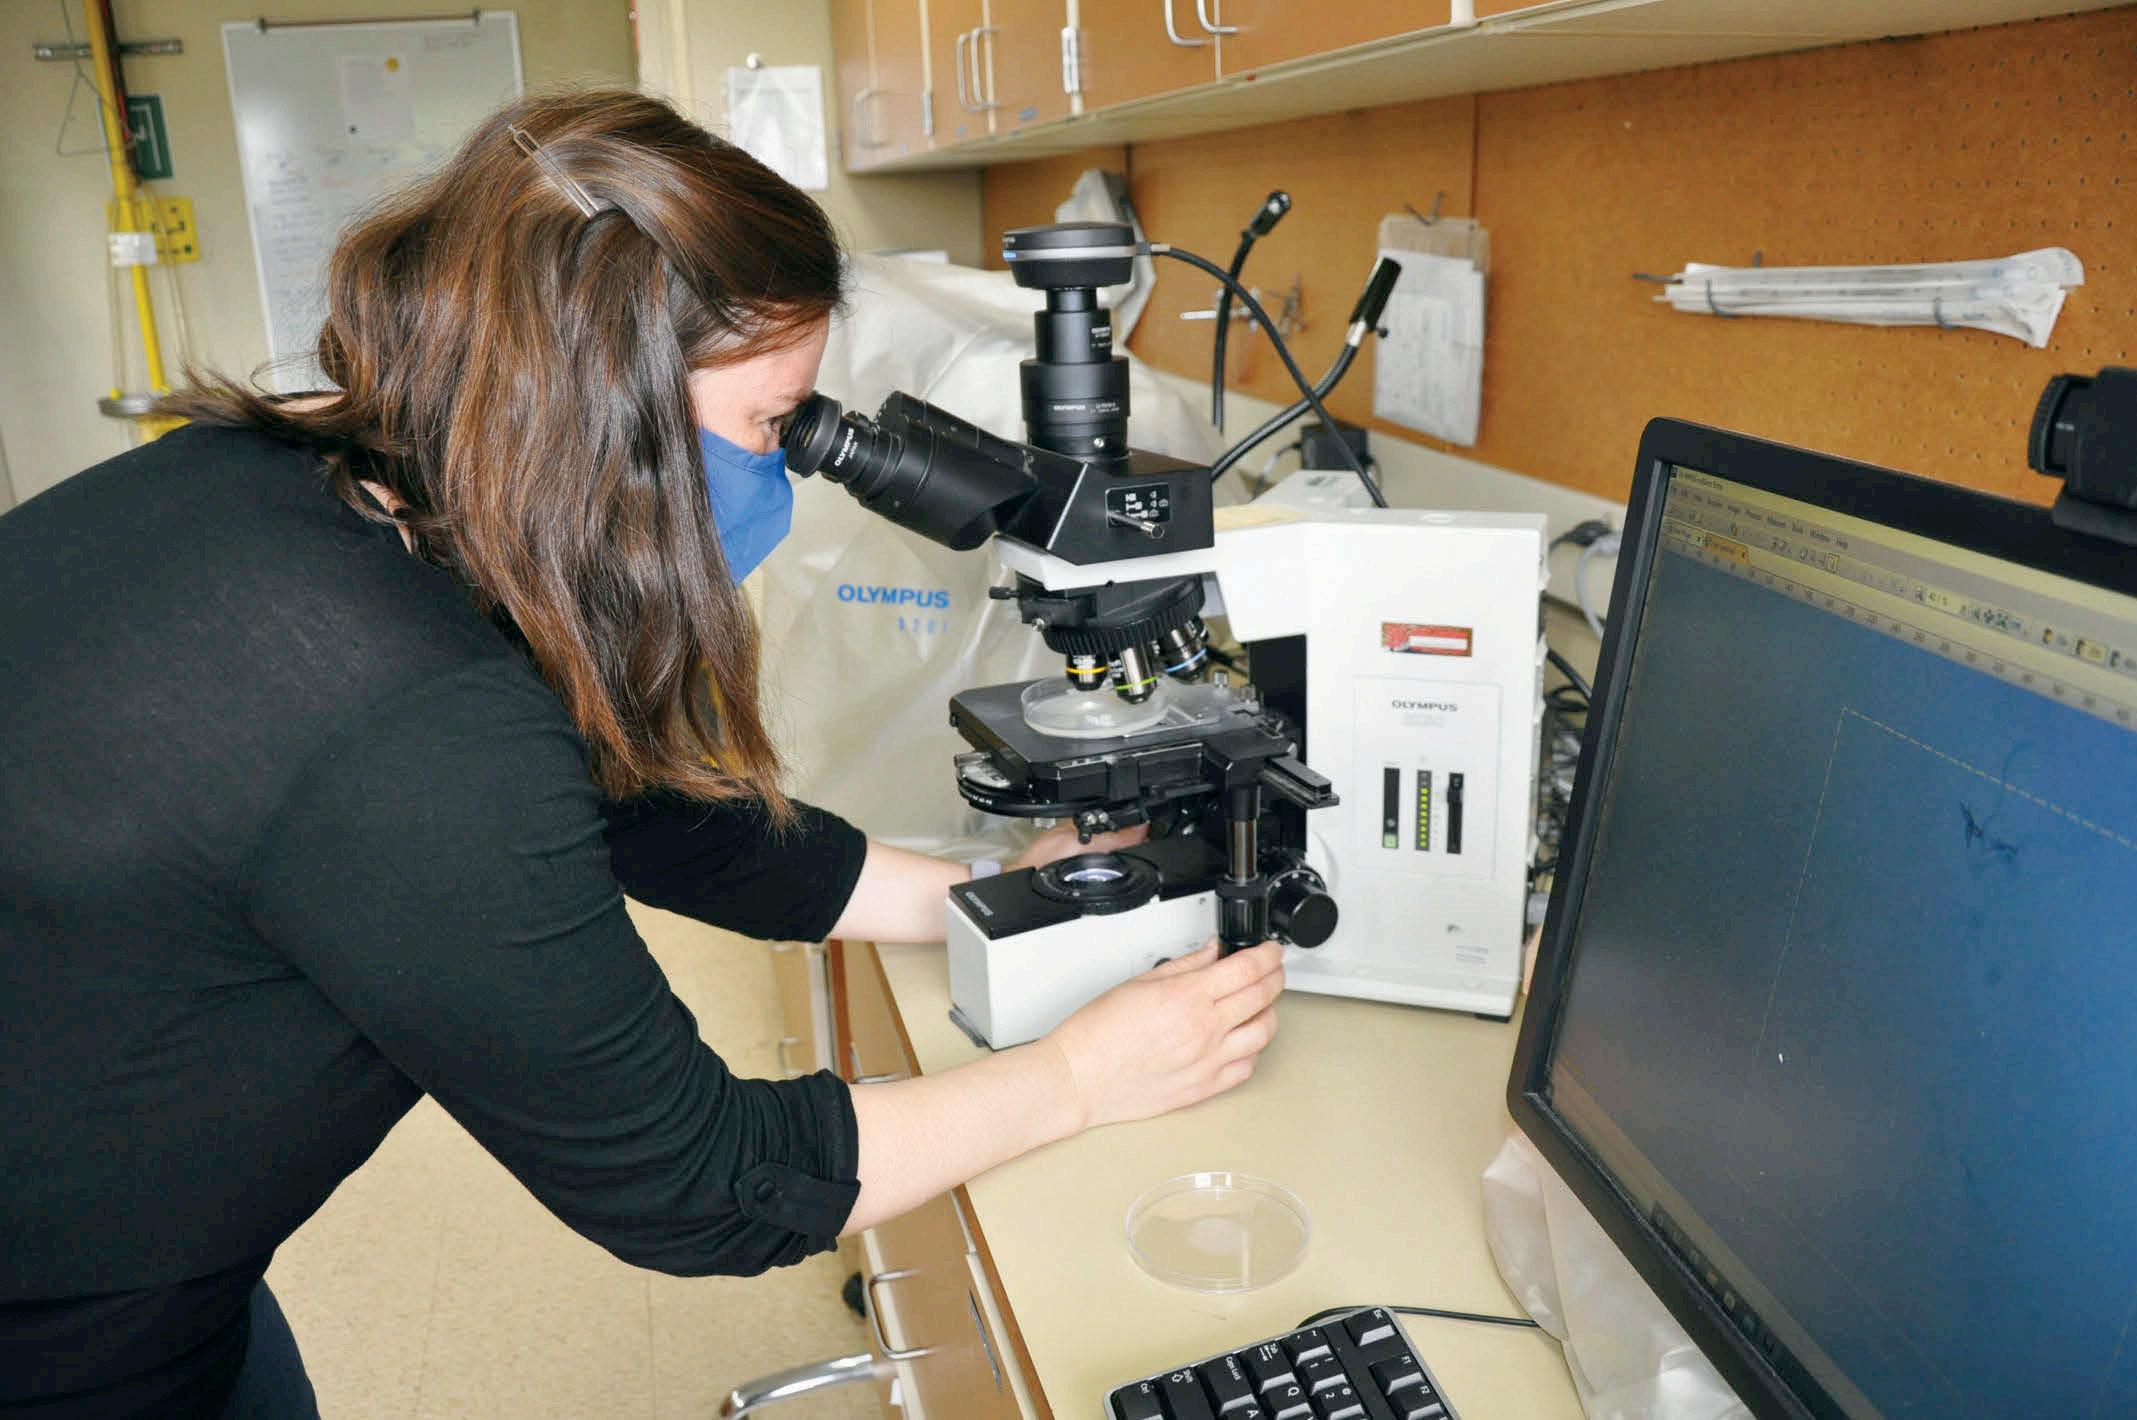
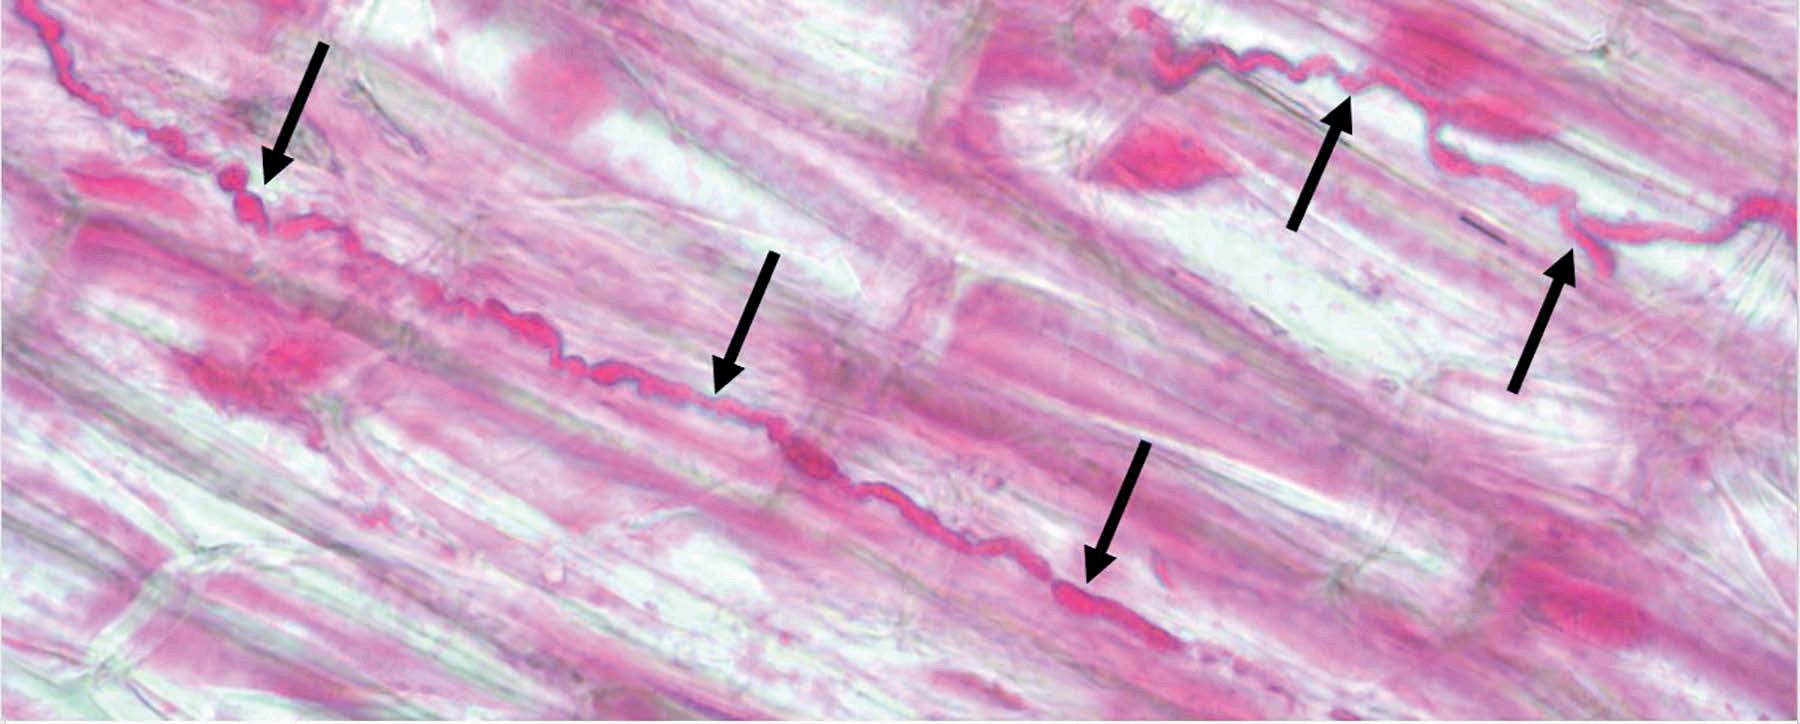
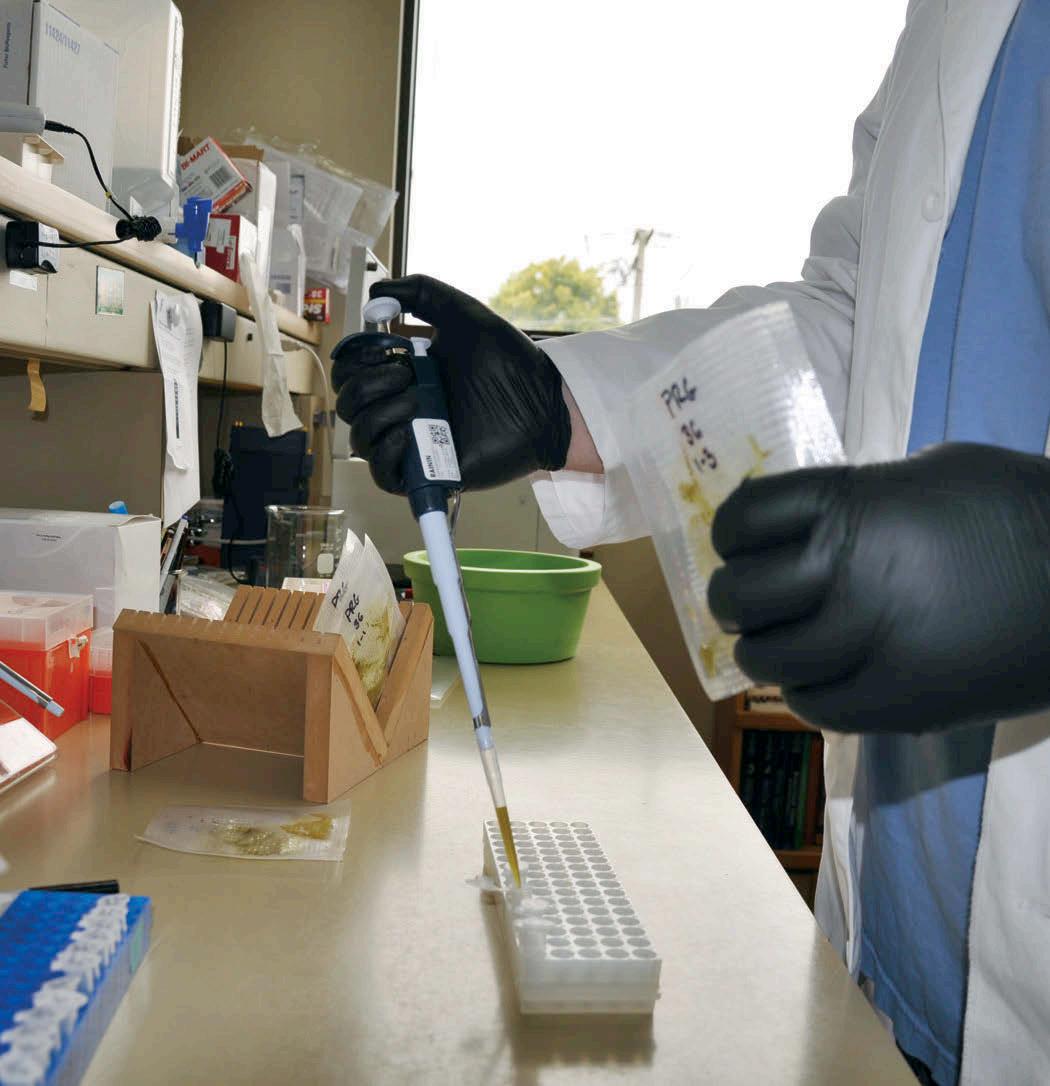
Image 1: Dr. Hannah Rivedal at the USDA-ARS Laboratory in Corvallis OR seeks visual confirmation of endophyte presence (top). The black arrows point to Endophytes within turfgrass cells under microscope magnification, photo provided by Dr. Ruying Wang, OSU (bottom).
Findings from this project will identify endophyte populations within commercially available perennial ryegrass, tall fescue, and fine fescue species. Cultivars with endophyte populations observed at this time will be excellent choices for those planning to seed turfgrass with endophytes as the endophyte has survived seed harvest, storage, and distribution, and displayed persistence within the host plant after establishment. Findings from this study will also correlate endophyte presence and type with turfgrass establishment, color, quality, drought tolerance, and traffic tolerance.
Step 1 Step 2
Step 3 Step 4
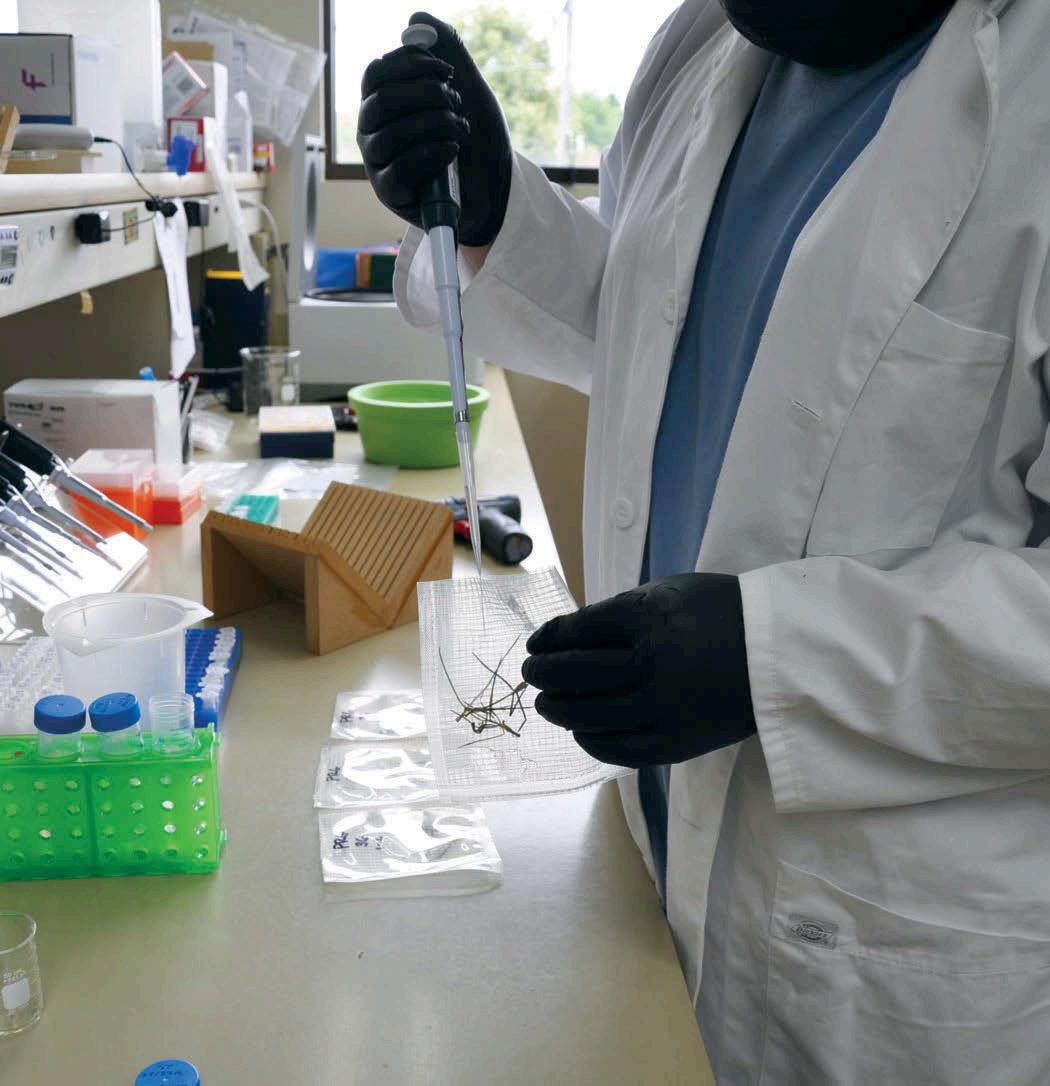
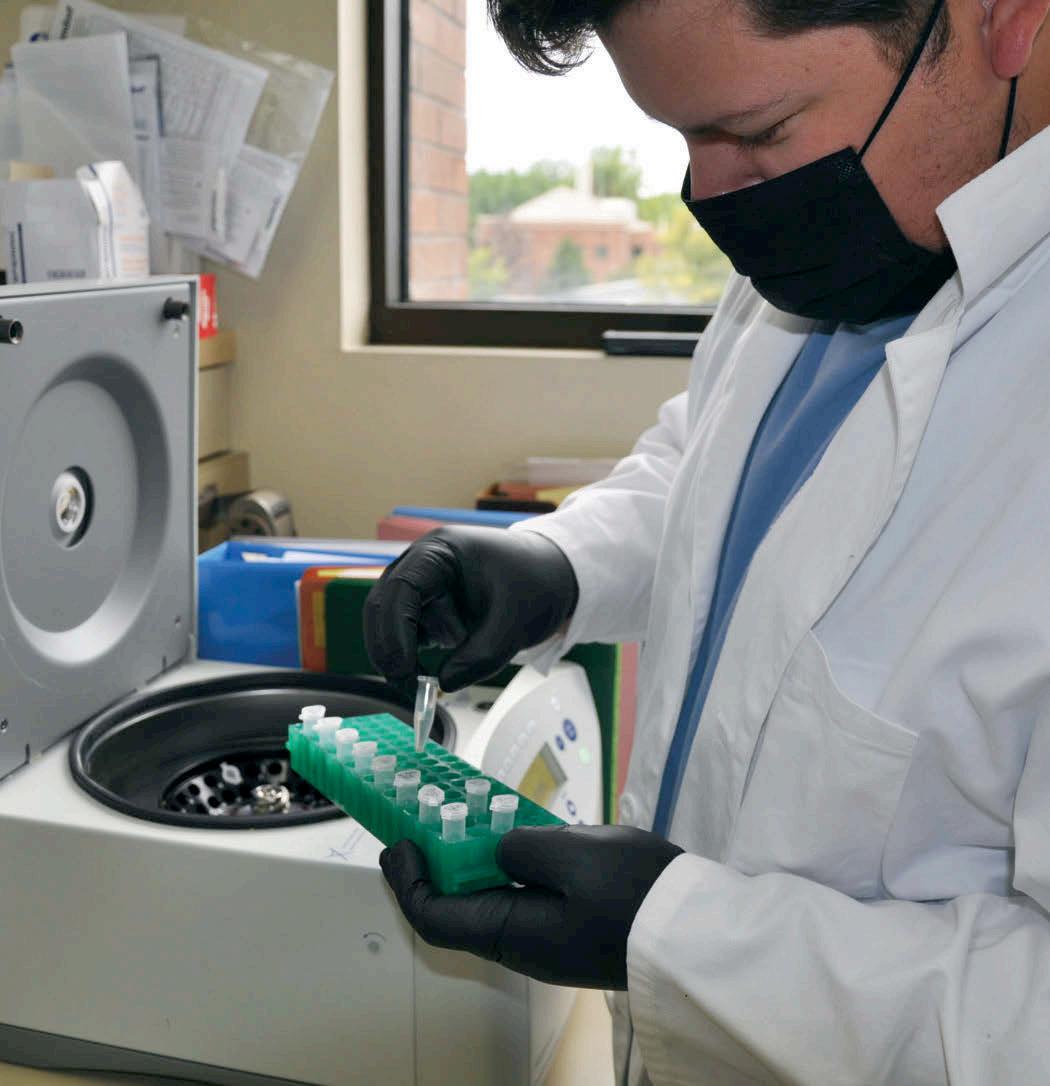
Image 2: The endophyte DNA extraction process being performed by Robert Starchvick at the USDA-ARS laboratory in Corvallis, OR. NTEP perennial ryegrass samples were collected from the OSU Lewis-Brown Horticulture Farm in Corvallis, OR.
USGA/NTEP National Water-Use Trial – Warm-Season Species
(2018-21, Warm-season Trials $30,000)
As discussed at previous TPI Lawn Institute Research Committee meetings, the United States Golf Association (USGA) budgeted considerable funding to conduct a national water use and drought tolerance trial, utilizing the National Turfgrass Evaluation Program (NTEP) as its evaluation organization. USGA funded the building of rainout shelters and irrigation infrastructure at several locations, and is working with NTEP in determining testing protocols, data collection methods, etc. Besides data collection on water use and drought resistance parameters, the goal of this effort is for the EPA WaterSense® program to adopt these (or similar methods) and to agree to certify the first plant species with the WaterSense label. USGA has become a WaterSense partner, and we have talked to the WaterSense staff about certifying grasses. EPA is very interested in the concept (they have never certified a plant or plants as water saving) as we have met with them to discuss collaborative efforts. However, EPA needs to see more about the methods and tests, as well as we believe, some successful trials. Also, they will need our help in solving some legal requirements when certifying a product (could be unique for plants, however). Thirty-two cool-season grasses of Kentucky bluegrass, tall fescue, and perennial ryegrass, were evaluated from 2017-2020 at ten locations across the U.S. Five locations utilized rain exclusion shelters in the wetter eastern and midwestern U.S., and five locations were established under three replacement ETo levels in drier western U. S. locations. This data, available on the NTEP website (https://www. ntep.org/csl.htm) showed some significant water use differences among species, and some entries, with the below adequate quality often seen under the most restricted ET o replacement levels. The warm-season version of this trial was established in summer 2018 at ten trial locations (five rain exclusion shelter, five using ETo -based deficit irrigation). This trial consists of seventeen entries: eleven bermudagrasses, five zoysiagrasses, and two buffalograsses. Due to the pandemic, some data collection had to be suspended (due to restrictions on access or available labor). One university (Kentucky) even eliminated their turfgrass program during the pandemic, which meant only one year of data was collected from the site.
The cost to run each trial location is high, and only a portion of that is covered by USGA’s donation ($250,000). Therefore, we sincerely appreciate the support received from The Lawn Institute (TLI) for the initiation of this trial. Without your support, this trial would not be conducted.
WARM-SEASON TRIAL
Due to slow establishment of some entries, data collection did not initiate until 2020. Data was collected at eight sites in both 2020 and 2021. Data from 2020 is available at https://www.ntep.org/wsw.htm, with 2021 data available later this summer.
APPROACH 1
Rain exclusion shelter sites (Approach 1) rewatered plots when percent green cover reached 65 percent. Rain exclusion shelters are used to simulate 120-to-150-day drought periods in higher rainfall regions. Under the rain exclusion shelters, we measure the amount of water needed to maintain 65 percent green cover, rate turfgrass quality, as well as evaluate recovery from drought when irrigation is resumed. Irrigation amounts needed to maintain 65 percent green cover varied considerably among entries, and in some cases was more than double the best entry. Due to facility and staff changes, two sites did not submit 2021 data. The eight remaining sites collected and submitted 2021 data, allowing us to make inferences about second-year performance of this trial. Approach 1 sites (Mississippi State, MS; Griffin, GA; Jay, FL; Stillwater, OK) collected data on percent green cover, carefully watered plots with less than 65 percent green, recorded watering of each plot, and then presented total water applied per entry. At the Approach 1 site in Stillwater, OK, the amount of water needed to maintain at least 65 percent green cover over the drought period varied from 0 – 67.7 mm (0 – 2.6 inches). Bermuda entries ‘FB 1628’, ‘TifTuf TM’, and ‘Tifway’ did not require any water to maintain 65 percent green cover. Joining those bermudas in the top statistical grouping were ‘Stellar’ zoysia (8.3 mm) (.327 in.), ‘Tahoma 31’ bermuda (8.3 mm) (.327 in.), and ‘FAES 1306’ zoysia (16.7 mm) (.657 in.). More water was required to maintain 65 percent green cover at the Approach 1 site in Mississippi State, MS. The lowest water users were all either bermudagrasses: ‘Monaco’ (50.7 mm) (1.996 in.), ‘Tahoma 31’ (51.0 mm) (2.009 in.), ‘Rio’ (67.7 mm) (2.665 in.), ‘ASC 119’ (93.0 mm) (3.661 in.), and ‘ASC 118’ (135.7 mm) (5.343 in.), or buffalograsses: ‘Cody’ (118.3 mm) (4.657 in.)and ‘Prestige’ (135.7 mm) (5.343 in.), where the entry with the greatest water use needed 313.7 mm (12.3 inches). At the Approach 1 sites in Griffin, GA, and Jay, FL, statistical significance was much smaller than at the Mississippi State and Stillwater locations. At the Griffin site, ‘TifTuf ’ required the least water (8.3 mm) (.327 in.) of all entries, followed by ‘Meyer’ zoysia (13.3 mm) (.524 in.) and ‘Tifway’ bermuda (25.3 mm) (.996 in.), two standard entries in this trial. However, at Griffin, no statistical differences were noted in water use among entries with total water used ranging from 8.3 – 71.0 mm (.327 – 2.795 in.) (LSD=77.8 mm) (3.063 in.). At Jay, FL, bermudas ‘TifTuf ’, ‘FB 1628’, ‘OKC 1221’, ‘Rio’, and ‘Tahoma 31’, along with ‘Meyer’ zoysia did not require any water during the test period. Other entries requiring only one-half inch (12.7 mm) of water or less at Jay include ‘Monaco’ bermuda (4.3 mm) (.169 in.), ‘Stellar’ zoysia (8.3 mm) (.327 in.), and ‘FAES 1306’ zoysia (12.7 mm) (.5 in.). These entries and seven others are included the Jay, FL, top statistical group for water use in 2021.
APPROACH 2
The drier climate ET o-based sites evaluated performance at three deficit irrigation levels for 120 to 150 day (1721 weeks) periods. The exception is the Fort Lauderdale, FL, location which ran its evaluation for 33 weeks. Data recorded includes percent green cover over time, turfgrass quality, and recovery rate after complete replacement irrigation is initiated. The ETo -based locations allow us to determine the minimum level of deficit irrigation appropriate for, and thus the water savings from, each entry. It was determined that 60, 45 and 30 percent ETo replacement levels would be utilized for data collection. The Ft. Lauderdale site’s growing season is twelve months therefore their Approach 2 testing period is much longer than the others. As in 2020, the surprising result from 2021 was how well the entries performed even at the 30 percent ETo replacement. On most turf quality rating dates, all entries had scores at or above the minimum acceptable quality level of 6 under the 30 percent ETo. As a result, sixteen of the seventeen entries finished the season in the top statistical group. This is the second year we have seen the lowest ET o level producing adequate for turf quality in south Florida. The entries finishing with the highest overall turf quality include ‘TifTuf ’ (TQ=7.0), ‘FB 1628’ (6.9) and ‘Tifway’ (6.9).
The Riverside, CA Approach 2 location, again in 2021 reported much different results from the subtropical Ft. Lauderdale site. Turf quality averages were below the minimum overall turf quality average of 6.0 under 30 percent ETo replacement. ‘TifTuf ‘, finishing with the highest overall quality at 5.2, posted an acceptable turf quality rating in five of the first eight weeks, the most of any entry. Over the twenty-week drought stress period, besides ‘TifTuf ’, ‘Dog Tuff’, ‘FB 1628’, ‘Tifway’, ‘Monaco’ and five others had statistically equal overall turf quality averages. At the 45 percent ETo replacement level at Riverside, ‘TifTuf’ (TQ=6.2) was the only entry to deliver acceptable turf quality averaged over all rating dates. At the College Station, TX, and Las Cruces, NM, locations, the entries also performed surprisingly well under the 30 percent ETo level with several finishing at turf quality above 6.0. ‘TifTuf ’ bermuda and ‘Prestige’ buffalograss were the only entries in the top statistical group to maintain at least a 6.0 quality score on each rating date across the twenty-week trial period at College Station. Similarly, the Las Cruces, NM, 30 percent ETo level data showed five entries, ‘TifTuf ’, ‘FB 1628’, and ‘Tifway’ bermuda, and ‘FAES 1307’ and ‘Meyer’ zoysia, with a 6.0 or higher on each rating date. ‘FAES 1307’ and ‘TifTuf’ finished tied for highest overall turf quality (6.9) at Las Cruces. Warm-season water use and drought data can be found at https://www.ntep.org/wsw.htm.
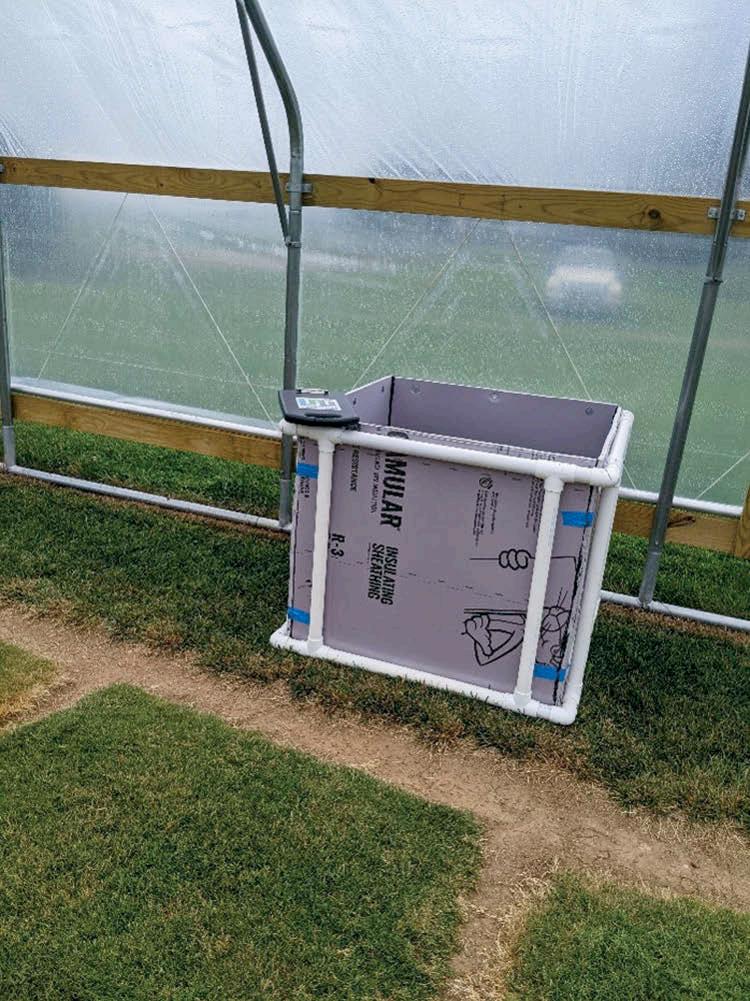
The “Irrigation” Box used to restrict water applications to only a one-meter square area in the middle of the plots.
Objectives and Deliverables The objectives of this trial are the following:
1. Determine the 100-150-day, summer water use of coolseason and warm-season turfgrass species and cultivars.
We now have three years of data from all ten cool-season sites, therefore that trial is complete. We have two years of data from the warm-season trial, collecting the final year of data in 2022. We have seen large differences among some entries, with overall greater statistical significance in the warm-season data as compared to the cool-season grass entries.
2. Determine turfgrass recovery of grasses after 30 days and 60 days without water.
Recovery has been measured, but as stated in question 1 above, not as much statistical significance with the coolseason grasses has been noted at some sites. The warmseason trial is providing much greater significance and excellent water use rates.
3. Determine the percent ET replacement required by each entry to maintain a prescribed level of green or quality.
Similar to question 1, for cool-season grasses, we have three years of data from all ten sites. One thing we can say is that all sites are not created equal, for example, the lowest (40 percent) and medium (60 percent) ET replacement did not deliver any acceptable entries at Riverside, CA, which means more breeding is needed for these grasses to be used with less water at an environment such as Riverside. At other sites, such as Las Cruces, NM, 60 percent ETo did show some entries with acceptable performance, probably because some summer rains occur there. The warm-season grass trial has delivered similar results, and in some cases surprising ones. The Ft. Lauderdale, FL, site has shown that the lowest ET o replacement level (30 percent) is often adequate for many warm-season grasses. This differs from the Riverside, CA, site where ETo level has a significant effect on performance.
4. Develop requirements for water use and drought tolerance/recovery to be certified as a low-water use turfgrass.
See answer to questions 1 and 3…we need three years of data to make determinations.
5. Work with U.S. EPA WaterSense or another organization to develop and apply a national water saving certification to qualified turfgrasses.
We are in contact with the WaterSense office, but since EPA has been struggling with funding, it has been impossible for WaterSense to move forward with turfgrass certification. However, we did help and support Congressional authorization of WaterSense, which passed in 2020. Authorization helps protect the WaterSense program from elimination while also allowing EPA to request separate WaterSense funding in their budget requests (they have never had a separate budget line item for WaterSense, which has restricted the program’s growth). We feel that eventually, a WaterSense turfgrass certification program may be possible.
We are working now with the Metro North Georgia Water Planning District about a potential turfgrass water-conserving recommendation program for their region, based on NTEP data. This program, if implemented, could be a pilot program for a national WaterSense certification program.
As a follow-up to these trials, we have secured USGA funding for a new cool-season grass water use trial, to be planted at six locations in 2022. This trial will focus on bentgrasses, fineleaf fescues, and other species for fairway use, using similar approaches and with similar goals: that is to measure water needed to maintain a prescribed level of green cover, as well as performance under various replacement ETo levels.
Call for Research Proposals
The Lawn Institute will continue to release its annual Call for Research Proposals each August and work hard to fund research that is impactful to TPI members. If you have questions or comments about this process; or about specific research interests, please contact Dr. Casey Reynolds at creynolds@TurfGrassSod.org.
Casey Reynolds, PhD, is executive director of Turfgrass Producers International.
All photos and graphics for this article have been supplied by the research team of the research project in which they appear.