
17 Rose Drive Fort Lauderdale, FL 33316 FL CA #32365 Captiva Island Vulnerability Assessment and Adaptation Plan forWSSSIROwner,LLC September2022
page is intentionally blank
This
September 16, 2022
Greg Spencer President
WS SSIR Owner, LLC
1031 W Morse Blvd, Ste 350
Winter Park, FL 32789
P (321) 280-1552
E gspencer@timbersresorts.com
Dear Mr. Spencer,

Captiva Island is a barrier island community in Lee County, off the western coast of Florida in the Gulf of Mexico. Like many other barrier islands, it faces a variety of natural hazards. Its beaches are prone to erosion, and its inland areas susceptible to flooding from rain and groundwater, as well as storm surge. The environmental and economic health of the island relies on a delicate ecosystem that can easily be damaged impacted through diminished water quality caused by untreated increased runoff.
Understanding the risks these hazards pose is critical to proper development and adaptation planning. This report summarizes these hazards on varying time and severity scales to aid South Seas Island Resort and the Captiva Island community at large understand the risks posed by flooding and sea level rise, as well as provide improvements and planning recommendations.
The report utilizes various data sources detailed within the report to created maps of the geographic extent of each hazard over time. Once mapped, the results are scored and weighed in an Excel tool Brizaga developed – the Adaptation Prioritization Exercise or APEx. APEx is designed to help guide capital improvement planning priorities towards assets that are most vulnerable to whichever hazards are identified as most crucial. Utilizing all this information, a final adaptation plan is also presented at the end of this report.
Please don’t hesitate to contact me at (954) 834-3533 or alec@brizaga.com should you have any questions or require additional information.

Sincerely,
Alec Bogdanoff, Ph.D. Principal & Co-Founder
17 Rose Drive Fort Lauderdale, FL 33316 (954) 834-3533
www.brizaga.com

ii South Seas Captiva Island – Vulnerability Assessment and Adaptation Plan
This page is intentionally blank.
South Seas Captiva Island – Vulnerability Assessment and Adaptation Plan iii
1. Multi-Hazard Vulnerability Assessment 1.1 Vulnerability Analysis Overview..............................................................................................1-1 1.1.1 Potential Impact............................................................................................................1-1 1.1.2 Adaptive Capacity 1-2 1.1.3 Vulnerability 1-2 1.2 Hazard Impact Analysis ..........................................................................................................1-3 1.2.1. Flooding Based Hazards 1-3 1.2.1.1 Storm Surge.......................................................................................................1-5 1.2.1.2 Tidal Flooding 1-7 1.2.1.3 Precipitation 1-8 1.2.2 Non-Flooding Based Hazards....................................................................................1-10 1.2.2.1 Beach Erosion 1-10 1.2.2.2 Extreme Wind...................................................................................................1-11 1.2.2.3 Water Quality 1-12 2. Asset Vulnerability 2.1. Adaptive Capacity ..................................................................................................................2-1 2.2. Findings..................................................................................................................................2-1 2.2.1 Storm Surge Vulnerability.............................................................................................2-2 2.2.2 Tidal Flooding Vulnerability ..........................................................................................2-6 2.2.3 Precipitation Vulnerability 2-7 2.2.4 Extreme Wind Vulnerability 2-8 2.2.5 Beach Erosion Vulnerability..........................................................................................2-9 3. Asset Prioritization 3.1 Adaptation Prioritization Exercise (APEx) ..............................................................................3-1 3.2 APEx Structure 3-1 3.2.1 APEx Home 3-1 3.2.2 Asset Sheet...................................................................................................................3-1 3.2.3 APEx Calculator 3-2 3.2.4 Criticality .......................................................................................................................3-2 3.2.4.1 Physical Criticality 3-2 3.2.4.2 Economic Criticality 3-3 3.2.4.3 Environmental Criticality ....................................................................................3-3 3.2.5 Stakeholder Engagement.............................................................................................3-3 3.2.6 Weighting and Results 3-3 3.2.7 Final Ranking................................................................................................................3-4 3.2.8 Notes 3-5 3.3 Asset Priorities 3-5 4. Adaptation Plan 4.1 Adaptation Strategies 4-1 4.1.1 Local Regulations.........................................................................................................4-1 4.1.1.1 Zoning Codes 4-1 4.1.1.2 Green Infrastructure Policies 4-1 4.1.2 Infrastructure Projects...................................................................................................4-2 4.1.2.1 Road Raising 4-2
Table of Contents
iv South Seas Captiva Island – Vulnerability Assessment and Adaptation Plan 4.1.2.2 Utility Plan ..........................................................................................................4-2 4.1.3 Funding Opportunities 4-2 4.2 Potential Adaptation Projects 4-3 4.2.1 Living Shoreline Installation..........................................................................................4-3 4.2.2 Roadway Elevation and/or Stormwater Improvements 4-4 4.2.3 Sewer System Expansion and Hardening....................................................................4-4 4.2.4 Sustainable Actions......................................................................................................4-5 Appendices Storm Surge Inundation Maps Appendix A Roadway Segment Divisions Appendix B Tidal Flooding Inundation Maps Appendix C Precipitation Inundation Maps..........................................................................................Appendix D
Part 1
Multi-Hazard Vulnerability Assessment
1-0 South Seas Captiva Island – Vulnerability Assessment and Adaptation Plan
Multi-Hazard Vulnerability Assessment
This page is intentionally blank.
1.1 Vulnerability Analysis Overview
Brizaga performed a comprehensive multi-hazard Vulnerability Assessment for Captiva Island, identifying all privately owned and publicly owned building structures and major access roadways on the island as assets. This assessment was performed in compliance with the Resilient Florida Grant Program, detailed in s.380.093,Florida Statutes and supplementary guidance and rulemakingpublished by the Department of Environmental Protection. This section of the report provides an overview of the concepts explored as part of a Vulnerability Assessment.
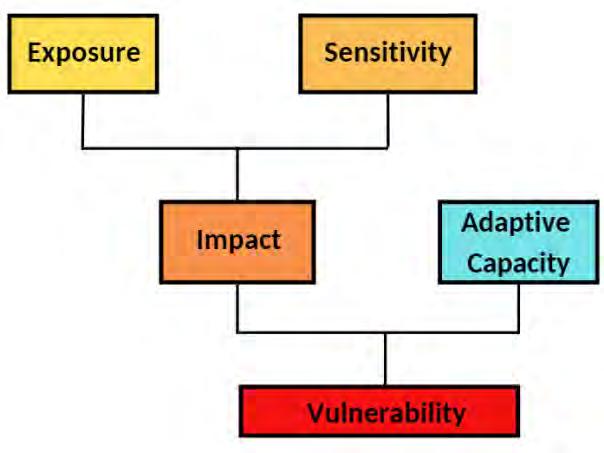
Vulnerability describes the susceptibility of exposed assets based on two core concepts: (1) potential impact the degree to which an asset is affected; and (2) adaptive capacity the ability an asset has to cope with a potential impact.
1.1.1 POTENTIAL IMPACT
Potential impact is the degree to which an exposed asset (an asset that is in harm’s way) may be negatively affected by a climate-related hazard and is a combination of exposure and sensitivity.The U.S. Climate Resilience Toolkit defines exposure as “the presence of people, assets, and ecosystems in places where they could be adversely affected by hazards.”1 For purposes of this assessment, exposure specifically means that an asset (e.g., a structure, parcel, or roadway) is spatially coincident with a specific hazard (e.g., storm surge). For example, a property located within a potential storm surge zone is considered to be exposed to the storm surge hazard. Assets that are not directly exposed to a hazard experience no direct impact; thus, they are not directly vulnerable. Assets that have no direct exposure, however, may be subject to secondary or tertiary vulnerabilities based upon their relationships to or dependencies on other affected assets.
Sensitivity can be described as how susceptible a given asset is to a specific hazard1 when exposed. As an example, a structure built within an area susceptible to flooding, but elevated above the flood stage has a very low sensitivity to a flooding hazard. Similarly, a structure built to withstand 175-mph winds may still be exposed to hurricane winds but is much less sensitive than a structure built prior to the implementation of the Florida Building Code.
Multi-Hazard Vulnerability Assessment South Seas Captiva Island – Vulnerability Assessment and Adaptation Plan 1-1
Figure 1-1. Vulnerability as defined by the U.S. Climate Resilience Toolkit1
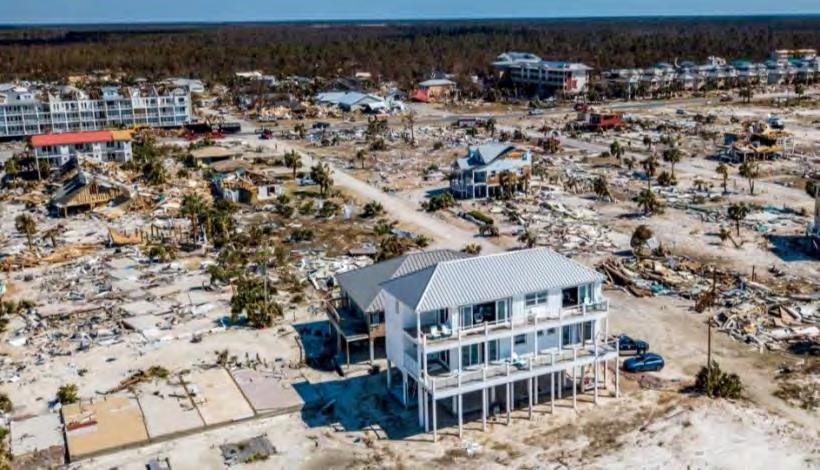
As demonstrated above,during hurricane Michael in 2018, Mexico Beach was leveled by intense flooding and winds. Most properties were destroyed however a few properties stood mostly undamaged. The exposure of these buildings was the same as the ones that were destroyed however their sensitivity was much lower due to stronger materials, higher finished floor elevations, more engineering, etc. This is a real-life example of the importance of properly quantifying vulnerability. Structures will not respond to hazards the same way even if their exposures are identical.
1.1.2 ADAPTIVE CAPACITY
Adaptive capacity is defined as “the ability of a person, asset, or system to adjust to a hazard, take advantage of new opportunities, or cope with change.”1 Identifying adaptive capacity of an asset is a highly subjective exercise that requires a detailed analysis of an asset’s specific attributes, many of which may not be publicly available. For the purposes of this analysis, assets were generalized as having low, medium, or high adaptive capacity based upon specific land use. This determination was made based upon the general ability to make improvements to assets to mitigate the impacts of a hazard based on several factors including feasibility and cost. Assumptions about land use types and their adaptive capacities are based primarily on the size of the asset class as well as the cost and duration of associated projects.
1.1.3 VULNERABILITY
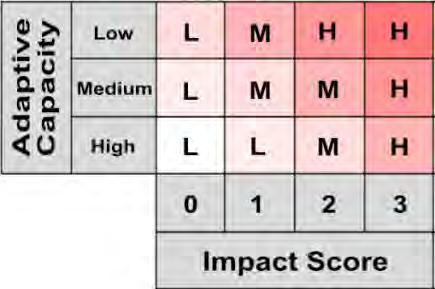
The combination of potential impact and adaptive capacity yields vulnerability, which is described as the propensity of assets to be adversely affected by hazards.1 To illustrate the vulnerability of assets, the identified potential impacts are simplified into bins encompassing the total range of impacts. This is combined with adaptive capacity in a matrix. Assets with no potential impact and high adaptive capacity are considered the least vulnerable. Assets with the greatest potential impact and low adaptive capacity are considered the most vulnerable.
Multi-Hazard Vulnerability Assessment 1-2 South Seas Captiva Island – Vulnerability Assessment and Adaptation Plan
Figure 1-2. Buildings still standing in Mexico Beach after Hurricane Michael, 2018, picture courtesy of the New York Times2 (Mazzei, 2018)
Figure 1-3. Vulnerability scoring matrix.
1.2 Hazard Impact Analysis
Six (6) unique hazards were evaluated for Captiva Island. These include:
1. Storm Surge
2. Tidal Flooding
3. Precipitation
4. Beach Erosion
5. Extreme Winds
6. Water Quality
These hazards were analyzed independent of one another across different time and intensity scales.
This section describes each hazard and the methodologies utilized to determine the potential impacts of assets. All ground elevations for use in hazard analyses were based on the digital elevation model (DEM) created as part of the 2018 Lee County Light Detection and Ranging (LiDAR) Survey. This data was obtained via the National Oceanographic and Atmospheric Administration (NOAA) Data Access Viewer.3
1.2.1 FLOODING BASED HAZARDS
Of the hazards studied, three (3) hazards are flooding-based. These include precipitation, tidal flooding, and storm surge. To understand the reach and severity of these hazards, a geodatabase was created utilizing ArcGIS, a Geographic Information System.
To assure compliance with s. 380.093, Florida Statutes, as well as to understand changes in vulnerability with time, potential flooding impacts and vulnerabilities must be evaluated at various timescales. To address this, various local sea level rise projections were included.
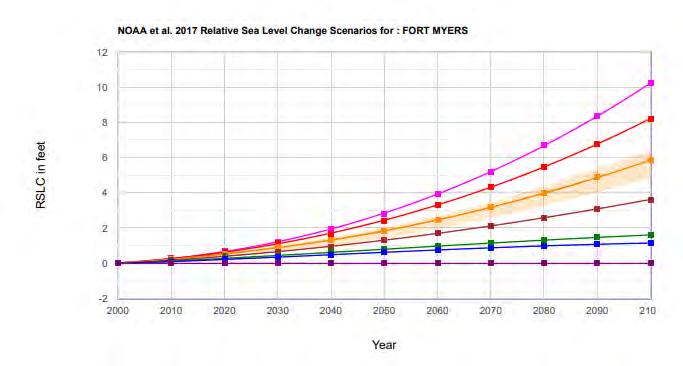
Sea level rise planning curves examine historical data and provide future sea level projections based upon various global carbon dioxide emissions scenarios. The various agencies providing these projections include the National Oceanic and Atmospheric Administration (NOAA, the curves used here are referred to as the NOAA curves or NOAA 2017 curves) and the U.S. Army Corps of Engineers (USACE, the curves used here are referred to as the USACE curves), among others.
These agencies utilize varying methodologies and have published projections that vary by region and timeline. Each agency provides projections of the changes in mean sea level over time associated with different emission scenarios. These various changes in mean sea level represent baseline conditions, upon which the various flood hazards are applied to understand the increased exposure because of sea level rise.
Multi-Hazard Vulnerability Assessment South Seas Captiva Island – Vulnerability Assessment and Adaptation Plan 1-3
Multi-Hazard Vulnerability Assessment
The five selected scenarios, or baseline conditions, evaluated include:
• Current sea level (2022)
• NOAA Intermediate-Low Sea Level projection in the year 2040
• NOAA Intermediate-High Sea Level projection in the year 2040
• NOAA Intermediate-Low Sea Level projection in the year 2070
• NOAA Intermediate-High Sea Level projection in the year 2070
The USACESea Level Change Curve Calculator was utilized to identify projected sea levels at the project location.4 This calculator applies NOAA 2017 sea level rise projections to localized oceanographic conditions to obtain unique, locally applicable changes in sea level.
Relative sea level increases for the selected scenarios of the USACE sea level change calculator for the Ft. Myers region are as follows:
Relative Sea Level Rise (Inches above 2020 MSL)
1-4 South Seas Captiva Island – Vulnerability Assessment and Adaptation Plan
Figure 1-4. Relative Sea Level Rise projections of the USACE Sea Level Change Curve Calculator3 for Fort Myers.
2040 2070 NOAA Int. Low 4.4 11.04 NOAA Int. High 9.36 32.28
1.2.1.1 Storm Surge
Data Utilized: Lee County 2018 LiDAR DEM, Lee County Parcel/Building Footprint data, NOAA Seas, Lakes, and Overland Surge from Hurricanes (SLOSH) Model, NOAA Tides and Currents Records NOAA Sea Level Rise Projections derived from USACE data
The single most dangerous hazard facing Captiva Island, storm surge represents the full force that nature can inflict on the built and natural environment alike. When analyzing storm surge, depth of flooding is paramount to compare against the finished floor elevations (FFE) of the island’s assets.
To obtain these storm surge elevations for all category hurricanes for the current year (2022) the outputs of the Seas, Lakes, and Overland Surges from Hurricanes (SLOSH) model published by NOAA were obtained to serve as a baseline condition for flooding. Sea level rise was then added to the flood stage for each storm type based on projected rise, and then calculated depth of flooding. These assumptions indicate that the flood extents and depths illustrated in maps and data tables for storm surge flooding are likely an overestimation of actual expected conditions. This is because the SLOSH data outputs provide estimates of the worst-case scenario for each category of hurricane and is dependent on variables such as forward speed, radius of maximum winds, and angle of approach.
This analysis relied on the NOAA SLOSH Model Maximum of Maximums (MOMs) for each category of hurricane analyzed. The NOAA SLOSH Model is a “numerical model developed by the National Weather Service to estimate storm surge heights resulting from historical, hypothetical, or predicted hurricanes by taking into account the atmospheric pressure, size, forward speed, and track data.” The Maximum of Maximums (MOM) “provides a worst-case snapshot for a particular storm category under ‘perfect’ storm conditions.” Additionally, “no single hurricane will produce the regional flooding depicted in the MOMs. Instead, the product is intended to capture the worst-case high-water value at a particular location.”5
The Maximum of Maximums is the worst-case scenario storm surge associated with each category storm and is not representative of the storm surge that would be associated with the “average” storm. Additionally, evaluation of the return frequencies associated with various storm categories cannot be used to determine the return frequency of the MOM-level storm surge. It is recommended that a study of compound flooding, or the combination of storm surge, tides, heavy rainfall, and sea level rise be performed and utilized to develop return frequencies for flood elevations. This information can be utilized to guide essential policy relative to building and zoning codes, and resource allocation and scheduling relative to infrastructure improvements, retrofits, or replacements.
Exposure: Exposure to storm surge flooding is based on whether an asset is within the spatial flooding extents of a specific storm event. After importing the storm surge model results from SLOSH, still water elevations from different category storms were extracted. Local sea level rise projections were also applied to these elevations. These current and future storm surge elevations were overlayed with the Digital Elevation Model (DEM) for Captiva Island (which represents topographic elevations across the island) to identify storm surge flooding exposure.
Sensitivity: Sensitivity to storm surge flooding was determined based on the likelihood of a flood event causing damage to a building’s interior, requiring an estimation of the finished floor elevation (FFE) of the
Multi-Hazard Vulnerability Assessment South Seas Captiva Island – Vulnerability Assessment and Adaptation Plan 1-5
building. The FFE of a building is the lowest habitable floor elevation, excluding garages and crawlspaces and is a critical piece of information for the purposes of determining flood risk. Aside from the flood zone in which an asset is located, the FFE has historically been the primary component utilized by FEMA when determining flood insurance premiums for communities that participate in the National Flood Insurance Program (NFIP). Captiva has been a NFIP participant since 1984, when the first Flood Insurance Rate Maps (FIRMs) were published for the community. The FIRMs currently in effect were published in 2008.
Finished floor elevations were not available for the assets on Captiva, except for 20 structures within the South Seas property limits. To address this data deficiency, assumptions were made to estimate finished floor elevations:
1. Any structure within the 100-year floodplain built since the publication of the effective FIRM (2008) has a FFE one foot above the base flood elevation (BFE), which is consistent with Florida Building Code.
2. Any structure outside of the 100-year floodplain built after the publication of the effective FIRM (2008) published by FEMA has a FFE of six inches above the ground elevation at that location.
3. Any structure built since the publication of the first FIRM for the community (1984) but prior to the effective FIRM (2008), has a FFE equal to the lowest BFE represented on the FIRM published in 1984 for the developed areas of Captiva (10 feet NGVD29).
4. Any structure built prior to the publication of the first FIRM for the community (1984) has a FFE of six inches above the ground at that location.
Due to the coastal nature of Captiva Island and its location within the evacuation zone A, roadways were omitted from the storm surge vulnerability analysis. According to Lee County Emergency Management, evacuation decision making is tied to storm surge. When the threat of three feet of storm surge equals or exceeds a 60% probability, the order to evacuate from Zone A will be issued. While it is expected that roadways will flood during storm surge events, it is also expected that Captiva Island will have been evacuated. As such, roadway accessibility will not be required during such events, and roadway segments have therefore been omitted from the storm surge portion of the vulnerability analysis.
Impact Scores: Using the results from the exposure mapping and sensitivity analysis, depth of flooding above the FFE was calculated for each structure during each storm surge scenario (Tropical Storm, Category 1 through 5) and sea level rise projection, for a total of 30 combinations. Impact Scores were developed to simplify the range of impacts and more effectively communicate the severity of the anticipated level of flooding. Impact scores were calculated for each asset based on the following scale:
1-6 South Seas Captiva Island – Vulnerability Assessment and Adaptation Plan
Multi-Hazard Vulnerability Assessment
Storm Surge Impact Score Description 0 No flooding above FFE
Flooding above FFE less than or equal to 1 foot
Flooding above FFE less than or equal to 4 feet
Flooding above FFE greater than 4 feet
1
2
3
Maps illustrating storm surge extents can be found in Appendix A.
1.2.1.2 Tidal Flooding
Data Utilized: Lee County 2018 LiDAR DEM, Lee County Parcel/Building Footprint data, NOAA Tides and Currents records, NOAA Sea Level Rise Projections derived from USACE
The impacts of tidal flooding at a given location can be expected well before Mean Sea Level (MSL) or even Mean Higher High Water (MHHW) reaches the elevation of that location. The Resilient Florida Grant Program (380.093) currently requires all vulnerability assessments to calculate the depth of “Tidal flooding, including future high tide flooding, which must use thresholds published and provided by the department. To the extent practicable, the analysis should also geographically display the number of tidal flood days expected for each scenario and planning horizon.”6
In accordance with these requirements, Brizaga evaluated and mapped the frequency and severity of annual tidal flooding across Captiva Island. Tidal data was obtained from the NOAA tidal station in Ft. Myers via NOAA Tides and Currents7 (A record of sea level trends over time recorded by NOAA tidal gauges). From this station, all quality tidal data measuring high tide and low tide elevations between January 1, 2012, and December 31, 2021, was extracted. The initial data analysis showed that there were 3,059 higher-high tide events during the study period. Using this information, an empirical cumulative density function was developed to show the likelihood of tide water’s reaching a given elevation.
Exposure: An asset is considered to be exposed to tidal flooding if the greater than two (2) percent of high tide events are expected to cause flooding within a 5-foot buffer of the building footprint The USACE sea level change projections were added to these elevations to evaluate the future tidal flooding reach. Flood levels were overlayed with the Digital Elevation Model (DEM) to identify tidal flooding exposure.
Sensitivity: As the nature of tidal flooding is predictable and at a low elevation relative to building structure floor elevations, the first impact experienced is generally due to limited accessibility, as roadways may be the first asset expected to flood. As flooding of a roadway will have an impact on all assets relying on that roadway, impacts to building access can be expected to occur long before interior flooding and damage of structures. Therefore, sensitivity for tidal flooding has been considered to be uniform across all assets.
Impact Scores: Using the results from the exposure mapping and sensitivity analysis, the number of days of flooding expected because of high tide events were calculated for each structure and sea level rise projection, for a total of five (5) combinations. Impact Scores were developed to simplify the range of impacts and more effectively communicate the severity of the anticipated level of flooding. Impact scores calculated for each asset based on the following scale:
Multi-Hazard Vulnerability Assessment South Seas Captiva Island – Vulnerability Assessment and Adaptation Plan 1-7
Tidal Flooding Impact Score Description 0 0 Days of tidal flooding 1 1-15 Days of tidal flooding 2 16-30 Days of tidal flooding 3 31+ Days of tidal flooding
Maps illustrating roadway segment divisions can be found in Appendix B. Maps illustrating tidal flooding extents can be found in Map Appendix C
1.2.1.3 Precipitation
Data Utilized: Lee County 2018 LiDAR DEM, Lee County Parcel/Building Footprint data, NOAA Atlas 14, NOAA Sea Level Rise Projections derived from USACE
When considering precipitation as a hazard, it is important to remember that its danger arises from the inability ofprecipitation to either be absorbed by permeable surfaces or efficiently collected by stormwater infrastructure, creating localized flooding in low spots. As roadways generally provide the greatest coverage of impermeable surfaces, they are often accompanied by the most robust stormwater management infrastructure. When this infrastructure is overstressed due to excessive rainfall or high background water level (sea level), water cannot drain properly, and flooding occurs along the roadway. Get This limits access to assets that rely on that roadway, and when the flooding is severe enough, may prevent the passage of emergency vehicles.
Stormwater management engineering typically includes specific knowledge of the locations, sizes, and elevations of stormwater infrastructure, as well as the utilization of numerical modeling techniques. While this was not possible within this project an alternative method of analysis was created. It was determined that flooding exposure under varying precipitation and sea level rise scenarios could be extrapolated on the basis that the built stormwater infrastructure had reached its capacity, and additional precipitation would simply cause more widespread flooding. The degree to which the level of flooding increases was based on the amount of additional rainfall and the change in background water levels (sea level). In order for this method to be feasible a baseline storm would be needed that was confirmed to cause a measured amount of flooding.
On June 4th, 2022, such a storm event hit Captiva Island, which was recorded and documented through photographs and videos. According to Lee County data, a total of 7.86 inches of rain fell on this date at the nearby Bowman’s Beach station. Based on NOAA Atlas 148 which provides specific rainfall amounts for storms of variable intensity, duration, and frequency, it was estimated that the June 4th storm fell within the 90% confidence interval of a 25-year, 24-hour storm. Utilizing the photos and videos, a baseline calculation was conducted to estimate the total volume of precipitation that fell within the Captiva Island bounds, as well as estimates for the volume of runoff and volume of stormwater retained within the flooded areas.
It was assumed that the June 4th storm event caused the existing stormwater system to reach capacity. Therefore, any rain event of greater intensity or duration would also be considered to cause the stormwater system to reach capacity with additional runoff. The anticipated flooding due to these rain events were calculated by comparing the differential rainfall volume with the local topography. This conservatively assumed that all excess runoff was contained as flooding. This analysis was performed for the 25-year 24-hour storm, and the 100-year 24-hour storm for the current year (2022).
Exposure: Sea level projections were applied to the 25-year and 100-year, 24-hour storms to determine the additional flooding that could be expected in the future as a result of reduced capacity of stormwater systems and reduced discharge rates caused by higher background water levels. These current and
Multi-Hazard Vulnerability Assessment 1-8 South Seas Captiva Island – Vulnerability Assessment and Adaptation Plan
future precipitation flooding extents were overlayed with the Digital Elevation Model (DEM) to identify precipitation exposure. An asset is considered to be exposed to precipitation if the flooding extents caused by rainfall reach the perimeter of the building.
Sensitivity: Like storm surge, the sensitivity of an asset was determined based on the likelihood of a flood event causing damage to a building’s interior. Finished floor elevations as determined through the storm surge analysis were utilized for this exercise.
Roadway segments were also evaluated for sensitivity. Roadways are highly sensitive to precipitation, as the smallest amount of ponding can create significant hazards. Because of the residential nature of Captiva Island and the low-speed limits throughout the community, roadway ponding or flooding creates a nuisance in small depths, but limits accessibility as depth increases.
ImpactScores: Floodingabove the FFEwas calculated for each structure at each sea level rise projection for both the projected 25-year 24 hour and 100-year 24-hour storms. Impact scores were assigned to each asset based on comparing flooding between the differing storms, scenarios, and FFE’s in the following scale:
Precipitation Impact Score (Buildings) Description
0 Unaffected by precipitation-based flooding entirely
1 Flooding during a 100 year storm is experienced but the elevation is below the FFE
2 Flooding during a 100 year storm is experienced above the FFE but during a 25 year storm the flooding elevation is still below the FFE
3 Flooding during a 25 year storm is above the FFE
The maximum flood elevation during a 25-year storm was calculated on each segment of road. To gauge how serious flooding is on an asset like a roadway, one must consider fording depths of emergency vehicles. Fording depths are the deepest amounts of water vehicles can drive through safely. For a vehicle like an ambulance,the fordingdepth is typically at least 8 inches. Knowingthis depth, we assigned impact scores to every road segment based on the following scale:
Precipitation Impact Score
(Roadways) Description
0 Unaffected by precipitation-based flooding during a 25year storm scenario
1 Flooding during a 25-year storm is experienced but the flood elevation is less than or equal to 0.33 feet
2 Flooding during a 25-year storm is experienced but the flooding elevation is less than or equal to 0.67 feet
3 Flooding during a 25-year storm is experienced and the flooding elevation is greater than 0.67 feet
Maps illustrating precipitation flooding extents can be found in Appendix D
Multi-Hazard Vulnerability Assessment South Seas Captiva Island – Vulnerability Assessment and Adaptation Plan 1-9
1.2.2 NON-FLOODING BASED HAZARDS
Three hazards not rooted in flooding were also analyzed: beach erosion, extreme wind, and water quality. To study these hazards data from the Lee County Property Appraiser and the Florida Department of Environmental Protection (FDEP) was evaluated along with previous water quality reports and supplemental data from the Sanibel-Captiva Conservation Foundation (SCCF). While these hazards are not required for evaluation under 380.093 Florida Statutes, they serve to illustrate the economic and ecologic risks to the island. These hazards must be considered for Captiva to retain its long-term viability as a beach vacation destination.
1.2.2.1 Beach Erosion
Data Utilized: Lee County Parcel/Building Footprint data, Florida DEP Historic Beach Profile Data
Beach erosion is a significant hazard facing every barrier island community because of two factors. The first is that it serves as a multiplier for hazards like storm surge and tidal flooding. Beaches are protective landforms,servingas the first defense againstwave runup.Areduction in their width and sediment lowers those defenses allowing waves to encroach further inland. The second factor is its damaging effects on the local economy. Captiva island’s local economy is largely based on tourism and recreation centered around its beaches. If those beaches disappear it could massively reduce both local business potential as well as property values.
To quantify which properties were exposed to beach erosion, beach erosion rates were utilized to create ranges of shoreline position change for each Florida Department of Environmental Protection (DEP) RMonument located on Captiva Island. These R-Monuments are utilized by Land Surveyors and Coastal Engineers to measure the beach topography in determining and monitoring erosional or accretional trends, and to coordinate mapping of beach restoration project boundaries. For the purposes of this analysis, it was generally considered that a greater range of shoreline position change is indicative of a more dynamic coastal area with increased exposure.
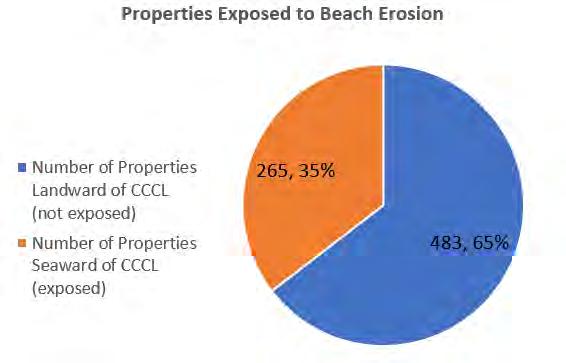
Exposure: The Coastal Construction Control Line (CCCL) was examined to determine which assets were especially exposed to beach erosion. Created by the DEP, “The CCCL Program regulates structures and activities that can cause beach erosion, destabilize dunes, damage upland properties or interfere with public access.”9 Assets were identified as being located either seaward or landward of the CCCL. Those that were landward were not considered to be exposed to beach erosion. The total percentage of assets deemed not exposed to beach erosion due to being landward of the CCCL can be seen in the graph adjacent. All seaward properties were considered to be exposed based on the range of shoreline change at the nearest R-monument.
Multi-Hazard Vulnerability Assessment 1-10 South Seas Captiva Island – Vulnerability Assessment and Adaptation Plan
Figure 1-5. Number of properties either seaward or landward of the CCCL on Captiva Island
Sensitivity: Even through some assets have been identified as being located seaward of the CCCL, all building structures on Captiva Island have been physically constructed landward of the beach-dune system. Therefore, all structures were considered equally sensitive to beach erosion.
Impact Scores: Impact scores were based on position in relation to the CCCL as well as how dynamic the observed historic shoreline change was as the nearest R-Monument. These impact scores are as follows:
0 Landward of the CCL
1 Seaward of the CCL and shoreline position range is less than 40 feet
2 3
1.2.2.2 Extreme Wind
Seaward of the CCL and shoreline position range is less than 100 feet
Seaward of the CCL and shoreline position range is greater than 100 feet
Data Utilized: Lee County Parcel/Building Footprint data
Exposure: On an island like Captiva, where elevation is relatively uniform, hazards like extreme wind can be assumed to have a uniform rate of exposure on assets. There are no large landforms or extreme highpoints putting any one property at a much higher risk of experiencing winds over another.
Sensitivity: However, the sensitivity, or the unique structural aspects, of a given asset can vary greatly impacting overall vulnerability. The most readily available structural information includes the building height, and the year the building was constructed. Taller buildings are more susceptible to extreme wind loads. Older buildings are expected only to comply with building codes that were in effect at the time they were constructed. The Florida Building Code underwent significant improvements regarding wind protections in 2002. Because of this, 2002 was utilized as a threshold in evaluating sensitivity to wind.
Impact Scores: Since all assets are exposed to wind, it was determined that no assets can have an impact score of zero (0). The wind vulnerability scale considers building height and effective codes as follows:
Multi-Hazard Vulnerability Assessment South Seas Captiva Island – Vulnerability Assessment and Adaptation Plan 1-11
Beach Erosion Impact Score Description
Wind Impact Score Description 0 No wind exposure
Built after 2002
2 stories or below, built prior to 2002
3 or 4 stories, built prior to 2002
1
2
3
1.2.2.3 Water Quality
Data Utilized: 2011 Sanibel-Captiva Conservation Foundation Captiva Water Quality Assessment and Supplemental Data
Environmental health is central to the vibrancy and longevity of Captiva Island. Captiva’s local economy relies on tourism, and so water quality is of great importance to maintaining its character as an idyllic seaside community. Due to the universal nature posed by water quality hazards across the island, exposure and sensitivity can be applied uniformly across all assets.
According to the Florida Department of Environmental Protection (DEP), Captiva is surrounded by impaired water bodies. This means that the waters surrounding Captiva do not meet applicable water quality standards.
On the estuary side of the island are Upper and Lower Pine Island sound. Both are considered impaired or not usable for recreational use, due in part to the high nitrogen and Chlorophyll a concentrations found within the water bodies. Together, the high concentrations of nitrogen and Chlorophyll a are a primary cause of excessive algae growth.
It is important to contextualize Captiva’s location on Florida’s West Coast before delving into the specific contributions by the island community. The Upper and Lower Pine Island Sound are directly connected to the Caloosahatchee River. The River transports a large amount of nutrients from Lake Okeechobee to this area. The 2011 Sanibel-Captiva Conservation Foundation (SCCF) Captiva Water Quality Assessment Project Final Report10 explored how discharge from the Caloosahatchee River influenced water quality around Captiva.
Within SCCF’s report, it was discovered that concentrations of overabundant nutrients all decreased as distance from the river increased. Thereby, the river was proven to be a large source of the sound’s eutrophication issues. With an understanding that the source of the high nutrients is the Caloosahatchee River, solutions to the issue need to be approached in a coordinated regional manner. If the multitude of governing bodies presiding over all these waters don’t come together to address these issues, then the high amounts of nutrients can lead to algal blooms, red tides, etc.
In addition to these nutrients, low water quality was often caused by elevated levels of bacteria. Results from the first year of SCCF’s research demonstrated that the study area “had elevated levels of the Enterococcus indicator bacteria after rainfall events, especially on the estuary side of Captiva and Northern Sanibel. ‘Poor’ results for indicator bacteria occurred proximate to stormwater outfalls, around resorts and residential-golf course developments, and where rainwater runoff volumes were the greatest.”10 Simply, areas where large run off occur are directly related to impaired water quality. Reducing runoff is an important strategy for improving water quality. This type of bacteria is dangerous to organic life because it indicates the presence of (typically) human waste in the local water systems, which can cause disease and sickness after exposure or ingestion.
High amounts of Enterococcus bacteria and nitrogen in surface waters were found to be directly linked to large rainfall events, especially in specific locations such as areas that were not connected to sewer systems. According to the authors of the SCCF report, “[t]otal nitrogen input from Captiva based upon
Multi-Hazard Vulnerability Assessment 1-12 South Seas Captiva Island – Vulnerability Assessment and Adaptation Plan
septic tank loading and runoff is estimated to be 4,344 kg/year of which 36% originates from septic systems and 64% can be attributed to stormwater and irrigation runoff.”10 This means that over a third of all nitrogen from Captiva Island is coming from septic systems alone. Since the authors attributed most bacteria to stormwater runoff, again, reducing runoff is one of the biggest, if not the biggest path, to improving water quality on and around Captiva Island.
These reports demonstrated the importance of how specific actions can improve water quality, including improved stormwater filtration and pre-treatment, and convertingfrom septic systems and package plants with drain fields to a central sewer system. These two strategies should be considered as part of any new construction or substantial improvement project within Captiva. Furthermore, any flood mitigation or adaptation project pursued is recommended to include provisions for employing these strategies, through
1 U.S. Climate Resilience Toolkit Glossary, Available at: https://toolkit.climate.gov/content/glossary#Vulnerability
2 Mazzei, Patricia. “Among the Ruins of Mexico Beach Stands One House, Built ‘for the Big One’”. The New York Times, October 14, 2018, https://www.nytimes.com/2018/10/14/us/hurricane-michael-florida-mexico-beachhouse.html
3 National Oceanographic and Atmospheric Administration (NOAA) Data Access Viewer, available at: https://coast.noaa.gov/dataviewer/#/
4 Army Corps of Engineers Sea Level Rise Calculator, Available at: https://cwbiapp.sec.usace.army.mil/rccslc/slcc_calc.html
5 NOAA SLOSH. Available at: https://www.nhc.noaa.gov/surge/slosh.php
6 The Resilient Florida Grant Program, Florida statute 380.093, available at: http://www.leg.state.fl.us/statutes/index.cfm?App_mode=Display_Statute&Search_String=&URL=03000399/0380/Sections/0380.093.html
7 NOAA Tides and Currents, Available from: https://tidesandcurrents.noaa.gov/
8 NOAA Atlas 14, available from: https://hdsc.nws.noaa.gov/hdsc/pfds/pfds_map_cont.html
9 Florida DEP CCCL program, Available at: https://floridadep.gov/CCCL
10 2011 Sanibel-Captiva Conservation Foundation Captiva Water Quality Assessment Project Final Report, available from: https://www.sccf.org/downloadable-files/58dbbd5acae5c4c46115fa13.pdf
Multi-Hazard Vulnerability Assessment South Seas Captiva Island – Vulnerability Assessment and Adaptation Plan 1-13
1-14 South Seas Captiva Island – Vulnerability Assessment and Adaptation Plan
Multi-Hazard Vulnerability Assessment
This page is intentionally blank.
Part 2
Asset Vulnerability
Asset Vulnerability 2-0 South Seas Captiva Island – Vulnerability Assessment and Adaptation Plan
This page is intentionally blank.
2.1. Adaptive Capacity
When analyzing the vulnerability of any asset it is imperative to quantify its adaptive capacity. Adaptive capacity is needed to properly consider the potential an asset has to make structural changes that make will make itless vulnerable. While approachinga projectsuch as this where analysis was beingperformed on a scale of hundreds of assets a system was needed to generalize adaptive capacities so vulnerability scores could be accurately determined. It was discovered that Lee County property records provide Department of Revenue (DOR) codes, each of which specify a unique use. The five most common uses on Captiva Island include:
• Single Family Residential
• Multi-Family Less than 10
• Residential Common Elements/Areas
• Hotels, Motels
• Condominium
It was decided that by assigning general adaptive capacity scores to each DOR code, the GIS files from Lee County containing parcels with these codes could be used to quickly assign every asset an individual adaptive capacity. Once this was completed it was just a matter of developing a method mathematically to combine the two into a final score.
2.2. Findings
Vulnerability is analyzed as a combination of the potential impact a hazard may have on an asset and the asset’s adaptive capacity. The figures on the next pages illustrate graphically the number of assets vulnerable to storm surge by grouping them by impact score and adaptive capacity category (low, medium, high). The most vulnerable assets will have the highest impact score and the lowest adaptive capacity, and the least vulnerable assets will have the lowest impact score and the highest adaptive capacity.
Due to the subjective nature of adaptive capacity, it is helpful not only to examine the changes in vulnerability of assets with time, but also the changes in impact to assets. For example, the number of assets most vulnerable to storm surge increases from 14 to 156 for a tropical storm between 2022 and 2070 with the NOAA intermediate-high storm surge projection. For the same storm scenario and time period, the number of assets with an impact score of 3 increases from 29 to 341. This is an indication that the expected impact of a Tropical Storm event can be expected to grow significantly with sea level rise.
Asset Vulnerability South Seas Captiva Island – Vulnerability Assessment and Adaptation Plan 2-1
2.2.1. STORM SURGE VULNERABILITY
Number of Assets Vulnerable to StormSurge (Tropical Storm, 2022)
Number of Assets Vulnerable to StormSurge (Category 1 Hurricane, 2022) AdaptiveCapacity
Impact Score
Number of Assets Vulnerable to StormSurge (Tropical Storm, 2040, NOAAInt-Low) AdaptiveCapacity
Impact Score
Number of Assets Vulnerable to StormSurge (Tropical Storm, 2040, NOAAInt-High)
Impact Score
Number of Assets Vulnerable to StormSurge (Category 1 Hurricane, 2040, NOAAInt-Low) AdaptiveCapacity Impact Score
Number of Assets Vulnerable to StormSurge (Category 1 Hurricane, 2040, NOAAInt-High)
Number of Assets Vulnerable to StormSurge (Tropical Storm, 2070, NOAAInt-Low) AdaptiveCapacity
Number of Assets Vulnerable to StormSurge (Category 1 Hurricane, 2070, NOAAInt-Low)
Impact Score
Number of Assets Vulnerable to StormSurge (Tropical Storm, 2070, NOAAInt-High) AdaptiveCapacity
Impact Score
Number of Assets Vulnerable to StormSurge (Category 1 Hurricane, 2070, NOAAInt-High)
Asset Vulnerability 2-2 South Seas Captiva Island – Vulnerability Assessment and Adaptation Plan
01230123
Figure 2-1. Storm surge vulnerability tables illustrating number of assets (building structures) on Captiva Island within each vulnerability class
Low204714414Low187849125Low Medium1632017515Medium1372086130Medium High2130High2013High1014
High2031High2013High1014 01230123
Low200712042Low186637140Low Medium1591815937Medium1321969153Medium
01230123
Low19599174Low1761227154Low Medium1521413869Medium984261172Medium5 High2022High2013High1014
01230123
Low192127689Low1513627155Low Medium1501413079Medium934657177Medium4 High2013High1012High1014
01230123 AdaptiveCapacity Number
AdaptiveCapacity
AdaptiveCapacity
AdaptiveCapacity
AdaptiveCapacity AdaptiveCapacity Impact Score Impact
Low4414326156Low331166169Low Medium2910854182Medium182141212Medium01 High1113High1014High0105
of (Category
Number of (Category Number of (Category
Number of (Category
Number of (Category
Score
AdaptiveCapacity Impact
Score
AdaptiveCapacity Impact Score
AdaptiveCapacity
AdaptiveCapacity
StormSurge 2022)
Number of Assets Vulnerable to StormSurge (Category 2 Hurricane, 2022)
AdaptiveCapacity
Score StormSurge Int-Low)
Number of Assets Vulnerable to StormSurge (Category 3 Hurricane, 2022)
AdaptiveCapacity
Impact Score
Number of Assets Vulnerable to StormSurge (Category 2 Hurricane, 2040, NOAAInt-Low) AdaptiveCapacity
Score
StormSurge Int-High)
Impact Score
Number of Assets Vulnerable to StormSurge (Category 3 Hurricane, 2040, NOAAInt-Low)
AdaptiveCapacity
Impact Score
Number of Assets Vulnerable to StormSurge (Category 2 Hurricane, 2040, NOAAInt-High)
AdaptiveCapacity
Score StormSurge Int-Low)
Score StormSurge Int-High)
Impact Score
Number of Assets Vulnerable to StormSurge (Category 3 Hurricane, 2040, NOAAInt-High)
Impact Score
Number of Assets Vulnerable to StormSurge (Category 2 Hurricane, 2070, NOAAInt-Low)
Number of Assets Vulnerable to StormSurge (Category 3 Hurricane, 2070, NOAAInt-Low) AdaptiveCapacity
Impact Score
Number of Assets Vulnerable to StormSurge (Category 2 Hurricane, 2070, NOAAInt-High)
AdaptiveCapacity
Score
Number of Assets Vulnerable to StormSurge (Category 3 Hurricane, 2070, NOAAInt-High)
Figure 2-1, continued. Storm surge vulnerability tables illustrating number of assets (building structures) on Captiva Island within each vulnerability class
Seas Captiva Island – Vulnerability Assessment and Adaptation Plan
2-3
Asset Vulnerability South
49125Low2310156180Low0231336 1372086130Medium162128227Medium0117355 High2013High1014High0105 012301230123 37140Low2310154182Low0030339 1321969153Medium161120236Medium0116356 High2013High1014High0105 012301230123 1761227154Low719160183Low0023346 984261172Medium512115241Medium0016357 High2013High1014High0015 012301230123 1513627155Low617163183Low0023346 934657177Medium412112245Medium0016357 High1012High1014High0015 012301230123 166169Low0231336Low002367 141212Medium0117355Medium001372 High1014High0105High0015 012301230123 Impact Score
Impact Score
AdaptiveCapacity
Impact Score
AdaptiveCapacity
Impact
Score AdaptiveCapacity
Number of Assets Vulnerable to StormSurge (Tropical Storm, 2022) Number of Assets Vulnerable to StormSurge (Category 1 Hurricane, 2022)
AdaptiveCapacityAdaptiveCapacityAdaptiveCapacity
to StormSurge (Tropical Storm, 2040, NOAAInt-Low)
of Assets Vulnerable to StormSurge (Tropical Storm, 2040, NOAAInt-High)
AdaptiveCapacityAdaptiveCapacityAdaptiveCapacity
2-4 South Seas Captiva Island – Vulnerability Assessment and Adaptation Plan
Asset Vulnerability
Low0120Low0021 Medium124240Medium831514 High0000High0000 01230123 Low0120Low0021 Medium114232Medium831118 High0000High0000 01230123 Low0030Low0012 Medium102226Medium531319 High0000High0000 01230123 Low0030Low0012 Medium102199Medium441121 High0000High0000 01230123 Low0012Low0003 Medium441022Medium21829 High0000High0000 01230123 Impact ScoreImpact Score
Figure 2-2. Storm surge vulnerability tables illustrating number of assets (building structures) owned by South Seas.
Number of Assets
Hurricane,
Number (Category Impact ScoreImpact Score
Number of Assets Vulnerable to StormSurge (Tropical Storm, 2070, NOAAInt-High)
Vulnerable to StormSurge (Category 1
2070, NOAAInt-High)
Number of Assets
Hurricane,
Int-Low) Number (Category Impact ScoreImpact Score
Number
Number
Number (Category Impact ScoreImpact Score
AdaptiveCapacityAdaptiveCapacityAdaptiveCapacity Number of Assets Vulnerable to StormSurge (Tropical Storm, 2070, NOAAInt-Low)
Vulnerable to StormSurge (Category 1
2070, NOAA
AdaptiveCapacityAdaptiveCapacityAdaptiveCapacity
of Assets Vulnerable to StormSurge (Category 1 Hurricane, 2040, NOAAInt-High)
Number (Category Impact Score
AdaptiveCapacityAdaptiveCapacityAdaptiveCapacity Number of Assets Vulnerable
Number of Assets Vulnerable to StormSurge (Category 1 Hurricane, 2040, NOAAInt-Low)
Impact Score
Number
StormSurgeNumber of Assets Vulnerable to StormSurge (Category 2 Hurricane, 2022)
Number of Assets Vulnerable to StormSurge (Category 3 Hurricane, 2022)
AdaptiveCapacityAdaptiveCapacity
ScoreImpact ScoreImpact Score
StormSurge Int-Low)
Number of Assets Vulnerable to StormSurge (Category 2 Hurricane, 2040, NOAAInt-Low)
Number of Assets Vulnerable to StormSurge (Category 3 Hurricane, 2040, NOAAInt-Low)
AdaptiveCapacityAdaptiveCapacity
ScoreImpact ScoreImpact Score
StormSurge Int-High)
Number of Assets Vulnerable to StormSurge (Category 2 Hurricane, 2040, NOAAInt-High)
Number of Assets Vulnerable to StormSurge (Category 3 Hurricane, 2040, NOAAInt-High)
AdaptiveCapacityAdaptiveCapacity
ScoreImpact ScoreImpact Score
StormSurge Int-Low)
Number of Assets Vulnerable to StormSurge (Category 2 Hurricane, 2070, NOAAInt-Low)
Number of Assets Vulnerable to StormSurge (Category 3 Hurricane, 2070, NOAAInt-Low)
AdaptiveCapacityAdaptiveCapacity
StormSurge Int-High) Number of Assets Vulnerable to StormSurge (Category 2 Hurricane, 2070, NOAAInt-High)
Number of Assets Vulnerable to StormSurge (Category 3 Hurricane, 2070, NOAAInt-High)
AdaptiveCapacityAdaptiveCapacity
Figure
South Seas Captiva Island – Vulnerability Assessment and Adaptation Plan
Asset Vulnerability
2-5
0021Low0003Low0003 1514Medium11632Medium01138 High0000High0000High0000 012301230123 0021Low0003Low0003 1118Medium10732Medium01039 High0000High0000High0000 012301230123 0012Low0003Low0003 1319Medium10732Medium00139 High0000High0000High0000 012301230123 0012Low0003Low0003 1121Medium10732Medium00139 High0000High0000High0000 012301230123 0003Low0003Low0003 29Medium01138Medium00139 High0000High0000High0000 012301230123
ScoreImpact Score
2-2, continued. Storm surge vulnerability tables illustrating number of assets (building structures) owned by South Seas.
ScoreImpact
ScoreImpact ScoreImpact Score
2.2.2. TIDAL FLOODING VULNERABILITY
Figure 23 . Tidal fl
class.
Low1132291437
Medium1551771031
Number ofAssetsVulnerabletoTidalFlooding (2022) Adaptive Capacity
High2400
Adaptive Capacity
Number ofAssetsVulnerabletoTidalFlooding (2040, NOAAInt-Low) Adaptive
Low802093074
Medium1141801861 High2310
Adaptive
Number ofAssetsVulnerabletoTidalFlooding (2040, NOAAInt-High)
Adaptive Capacity
Low7014731145
Medium9615018109 High2103
Adaptive
Capacity
Number ofAssetsVulnerabletoTidalFlooding (2070, NOAAInt-Low)
Adaptive Capacity
Low6412920180
Medium8315112127 High2103
Adaptive Capacity
Number ofAssetsVulnerabletoTidalFlooding (2070, NOAAInt-High)
Adaptive Capacity
Low34302327
Medium384010285 High0105
24 Tidal flood
Number ofAssetsVulnerabletoTidalFlooding (2070, NOAAInt-High)
Medium02137
class
Asset Vulnerability 2-6 South Seas Captiva Island – Vulnerability Assessment and Adaptation Plan
0123
0123
0123
0123
0123 Impact
Impact
Impact
Impact
Impact
Low1603
High0000 0123
High0000 0123
Medium32539 High0000 0123
High0000 0123
Capacity
Medium63112
Low0532 Medium33115
Low0415
Low0406 Medium125212
Low00010
High0000 0123 Impact
Impact
Adaptive Capacity
Impact
Number ofAssetsVulnerabletoTidalFlooding (2070, NOAAInt-Low) Impact
Capacity
Number ofAssetsVulnerabletoTidalFlooding (2040, NOAAInt-High)
Impact
Number ofAssetsVulnerabletoTidalFlooding (2040, NOAAInt-Low)
Number ofAssetsVulnerabletoTidalFlooding (2022)
o od vulnerability tables illustrating number of assets (building structures and roadways) on Captiva Island within each vulner ability
Figure
vulnerability tables illustrating number of assets (building structures and roadways) owned by South Seas within each vulnerability
2.2.3. PRECIPITATION VULNERABILITY
Number ofAssetsVulnerabletoPrecipitation (2022)
Low155180058
Medium187160026
High2301
w
Number ofAssetsVulnerabletoPrecipitation (2040, NOAAInt-Low)
Adaptive Capacity
Low140185167
Medium176164033
High2202
Number ofAssetsVulnerabletoPrecipitation (2022)
Impact
Number ofAssetsVulnerabletoPrecipitation (2040, NOAAInt-Low)
Adaptive Capacity
Number ofAssetsVulnerabletoPrecipitation (2040, NOAAInt-High) Adaptive Capacity
Low120190281
Medium156176041 High1302
Number ofAssetsVulnerabletoPrecipitation (2070, NOAAInt-Low)
Adaptive Capacity
Low112190388
Medium152176045
High1302
Number ofAssetsVulnerabletoPrecipitation (2040, NOAAInt-High)
Number ofAssetsVulnerabletoPrecipitation (2070, NOAAInt-Low) Impact
Adaptive Capacity
Number ofAssetsVulnerabletoPrecipitation (2070, NOAAInt-High) Adaptive Capacity
Low731762142
Medium1081510114 High0303
Asset Vulnerability South Seas Captiva Island – Vulnerability Assessment and Adaptation Plan 2-7
0123
0123
0123
0123
0123
Impact Impact
Impact
Impact
Impact Low4105 Medium231601 High0000 0123 Low2305
High0000 0123 Low2215 Medium211702 High0000 0123 Low2125 Medium211603 High0000 0123
High0000 0123 Impact
Adaptive Capacity
Medium221602
Low2107 Medium1614010
Impact
Adaptive Capacity
Number ofAssetsVulnerabletoPrecipitation (2070, NOAAInt-High) Impact
Adaptive Capacity
Adaptive Capacity
Figure 25 Precipitation vulnerability tables illustrating number of assets (building structures and roadways) on Captiva Island within each vulnerability class.
Figure 26 . Precipitation vulnerability tables illustrating number of assets (building structures and roadways) owned by WS SSIR, LLC
ithin each vulnerability class.
Asset Vulnerability 2-8 South Seas Captiva Island – Vulnerability Assessment and Adaptation Plan 2.2.4. EXTREME WIND VULNERABILITY
Figure 2-7. Wind vulnerability table illustrating number of assets (building structures) on Captiva Island within each vulnerability class.
Low0662994 Medium04430128 High0150 0123 NumberofAssetsVulnerabletoWind AdaptiveCapacity Impact Low0030 Medium04360 High0000 0123 Impact AdaptiveCapacity NumberofAssetsVulnerabletoWind
Figure 2-8. Wind vulnerability table illustrating number of assets (building structures) owned by WS SSIR, LLC within each vulnerability class.
2.2.5 BEACH EROSION VULNERABILITY
NumberofAssetsVulnerabletoBeachErosion
Low25726842
Medium220511000
NumberofAssetsVulnerabletoBeachErosion
Low3000
Medium280120
Asset Vulnerability South Seas Captiva Island – Vulnerability Assessment and Adaptation Plan 2-9
Figure 2-9. Beach erosion vulnerability table illustrating number of assets (building structures) on Captiva Island within each vulnerability class.
Figure 2-10. Beach erosion vulnerability table illustrating number of assets (building structures) owned by WS SSIR, LLC within each vulnerability class
High6011 0123
AdaptiveCapacity Impact
Impact AdaptiveCapacity
High0000 0123
Asset Vulnerability 2-10 South Seas Captiva Island – Vulnerability Assessment and Adaptation Plan
This page is intentionally blank.
Part 3
Asset Prioritization
Asset Prioritization 3-0 South Seas Captiva Island – Vulnerability Assessment and Adaptation Plan
This page is intentionally blank.
3.1. Adaptation Prioritization Exercise (APEx)
After analyzing the conditions and vulnerabilities of the various assets on Captiva Island, the Brizaga Team utilized our Adaptation Prioritization Exercise (APEx) tool to prioritize the assets based on which assets required most urgent attention based on current and future conditions. A powerful function of APEx is that it allows for customized and flexible prioritization, meaning that certain hazards can have a larger influence than others at the user’s discretion.
3.2. APEx Structure
This section is structured to provide an overview of each of the worksheets within the APEx tool along with details on its functionality. The worksheets include:
1. APEx Home
2. Asset Sheet
3. APEx Calculation
4. Physical Criticality
5. Economic Criticality
6. Environmental Criticality
7. Stakeholder Engagement
8. Weighting & Results
9. Final Ranking
10. Notes
3.2.1 APEX HOME
The first page of the Adaptation Prioritization Exercise provides an overview of the purpose and application of the APEx tool, a screening-level tool designed to guide Capital Improvements planning and asset management. Data entry fields include information regarding the Client for which the tool is prepared, Brizaga staff responsible for coordinating the tool for the Client, and the date it was prepared. Additional fields are available for the Client to enter data detailing specific stakeholder engagements.
At the bottom of the page, there is a section of large print that indicates whether the document is for public release. This determination is made based upon the agreement among City staff and its consultants regarding the characteristics and weighting of the various assets, as well as the completion of the outreach activities.
3.2.2 ASSET SHEET
The second worksheet prepared as part of the APEx is the Asset Sheet which provides a list of all assets for consideration as part of the exercise. Data columns include the asset name, asset owner, street address with City, State, and Zip Code, and any relevant notes. This data is queried in subsequent worksheets to aid in the performance of the vulnerability and weighting calculations.
Asset Prioritization South Seas Captiva Island – Vulnerability Assessment and Adaptation Plan 3-1
3.2.3 APEX CALCULATION
The APEx calculation worksheet includes hazard projections specific to each asset listed on the Asset Sheet. For Captiva Island, the vulnerability imposed by all hazards (with the exception of water quality) were studied were evaluated to aid in the prioritization of asset adaptation. Water quality was excluded from APEx as it an overarching vulnerability affecting all assets, generally originating from Lake Okeechobee.
For all flood-based hazards, the various timescales and sea level rise projections were utilized. Provisions for the evaluation of any singular type of event each year and sea level rise projection has been included in the APEx framework. For example, the user can evaluate asset priorities under consideration of a Category 2 hurricane in the year 2040 with the NOAA intermediate-high sea level rise projection if they so choose.
A weighting value is assigned to each hazard as well, such that the user may evaluate priorities through the lens of any combination of hazards. This is intended to aid in identifying overall priorities or identify assets that may be eligible for specific grant funding (i.e., Resilient Florida Grants).
In addition to the weighting values for specific hazards, weighting for evaluation of the triple-bottom-line has been included. It has been observed that hazards may affect assets physically, economically, and environmentally. By including a tool that allows the user to view vulnerability based on any combination of physical, economic, or environmental conditions, asset prioritization can be adjusted based on community priorities.
3.2.4 CRITICALITY
During the development of the vulnerability assessment, a method of incorporating criticality was created. Criticality is a measurement of how significant a consequence may be, should a specific asset be impacted by a specific hazard. Without sufficient data on an individual asset basis, assumptions must be made to assign criticality scores. Similar to adaptive capacity, identification of criticality for each hazard was based on land use. Criticality has been identified on a range of 0 to 4, with 0 being not at all critical and 4 being extremely critical.
3.2.4.1 Physical Criticality
Physical criticality is designed to examine how basic needs are affected by a hazard. Physical criticality has been assigned based on how critical it is that a particular asset type maintains continuity of services during or resumes operations immediately following a hazard event. Basic needs generally include the availability and provision of food, water, shelter, security, and life safety. For some asset types, criticality must be evaluated on a case-by-case basis.
The physical criticality worksheet identifies criticality scores based on asset types, or whether an asset must be evaluated on a case-by-case basis (CBC). The worksheet allows the user to manually enter criticality scores where necessary, to be utilized in the final prioritization calculations.
Asset Prioritization 3-2 South Seas Captiva Island – Vulnerability Assessment and Adaptation Plan
3.2.4.2 Economic Criticality
Economic criticality is designed to examine the economic ramifications of a hazard. Economic criticality has been assigned based on how critical it is that a particular asset type maintains continuity of services during or resumes operation immediately following a hazard event. Economic ramifications generally include the ability to provide economic output in the form of jobs, wages, goods, services, and tax revenues. For some asset types, criticality must be evaluated on a case-by-case basis.
The economic criticality worksheet identifies criticality scores based on asset types, or whether an asset must be evaluated on a case-by-case basis (CBC). The worksheet allows the user to manually enter criticality scores where necessary, to be utilized in the final prioritization calculations.
3.2.4.3 Environmental Criticality
Environmental criticality is designed to examine the ecological ramifications of a hazard. Environmental criticality has been assigned based on how severe the anticipated environmental impact may be should an asset type be damaged or disabled because of a hazard event. For some asset types, criticality must be evaluated on a case-by-case basis.
The environmental criticality worksheet identifies criticality scores based on asset types, or whether an asset must be evaluated on a case-by-case basis (CBC). The worksheet allows the user to manually enter criticality scores where necessary, to be utilized in the final prioritization calculations.
3.2.5 STAKEHOLDER ENGAGEMENT
This is an optional step, but an important consideration as part of prioritization. In a fashion similar to that of the APEx Calculation worksheet, the Stakeholder Engagement worksheet is designed to include priorities as determined by stakeholders participating in various outreach activities for the project. This information may be collected through surveys, interactive stations, or other methods, including ranking by individual staff members or groups.
The worksheet allows for up to six (6) stakeholder engagements to be included in the evaluation. The findings from the stakeholder engagement activities can also be weighted at the discretion of the Client, and a variable weighing may be appropriate based upon the types of groups engaged (i.e., elected officials, business leaders, non-profit organizations, public, etc.).
The worksheet has a built-in calculator that generates an engagement score, indicated later in the Weighting & Results worksheet to inform the final ranking of the asset priorities.
3.2.6 WEIGHTING AND RESULTS
The Weighting & Results worksheet collects the information entered in the APEx Calculation, Stakeholder Engagement, and Criticality worksheets and performs a backend calculation to determine a total score and rank for each of the assets.
Asset Prioritization South Seas Captiva Island – Vulnerability Assessment and Adaptation Plan 3-3
Ranking of priorities is determined by the total score tallied for each of the assets, based on weighting of criticality and stakeholder engagement selected by the user. The total score is the sum of the additive score and the multiplier score, each of which may be weighted and calculated differently.
The additive score is an aggregate of the impact, criticality, and engagement scores, weighted by user preferences entered in the additive box at the top of the worksheet, as well as the physical, economic, and environmental criticality boxes. The additive score is a more quantitative measure of the risk and vulnerability of the assets with a small component of engagement included. By setting the engagement additive weight to zero, engagement (the qualitative component) can be completely omitted from this calculation, making the prioritization purely data based. The inclusion of the physical, economic, and environmental criticality weighting allows the final rankings to be through their respective lenses, or any combination thereof.
The multiplier score is a measure of the engagement score applied to a 4ombinationn of the impact and criticality, as weighted by user preferences entered in the “multiplier” box at the top of the worksheet. The multiplier score is a more qualitative measure of the risk and vulnerability of the assets. By setting the additive weight to zero, the additive score (the quantitative component) can be completely omitted from the calculation, making the prioritization based completely on stakeholder engagement.
The box and whiskers plot provides a visual reference for the additive, multiplier, and total scores, aiding the user in determining the skewness of the weighting.
The weighting we utilized to obtain the final prioritizations discussed in section 3.3 of this report were as follows: high winds were assigned a 5% weight, precipitation was 20%, tidal flooding was 50%, storm surge was 20%, and beach erosion was 5%. For precipitation, tidal flooding, and storm surge they all were analyzed under the NOAA 2070 intermediate low prediction scenarios. Stakeholder engagement was not considered for this project. Within criticality, physical and economic criticality were weighted 50% each while environmental criticality was weighted at 0%.
These weightings and scenarios were chosen because they were considered the best representation of what Captiva’s biggest issues will be in the future long term. As a largely tourist focused small beach front community, chronic flooding will easily be the biggest danger both to the built environment but also the local economy and public image. APEx was built with the central focus that custom weighting can allow communities to best analyze adaptation strategies through the lens of their own needs. We feel that the weights we have provided represent Captiva in a similar way but hope that South Seas will further adjust the weighting values to best aid both themselves and the community at large.
3.2.7 FINAL RANKING
The final ranking worksheet is an output of the overall results and provides a ranking of the assets in number order of based on total score. Scores for each type of criticality, as well as additive scores and multiplier scores are provided alongside the total score to illustrate the weighting of the quantitative and qualitative components of the calculation. Assets with greater scores are most vulnerable and therefore should be of highest priority in terms of providing adaptation measures.
Asset Prioritization 3-4 South Seas Captiva Island – Vulnerability Assessment and Adaptation Plan
A column within the final ranking indicates the adaptive capacity of each asset as previously assigned, allowing the user to filter results based upon preferences. Political, financial, and timing constraints frequently limit communities regarding the types of projects that may be undertaken. By allowing the end user to filter by adaptive capacity, it is simpler to identify projects that may be done quickly or projects that require significant planning, and where they fall within the overall ranking. This enables clients to address short-term concerns while simultaneously planning for longer-term infrastructure improvements.
Like criticality, adaptive capacity must be determined on a case-by-case basis for some assets. The final ranking worksheet allows the user to manually enter adaptive capacity information for vulnerability grouping.
3.2.8 NOTES
The notes worksheet is included for the user or the consultant to add notes indicating deviations or changes from the built-in calculations, as well as to indicate additional considerations or characteristics to be communicated to the recipients of the final product.
3.3 Asset Priorities
Captiva Island is a barrier island off the coast of Florida. As such it has some inherent qualities that are true for many others as well. Ground elevation is consistently low, the local economy is focused on tourism, most of the assets are located within the 100-year floodplain, and utility development is relatively inadequate for future population growth. These factors cause many assets to be considered vulnerable to most of the hazards included in this study, especially those that are flooding based. In fact, many properties on the eastern side of the island (which is lower than the west) are already experiencing upwards of a few weeks of tidal flooding annually.
This is compounded by the relatively high groundwater. The proximity to tidal water bodies and geology of the barrier island means that the ground has a decreasing capacity to handle stormwater. As sea levels rise, so too will the groundwater further decreasing the ability for the ground to absorb stormwater. Investments in systems that emphasize removing as much water as possible during flooding scenarios is key for the vitality of Captiva Island.
As shown on the following page, the most vulnerable asset, in most weighting scenarios, is the FGUA Wastewater facility. This is because it has such a high criticality while still being considered vulnerable to hazards like storm surge. It is paramount that Captiva Island invest in hardening of this structure to both ensure its vitality as well as eliminate the possibility of a catastrophic water quality event. Strategies analyzing the facility and how to invest are explored in the Captiva Adaptation plan.
Asset Prioritization South Seas Captiva Island – Vulnerability Assessment and Adaptation Plan 3-5
The remaining vulnerable assets consist of roadways, either within the South Seas property or as part of the public right of-way. When considering roadways, most flooding occurred on roadway segments 12-18, which comprise the middle of the island and can be seen in the map appendix. These roadway segments also comprised 8 of the top 10 most vulnerable assets within our apex prioritization. This area should be especially focused on during any future stormwater master plan updates or largescale engineering projects.
Asset Prioritization 3-6 South Seas Captiva Island – Vulnerability Assessment and Adaptation Plan
Figure 3-1. The top 10 assets prioritized by the APEx tool
Rank AssetID LeeCounty Property AppraiserLink GoogleMapsLink LandUse Owner Address 1 749 10003920 MAPLINK UTILITY FLORIDAGOVTUTILITYAUTHORITY SOUTHSEASPLANTATIONWWTP 2 RS12 N/A MAPLINK RIGHT-OF-WAY #N/A #N/A 2 RS13 N/A MAPLINK RIGHT-OF-WAY #N/A #N/A 2 RS14 N/A MAPLINK RIGHT-OF-WAY #N/A #N/A 2 RS15 N/A MAPLINK RIGHT-OF-WAY WSSSIROWNERLLC #N/A 2 RS16 N/A MAPLINK RIGHT-OF-WAY WSSSIROWNERLLC #N/A 2 RS17 N/A MAPLINK RIGHT-OF-WAY WSSSIROWNERLLC #N/A 2 RS24 N/A MAPLINK RIGHT-OF-WAY WSSSIROWNERLLC #N/A 9 RS11 N/A MAPLINK RIGHT-OF-WAY #N/A #N/A 10 RS18 N/A MAPLINK RIGHT-OF-WAY WSSSIROWNERLLC #N/A Rank AssetID LeeCounty Property AppraiserLink GoogleMapsLink LandUse Owner Address 2 RS15 N/A MAPLINK RIGHT-OF-WAY WSSSIROWNERLLC #N/A 2 RS16 N/A MAPLINK RIGHT-OF-WAY WSSSIROWNERLLC #N/A 2 RS17 N/A MAPLINK RIGHT-OF-WAY WSSSIROWNERLLC #N/A 2 RS24 N/A MAPLINK RIGHT-OF-WAY WSSSIROWNERLLC #N/A 10 RS18 N/A MAPLINK RIGHT-OF-WAY WSSSIROWNERLLC #N/A 93 RS19 N/A MAPLINK RIGHT-OF-WAY WSSSIROWNERLLC #N/A 93 RS20 N/A MAPLINK RIGHT-OF-WAY WSSSIROWNERLLC #N/A 96 226 10003922 MAPLINK HOTELS,MOTELS WSSSIROWNERLLC 1200SSPLANTATIONRD 154 400 10004112 MAPLINK MULTI-FAMILY10ORMORE WSSSIROWNERLLC 2800-5640SOUTHSEASPLANTATIONRD 179 434 10003922 MAPLINK HOTELS,MOTELS WSSSIROWNERLLC 1200SSPLANTATIONRD
Figure 3-2. The top 10 assets owned by WS SSIR, LLC, prioritized by the APEx tool
Part 4
Adaptation Plan
Adaptation Plan 4-0 South Seas Captiva Island – Vulnerability Assessment and Adaptation Plan
This page is intentionally blank.
4.1 Adaptation Strategies
Once assets were prioritized via APEx, the Brizaga team developed a series of adaptation strategies with the goal of comprehensively protecting the most vulnerable assets in the community. Ultimately, the adaptation strategies provided below provide different paths moving forward, protecting the community from current challenges, as well as from future challenges caused by flooding, sea level rise, storms, beach erosion, and water quality hazards.
Captiva is a highly vulnerable island that will require a blend of focused adaptation efforts to ensure its longevity. As evidenced by the APEx tool results, it is our recommendation that the island pursues a three-pronged approach to resiliency: local regulations, large engineering projects, and consistently tracking down funding opportunities. The following sections will provide descriptions for each while also detailing how they work together.
4.1.1 LOCAL REGULATIONS
Using local ordinances and incentive programs the Captiva community can rapidly reduce vulnerability of new and old infrastructure alike. As climate change intensifies the hazards analyzed it is necessary for the governing of island development to evolve as well. Below are the two main methods for achieving this goal.
4.1.1.1 Zoning Codes
Arguably one of the easiest tactics while yielding some of the biggest results, zoning codes should be implemented as soon as possible on Captiva Island. Zoning codes can maintain a healthy amount of development on the island while ensuring that property types that are more sensitive to climate hazards are kept out of exposed areas. By enforcing zoning codes, maintaining environmental health, and achieving some funding opportunity requirements becomes much easier.
4.1.1.2 Green Infrastructure Policies
Not only should development beproperly zonedon Captiva Island but how it interacts with hazards should also be considered. Strategies like rain catchment barrels which contains rainfall before it becomes runoff are examples of how hazards can be mitigated before they cause more serious issues. These philosophies are integral to a principle we recommend known as Low Impact Development (LID).
LID “refers to systems and practices that use or mimic natural processes that result in the infiltration, evapotranspiration, or use of stormwater in order to protect water quality and associated aquatic habitat.”12 This principle is also used to refer to green infrastructure, which is intended to collect and provide filtration to stormwater runoff while restoring greenspaces, compared to impervious surfaces. Some examples of technologies used to achieve low impact development are green roofs, permeable pavers, bioretention swales, and soil amendments prior to construction. By having an approach like LID, Captiva can restore environmental health and water quality in a way that inspires innovation. LID can be enforced through certain zoning codes and help alleviate some hazards intensities thus removing some of the strain placed on the large engineering projects recommended below.
Adaptation Plan South Seas Captiva Island – Vulnerability Assessment and Adaptation Plan 4-1
4.1.2 INFRASTRUCTURE PROJECTS
While there are many options for low-cost adaptation, there will need to be some large-scale engineering projects to guarantee the security of certain hyper critical assets. In the case of Captiva Island those assets are its roads and the wastewater treatment facility. Through the hardening and elevation techniques described below the island can guarantee its safety through future climate related emergencies.
4.1.2.1 Road Raising
Roadways are the single most important asset a community has in the event of an emergency. Without usable roads, emergency vehicles cannot provide aid and citizens cannot evacuate if needed. Our vulnerability analysis revealed that many portions of Captiva’s main road become heavily flooded during large storms. By elevating these roads Captiva can ensure that precipitation will not inundate their transportation infrastructure. APEx revealed that Roadway segments 11-17 should be prioritized first since those are most frequently flooded in even less intense scenarios.
4.1.2.2 Utility Plan
Any coastal community as low in elevation as Captiva will struggle with flooding issues. Where those issues can spiral out of control is when they threaten a region’s utilities. Without power, sewage treatments, etc. human life can fall into serious jeopardy. Looking at the most important utility facility on Captiva Island, the Wastewater Treatment Facility, the analysis revealed that in many weighting scenarios, it is the most vulnerable asset on the Island due to its high criticality. Located in a preserve with a high risk of flooding, it could spell disaster for the surrounding water quality in the unlikely event of a failure. Therefore, Brizaga agrees with the Captiva Community Panel’s previous recommendations that the facility should be elevated to 15 feet above sea level. This plan is explored more thoroughly in section 4.2.3 of this report.
In conjunction with hardening the wastewater treatment facility. It is our recommendation that, as was also recommended in the SCCF water quality study, the island switch from largely utilizing septic tanks to a sewer system. By having one large & interconnected waste system the risk of individual waste treatment systems that may fail and leak is eliminated. Thusly a well-maintained sewer system would provide a much more reliable solution to waste treatment while securing the health of Captiva’s water quality, more specifically its groundwater.
4.1.3 FUNDING OPPORTUNITIES
As a private entity, there are limited direct funding opportunities for South Sea Island Resort. However, there may be opportunities to engage insurance or risk mitigation companies to explore how resilience actions may reduce insurance premiums. Other innovative financing mechanism may be available, but there are currently limited financial incentives for significant resilience actions for private entities.
Adaptation Plan 4-2 South Seas Captiva Island – Vulnerability Assessment and Adaptation Plan
Any risk mitigation efforts undertaken by South Seas will have benefits for properties outside of South Seas. This creates a significant opportunity to partner with appropriate local governments and other governmental entities to apply for local, regional, state, and federal grant and financing opportunities. For example, a large living shoreline project that spans a significant portion of the island would be an eligible project under the new Resilient Florida Grant Program however, Lee County would need to be the applicant and fiscal agent.
Given the over $1 billion in resilience funding provided by the State of Florida over the past two years, this is a pivotal moment in infrastructure funding for resilience. On top of the state funding, the recently passed Infrastructure Investment and Jobs Act (IIJA) and Inflation Reduction Act will provide significant access to resilience funding over the next decade. There are hundreds of new programs being created.
Another funding opportunity is to increase recurring funding through further and improved onsite operations and development.
4.2 Potential Adaptation Projects
Below are more specific actionable projects for the consideration of Captiva Island.
4.2.1 LIVING SHORELINE INSTALLATION
The north end of Captiva experiences much higher shoreline change (erosion or accretion) rates compared to the rest of the island due to its location relative to Redfish Pass. The shoreline to the south of the terminal groin at the northern end of Captiva is erosional, but generally consistent and predictable in terms of shoreline change rate. Along the north side of the island adjacent to Redfish Pass, the shoreline is subject to significant daily cross-shore currents due to the ebb and flood currents between the Gulf of Mexico and Pine Island Sound.
A living shoreline project along the northern shoreline of Captiva is one potential project that should be explored. A project such as this can improve the stability of the shoreline in that area, thereby reducing the storm surge and erosion exposure of the nearby structures and infrastructure. Additionally, such a project can provide habitat for native species and improve water quality in Pine Island Sound, a net benefit for the entirety of Captiva. The project could include aquatic vegetation, oyster beds, or mangroves, and can serve as opportunity to educate and advocate preservation in this unique coastal environment.
Any such project would require coastal modeling to evaluate changes to sediment transport patterns, deposition areas, budgets, navigation, and regulatory issues.
Adaptation Plan South Seas Captiva Island – Vulnerability Assessment and Adaptation Plan 4-3
4.2.2 ROADWAY ELEVATION AND/OR STORMWATER IMPROVEMENTS
Many roads on Captiva Island already experience flooding under a variety of scenarios. To maintain continuous access to property, the elevation of Captiva’s roads and improvements to the stormwater systems along such roads should be explored, particularly for the cases in which flooding is severe enough to limit emergency vehicle access.
The central portion of Captiva has extremely vulnerable roads in comparison to other areas. Flooding of these roadways limit access to the northern section of Captiva and have the potential to pose life safety risks as there are no hospitals or other emergency services on the island.
Improvements to roadways and stormwater management infrastructure should strike a balance between the need for stormwater capacity during extreme storms, harmonization with adjacent private property, the cost of improvements, and pollutant loading from runoff. A possible pilot project location for these improvements would be at the intersection of road segments 12 and 13 (as defined by our assessment).
These segments were flooded in 100% of the high precipitation scenarios and are surrounded by both residential as well as commercial infrastructure. Also, in considering pollutant loading, these roads are very close to the estuary side ofCaptiva, which is the side with much more already impaired water bodies. Improving these roads first can also present an opportunity to demonstrate viable green infrastructure projects that detain runoff and reduce nutrient loading. Usability of these road segments, especially in emergency scenarios, will be paramount for the vitality of the central region of Captiva Island.
4.2.3 SEWER SYSTEM EXPANSION AND HARDENING
The Captiva community continues to actively explore options to convert the current septic tanks throughout the island to a central sanitary sewer system. While no immediate and discrete threat exists from the existence of the septic systems, it has been documented that one of the two primary sources of water quality concerns is the nitrogen discharge from septic systems, which do not typically remove nitrogen from domestic waste. Conversion of these septic systems to central sewer will help mitigate water quality concerns.
Conversely, the South Seas Plantation Wastewater Treatment Plant (WWTP) which serves approximately 50% of the island is in the center of a nature preserve on the estuary side of Captiva and is subject to storm surge flooding. While the environmental impact of a WWTP failure due to storm surge overtopping is unknown, it is expected to be significant with wide ranging effects on the natural ecosystems around Captiva.
While limited data was available for the WWTP, some general assumptions about the facility were made. Based on these assumptions, the WWTP was found to be one of the least vulnerable assets on Captiva relative to storm surge. These numbers should be updated to reflect the actual built conditions of the WWTP upon provision of the relevant information by the owner/operator.
In 2019, the Florida Governmental Utility Authority (FGUA), who owns and operates the WWTP, presented an option to the Captiva Community Panel to harden the facility to an elevation of 15 feet NAVD, meaning that all critical mechanical and electrical components would be installed above this
Adaptation Plan 4-4 South Seas Captiva Island – Vulnerability Assessment and Adaptation Plan
elevation. In addition to elevation, resilience measures would include considerations for the structure’s exposure to marine conditions and be constructed of non-ferrous (non-corrosive) metals where practical. If constructed, the hardened WWTP would be the least vulnerable asset on Captiva based on the criteria utilized in our assessment.
4.2.4 SUSTAINABLE ACTIONS
While notdirectly an adaptation action, there are opportunities to improve the sustainability of theproperty while reducing the overall cost of adaptation over time. One of the most significant challenges in increasing density of the property, which will be important part of funding adaptation, will be the increased traffic through Sanibel and the southern portion of Captiva
Exploring solutions which allow for greater visitors without increasing traffic congestion will also reduce greenhouse gas emissions. For example, a ferry from the mainland to the island may be an option for the South Sea property. This could also be part of a broader Sanibel-Captiva ferry solution. Reducing the number of cars within the property will also reduce parking needs and roadway maintenance.
Adaptation Plan South Seas Captiva Island – Vulnerability Assessment and Adaptation Plan 4-5
Adaptation Plan 4-6 South Seas Captiva Island – Vulnerability Assessment and Adaptation Plan
This page is intentionally blank.
Appendices
page is intentionally blank
This
Appendix A.
Storm Surge Inundation Maps
page is intentionally blank
This
Storm Surge Flooding Extents


Captiva Island (South Segment)


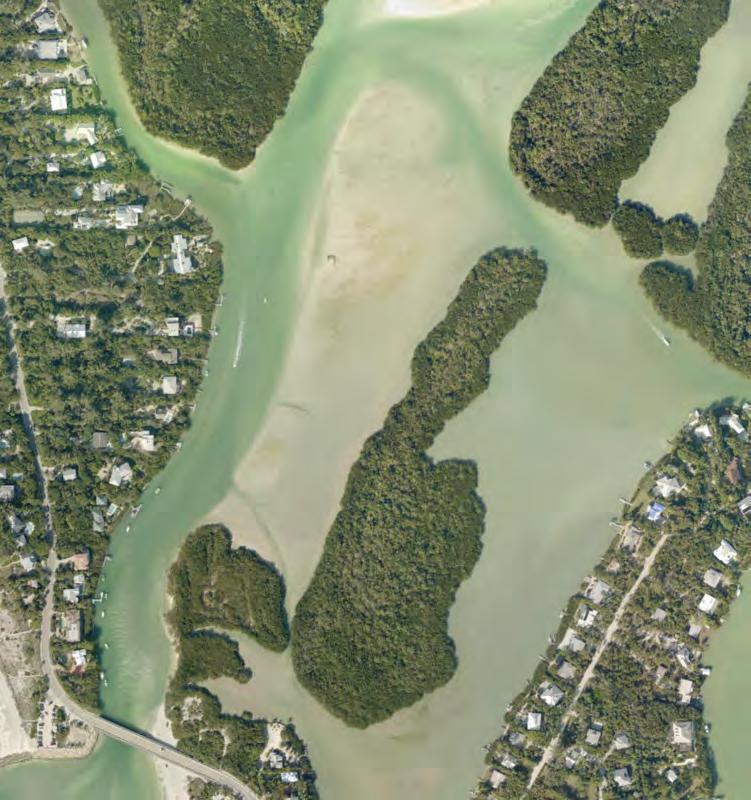
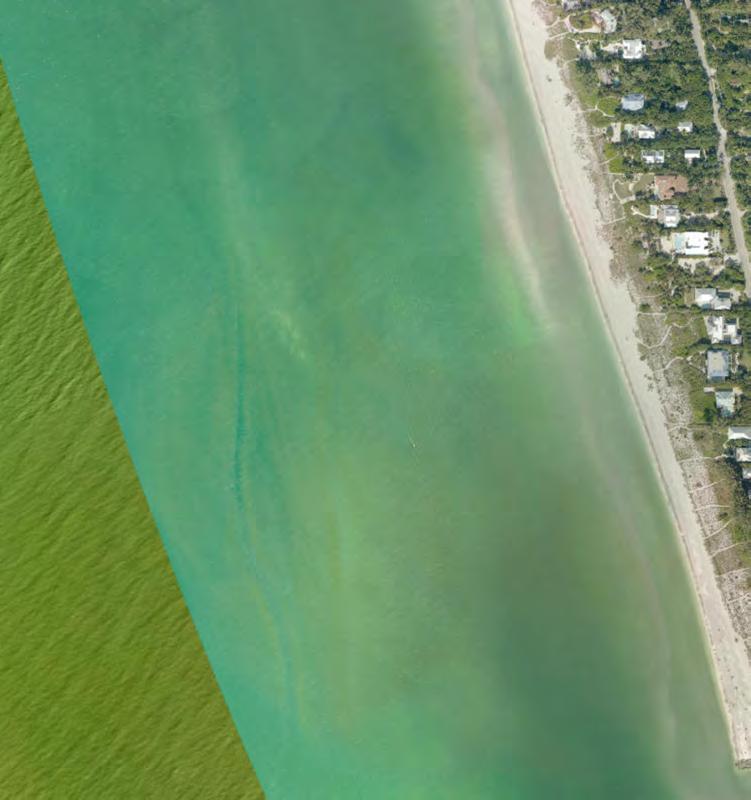
Tropical Storm 2022 (Current)


Legend 2022 (Current) Tropical Storm Flooding Depths (feet) 0.01 - 0.25 0.26 - 0.50 0.51 - 0.75 0.76 - 1.00 1.01 - 1.50 1.51 - 2.00 2.01 - 2.50 2.51 - 3.00 3.01 - 4.00 4.01+ ± 0 0.1 0.2 0.3 0.4 0.05 Miles
Storm Surge Flooding Extents


Captiva Island (South Segment)


Tropical Storm 2040 (NOAA Int-Low)


Legend 2040 (Int-Low) Tropical Storm Flooding Depths (feet) 0.01 - 0.25 0.26 - 0.50 0.51 - 0.75 0.76 - 1.00 1.01 - 1.50 1.51 - 2.00 2.01 - 2.50 2.51 - 3.00 3.01 - 4.00 4.01+ ± 0 0.1 0.2 0.3 0.4 0.05 Miles
Storm Surge Flooding Extents


Captiva Island (South Segment)


Tropical Storm 2040 (NOAA Int-High)


Legend 2040 (Int-High) Tropical Storm Flooding Depths (feet) 0.01 - 0.25 0.26 - 0.50 0.51 - 0.75 0.76 - 1.00 1.01 - 1.50 1.51 - 2.00 2.01 - 2.50 2.51 - 3.00 3.01 - 4.00 4.01+ ± 0 0.1 0.2 0.3 0.4 0.05 Miles
Storm Surge Flooding Extents


Captiva Island (South Segment)


Tropical Storm 2070 (NOAA Int-Low)


Legend 2070 (Int-Low) Tropical Storm Flooding Depths (feet) 0.01 - 0.25 0.26 - 0.50 0.51 - 0.75 0.76 - 1.00 1.01 - 1.50 1.51 - 2.00 2.01 - 2.50 2.51 - 3.00 3.01 - 4.00 4.01+ ± 0 0.1 0.2 0.3 0.4 0.05 Miles
Storm Surge Flooding Extents


Captiva Island (South Segment)


Tropical Storm 2070 (NOAA Int-High)


Legend 2070 (Int-High) Tropical Storm Flooding Depths (feet) 0.01 - 0.25 0.26 - 0.50 0.51 - 0.75 0.76 - 1.00 1.01 - 1.50 1.51 - 2.00 2.01 - 2.50 2.51 - 3.00 3.01 - 4.00 4.01+ ± 0 0.1 0.2 0.3 0.4 0.05 Miles
page is intentionally blank
This
Storm Surge Flooding Extents Captiva Island (South Segment)


Category 1 Hurricane 2022 (Current)


Legend 2022 (Current) Category 1 Hurricane Flooding Depths (feet) 0.01 - 0.25 0.26 - 0.50 0.51 - 0.75 0.76 - 1.00 1.01 - 1.50 1.51 - 2.00 2.01 - 2.50 2.51 - 3.00 3.01 - 4.00 4.01+ ± 0 0.1 0.2 0.3 0.4 0.05 Miles
Storm Surge Flooding Extents Captiva Island (South Segment)


Category 1 Hurricane 2040 (NOAA Int-Low)


Legend 2040 (Int-Low) Category 1 Hurricane Flooding Depths (feet) 0.01 - 0.25 0.26 - 0.50 0.51 - 0.75 0.76 - 1.00 1.01 - 1.50 1.51 - 2.00 2.01 - 2.50 2.51 - 3.00 3.01 - 4.00 4.01+ ± 0 0.1 0.2 0.3 0.4 0.05 Miles
Storm Surge Flooding Extents


Captiva Island (South Segment)
Category 1 Hurricane 2040 (NOAA Int-High)


Legend 2040 (Int-High) Category 1 Hurricane Flooding Depths (feet) 0.01 - 0.25 0.26 - 0.50 0.51 - 0.75 0.76 - 1.00 1.01 - 1.50 1.51 - 2.00 2.01 - 2.50 2.51 - 3.00 3.01 - 4.00 4.01+ ± 0 0.1 0.2 0.3 0.4 0.05 Miles
Storm Surge Flooding Extents Captiva Island (South Segment)


Category 1 Hurricane 2070 (NOAA Int-Low)


Legend 2070 (Int-Low) Category 1 Hurricane Flooding Depths (feet) 0.01 - 0.25 0.26 - 0.50 0.51 - 0.75 0.76 - 1.00 1.01 - 1.50 1.51 - 2.00 2.01 - 2.50 2.51 - 3.00 3.01 - 4.00 4.01+ ± 0 0.1 0.2 0.3 0.4 0.05 Miles
Storm Surge Flooding Extents


Captiva Island (South Segment)


Category 1 Hurricane 2070 (NOAA Int-High)


Legend 2070 (Int-High) Category 1 Hurricane Flooding Depths (feet) 0.01 - 0.25 0.26 - 0.50 0.51 - 0.75 0.76 - 1.00 1.01 - 1.50 1.51 - 2.00 2.01 - 2.50 2.51 - 3.00 3.01 - 4.00 4.01+ ± 0 0.1 0.2 0.3 0.4 0.05 Miles
page is intentionally blank
This
Storm Surge Flooding Extents


Captiva Island (Middle Segment)


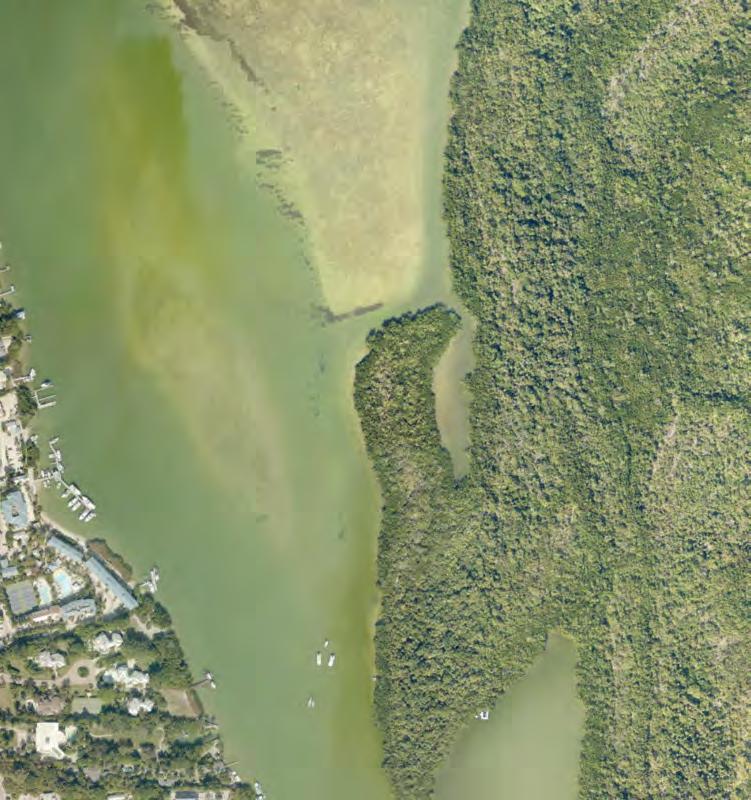
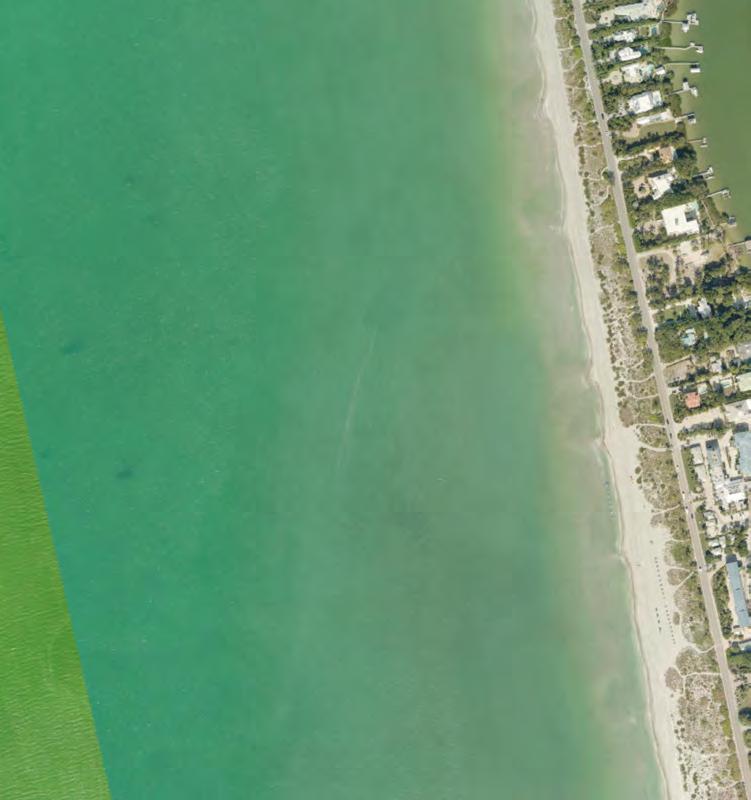
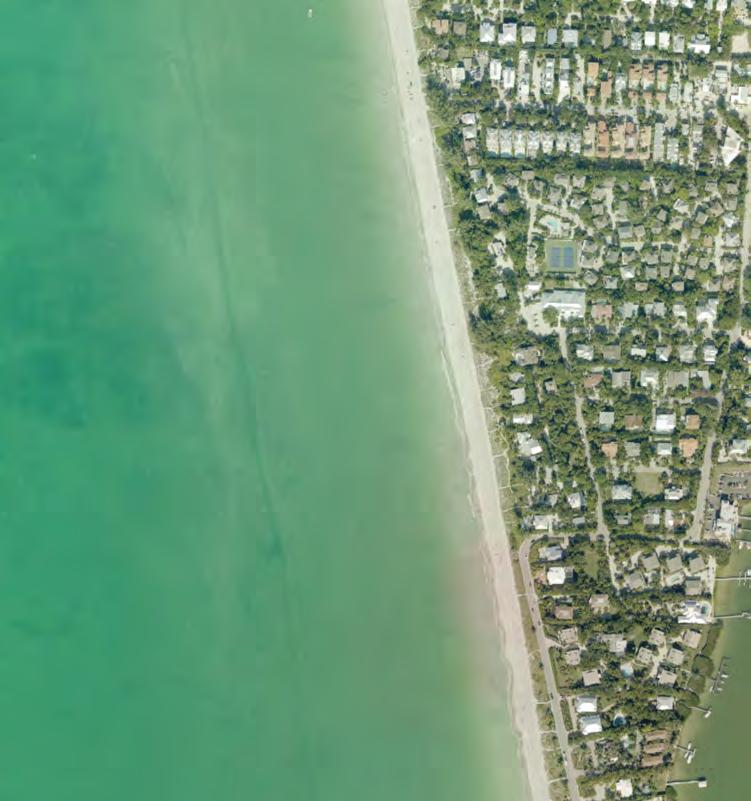
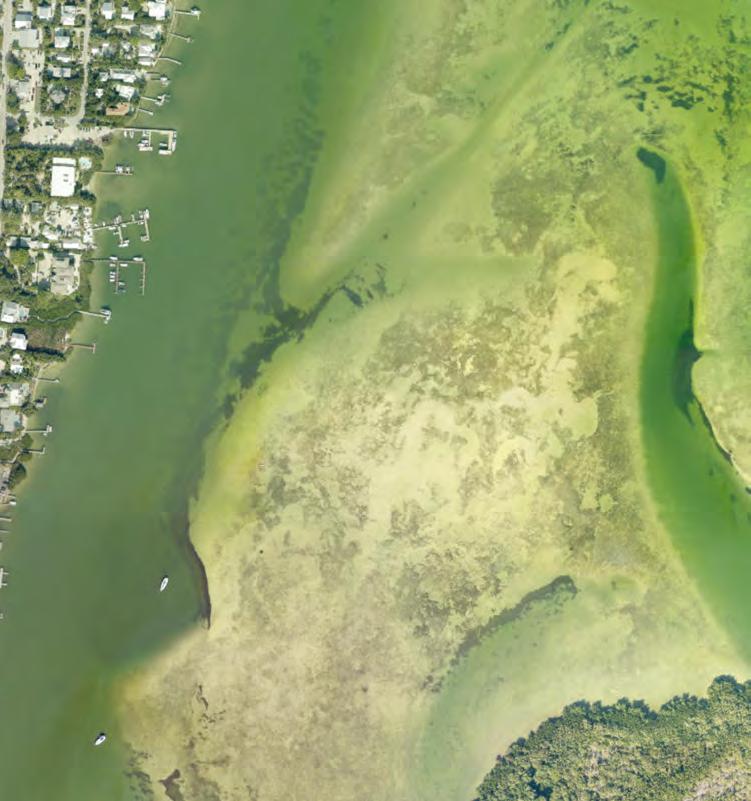
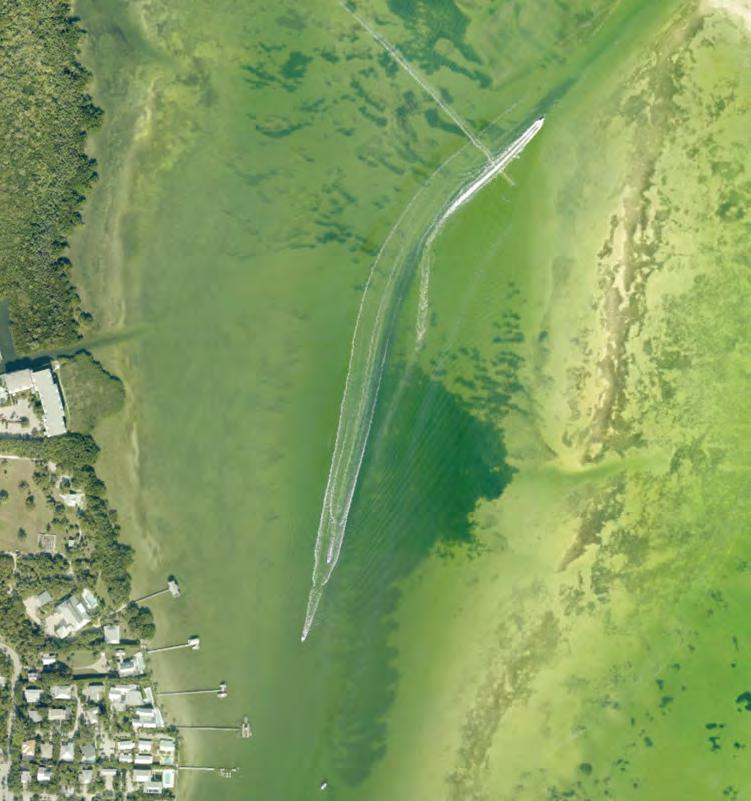
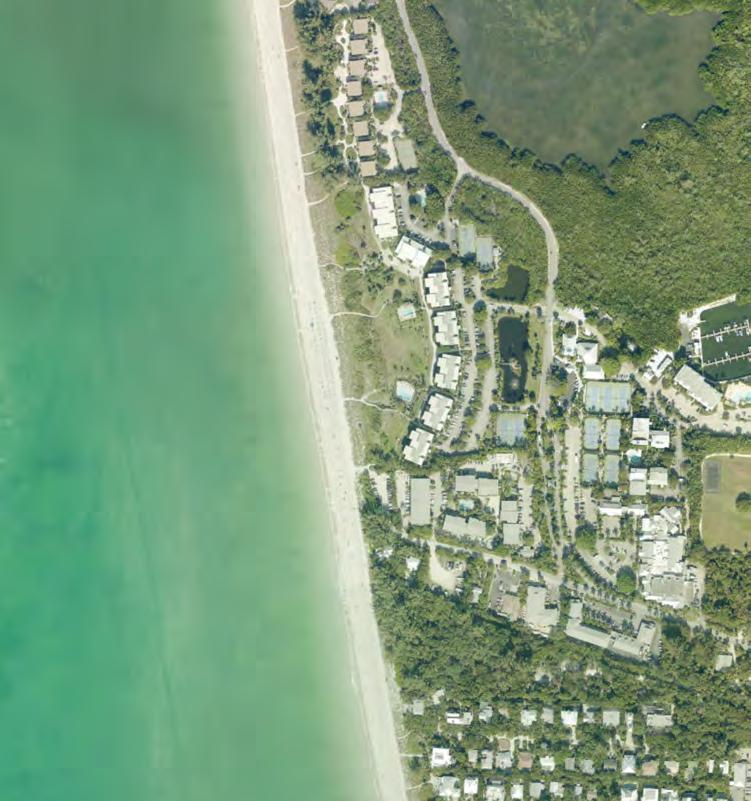
Tropical Storm 2022 (Current)


Legend 2022 (Current) Tropical Storm Flooding Depths (feet) 0.01 - 0.25 0.26 - 0.50 0.51 - 0.75 0.76 - 1.00 1.01 - 1.50 1.51 - 2.00 2.01 - 2.50 2.51 - 3.00 3.01 - 4.00 4.01+ ± 0 0.1 0.2 0.3 0.4 0.05 Miles
Storm Surge Flooding Extents


Captiva Island (Middle Segment)


Tropical Storm 2040 (NOAA Int-Low)


Legend 2040 (Int-Low) Tropical Storm Flooding Depths (feet) 0.01 - 0.25 0.26 - 0.50 0.51 - 0.75 0.76 - 1.00 1.01 - 1.50 1.51 - 2.00 2.01 - 2.50 2.51 - 3.00 3.01 - 4.00 4.01+ ± 0 0.1 0.2 0.3 0.4 0.05 Miles
Storm Surge Flooding Extents


Captiva Island (Middle Segment)


Tropical Storm 2040 (NOAA Int-High)


Legend 2040 (Int-High) Tropical Storm Flooding Depths (feet) 0.01 - 0.25 0.26 - 0.50 0.51 - 0.75 0.76 - 1.00 1.01 - 1.50 1.51 - 2.00 2.01 - 2.50 2.51 - 3.00 3.01 - 4.00 4.01+ ± 0 0.1 0.2 0.3 0.4 0.05 Miles
Storm Surge Flooding Extents


Captiva Island (Middle Segment)


Tropical Storm 2070 (NOAA Int-Low)


Legend 2070 (Int-Low) Tropical Storm Flooding Depths (feet) 0.01 - 0.25 0.26 - 0.50 0.51 - 0.75 0.76 - 1.00 1.01 - 1.50 1.51 - 2.00 2.01 - 2.50 2.51 - 3.00 3.01 - 4.00 4.01+ ± 0 0.1 0.2 0.3 0.4 0.05 Miles
Storm Surge Flooding Extents


Captiva Island (Middle Segment)


Tropical Storm 2070 (NOAA Int-High)

Legend 2070 (Int-High) Tropical Storm Flooding Depths (feet) 0.01 - 0.25 0.26 - 0.50 0.51 - 0.75 0.76 - 1.00 1.01 - 1.50 1.51 - 2.00 2.01 - 2.50 2.51 - 3.00 3.01 - 4.00 4.01+ ± 0 0.1 0.2 0.3 0.4 0.05 Miles
page is intentionally blank
This
Storm Surge Flooding Extents


Captiva Island (Middle Segment)


Category 1 Hurricane 2022 (Current)


Legend 2022 (Current) Category 1 Hurricane Flooding Depths (feet) 0.01 - 0.25 0.26 - 0.50 0.51 - 0.75 0.76 - 1.00 1.01 - 1.50 1.51 - 2.00 2.01 - 2.50 2.51 - 3.00 3.01 - 4.00 4.01+ ± 0 0.1 0.2 0.3 0.4 0.05 Miles
Storm Surge Flooding Extents


Captiva Island (Middle Segment)


Category 1 Hurricane 2040 (NOAA Int-Low)


Legend 2040 (Int-Low) Category 1 Hurricane Flooding Depths (feet) 0.01 - 0.25 0.26 - 0.50 0.51 - 0.75 0.76 - 1.00 1.01 - 1.50 1.51 - 2.00 2.01 - 2.50 2.51 - 3.00 3.01 - 4.00 4.01+ ± 0 0.1 0.2 0.3 0.4 0.05 Miles
Storm Surge Flooding Extents


Captiva Island (Middle Segment)

Category 1 Hurricane 2040 (NOAA Int-High)


Legend 2040 (Int-High) Category 1 Hurricane Flooding Depths (feet) 0.01 - 0.25 0.26 - 0.50 0.51 - 0.75 0.76 - 1.00 1.01 - 1.50 1.51 - 2.00 2.01 - 2.50 2.51 - 3.00 3.01 - 4.00 4.01+ ± 0 0.1 0.2 0.3 0.4 0.05 Miles
Storm Surge Flooding Extents


Captiva Island (Middle Segment)


Category 1 Hurricane 2070 (NOAA Int-Low)


Legend 2070 (Int-Low) Category 1 Hurricane Flooding Depths (feet) 0.01 - 0.25 0.26 - 0.50 0.51 - 0.75 0.76 - 1.00 1.01 - 1.50 1.51 - 2.00 2.01 - 2.50 2.51 - 3.00 3.01 - 4.00 4.01+ ± 0 0.1 0.2 0.3 0.4 0.05 Miles
Storm Surge Flooding Extents


Captiva Island (Middle Segment)


Category 1 Hurricane 2070 (NOAA Int-High)


Legend 2070 (Int-High) Category 1 Hurricane Flooding Depths (feet) 0.01 - 0.25 0.26 - 0.50 0.51 - 0.75 0.76 - 1.00 1.01 - 1.50 1.51 - 2.00 2.01 - 2.50 2.51 - 3.00 3.01 - 4.00 4.01+ ± 0 0.1 0.2 0.3 0.4 0.05 Miles
page is intentionally blank
This
Storm Surge Flooding Extents


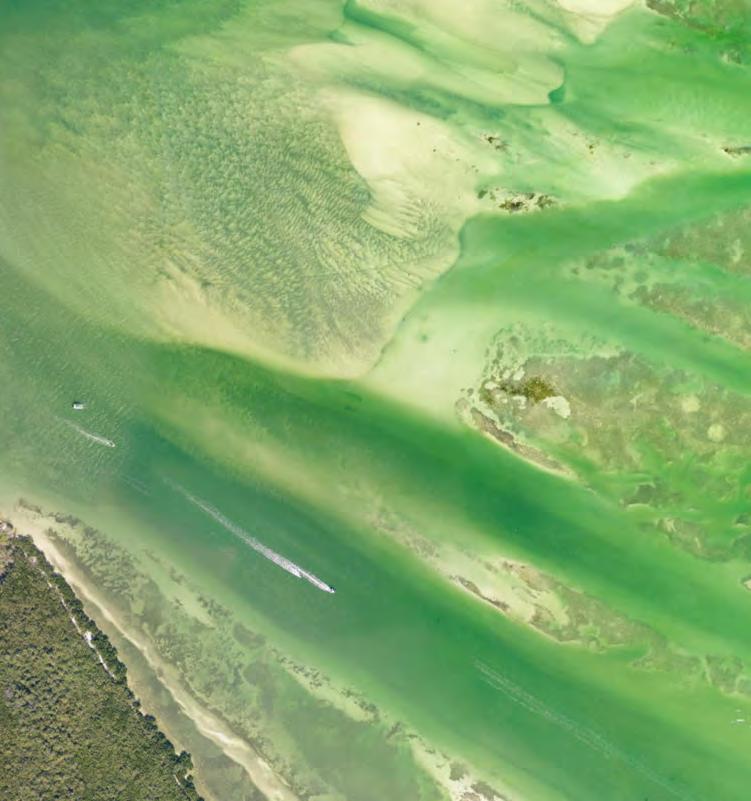
Captiva Island (North Segment)
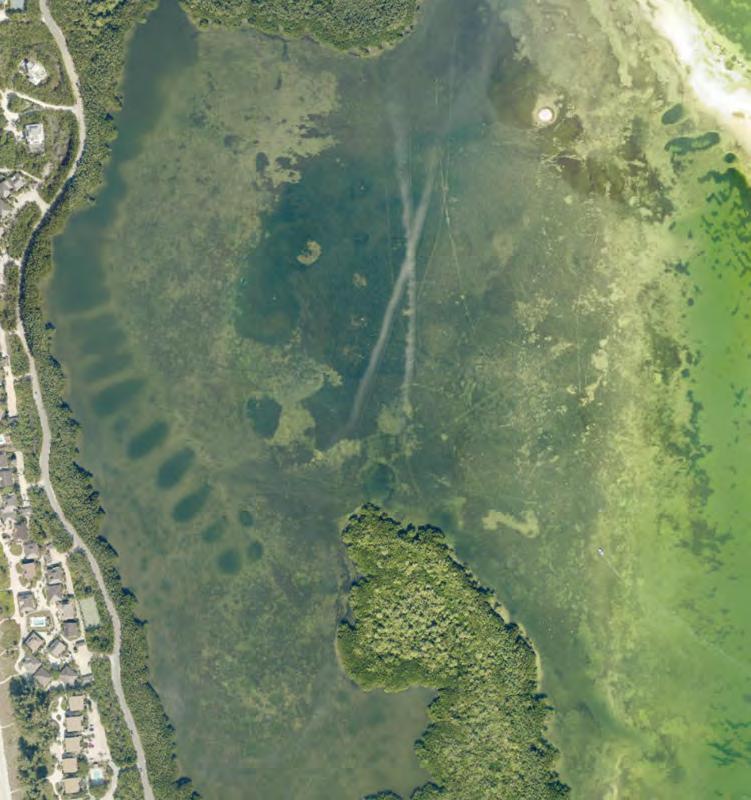
Tropical Storm 2022 (Current)


±
Legend 2022 (Current) Tropical Storm Flooding Depths (feet) 0.01 - 0.25 0.26 - 0.50 0.51 - 0.75 0.76 - 1.00 1.01 - 1.50 1.51 - 2.00 2.01 - 2.50 2.51 - 3.00 3.01 - 4.00 4.01+ 0 0.1 0.2 0.3 0.4 0.05 Miles
Storm Surge Flooding Extents


Captiva Island (North Segment)


Tropical Storm 2040 (NOAA Int-Low)


±
Legend 2040 (Int-Low) Tropical Storm Flooding Depths (feet) 0.01 - 0.25 0.26 - 0.50 0.51 - 0.75 0.76 - 1.00 1.01 - 1.50 1.51 - 2.00 2.01 - 2.50 2.51 - 3.00 3.01 - 4.00 4.01+ 0 0.1 0.2 0.3 0.4 0.05 Miles
Storm Surge Flooding Extents


Captiva Island (North Segment)


Tropical Storm 2040 (NOAA Int-High)


±
Legend 2040 (Int-High) Tropical Storm Flooding Depths (feet) 0.01 - 0.25 0.26 - 0.50 0.51 - 0.75 0.76 - 1.00 1.01 - 1.50 1.51 - 2.00 2.01 - 2.50 2.51 - 3.00 3.01 - 4.00 4.01+ 0 0.1 0.2 0.3 0.4 0.05 Miles
Storm Surge Flooding Extents


Captiva Island (North Segment)


Tropical Storm 2070 (NOAA Int-Low)


±
Legend 2070 (Int-Low) Tropical Storm Flooding Depths (feet) 0.01 - 0.25 0.26 - 0.50 0.51 - 0.75 0.76 - 1.00 1.01 - 1.50 1.51 - 2.00 2.01 - 2.50 2.51 - 3.00 3.01 - 4.00 4.01+ 0 0.1 0.2 0.3 0.4 0.05 Miles
Storm Surge Flooding Extents


Captiva Island (North Segment)


Tropical Storm 2070 (NOAA Int-High)


±
Legend 2070 (Int-High) Tropical Storm Flooding Depths (feet) 0.01 - 0.25 0.26 - 0.50 0.51 - 0.75 0.76 - 1.00 1.01 - 1.50 1.51 - 2.00 2.01 - 2.50 2.51 - 3.00 3.01 - 4.00 4.01+ 0 0.1 0.2 0.3 0.4 0.05 Miles
page is intentionally blank
This
Storm Surge Flooding Extents Captiva Island (North Segment)


Category 1 Hurricane 2022 (Current)


±
Legend 2022 (Current) Category 1 Hurricane Flooding Depths (feet) 0.01 - 0.25 0.26 - 0.50 0.51 - 0.75 0.76 - 1.00 1.01 - 1.50 1.51 - 2.00 2.01 - 2.50 2.51 - 3.00 3.01 - 4.00 4.01+ 0 0.1 0.2 0.3 0.4 0.05 Miles
Storm Surge Flooding Extents Captiva Island (North Segment)


Category 1 Hurricane 2040 (NOAA Int-Low)


±
Legend 2040 (Int-Low) Category 1 Hurricane Flooding Depths (feet) 0.01 - 0.25 0.26 - 0.50 0.51 - 0.75 0.76 - 1.00 1.01 - 1.50 1.51 - 2.00 2.01 - 2.50 2.51 - 3.00 3.01 - 4.00 4.01+ 0 0.1 0.2 0.3 0.4 0.05 Miles
Storm Surge Flooding Extents


Captiva Island (North Segment)
Category 1 Hurricane 2040 (NOAA Int-High)


±
Legend 2040 (Int-High) Category 1 Hurricane Flooding Depths (feet) 0.01 - 0.25 0.26 - 0.50 0.51 - 0.75 0.76 - 1.00 1.01 - 1.50 1.51 - 2.00 2.01 - 2.50 2.51 - 3.00 3.01 - 4.00 4.01+ 0 0.1 0.2 0.3 0.4 0.05 Miles
Storm Surge Flooding Extents Captiva Island (North Segment)


Category 1 Hurricane 2070 (NOAA Int-Low)


±
Legend 2070 (Int-Low) Category 1 Hurricane Flooding Depths (feet) 0.01 - 0.25 0.26 - 0.50 0.51 - 0.75 0.76 - 1.00 1.01 - 1.50 1.51 - 2.00 2.01 - 2.50 2.51 - 3.00 3.01 - 4.00 4.01+ 0 0.1 0.2 0.3 0.4 0.05 Miles
Storm Surge Flooding Extents


Captiva Island (North Segment)
Category 1 Hurricane 2070 (NOAA Int-High)


±
Legend 2070 (Int-High) Category 1 Hurricane Flooding Depths (feet) 0.01 - 0.25 0.26 - 0.50 0.51 - 0.75 0.76 - 1.00 1.01 - 1.50 1.51 - 2.00 2.01 - 2.50 2.51 - 3.00 3.01 - 4.00 4.01+ 0 0.1 0.2 0.3 0.4 0.05 Miles
page is intentionally blank
This
Appendix B.
Roadway Segment Divisions
Roadway Sections Captiva Island (South Segment)
2 7 8 6 5 4 3 1 ±
0 0.1 0.2 0.3 0.4 0.05 Miles
Roadway Sections Captiva Island (Middle Segment)
16 15 14 13 12 9 11 10 ±
0 0.1 0.2 0.3 0.4 0.05 Miles
23 22 21 20 19 18 24 17 16 ±
0 0.1 0.2 0.3 0.4 0.05 Miles
Roadway Sections Captiva Island (North Segment)
page is intentionally blank
This
page is intentionally blank
This
Appendix C.
Tidal Flooding Inundation Maps
page is intentionally blank
This
Tidal Flooding Depths Captiva Island (South Segment) 2022 (Current)


± Legend Permanent Inundation Flooding Depth (feet) 0.01 - 0.25 0.26 - 0.50 0.51 - 0.75 0.76 - 1.00 1.01 - 1.50 1.51 - 2.00 2.01 - 2.50 2.51 - 3.00 3.01 - 4.00 4.01+ 0 0.1 0.2 0.3 0.4 0.05 Miles
Tidal Flooding Depths


Captiva Island (South Segment) 2040 (NOAA Int-low)


± Legend Permanent Inundation Flooding Depth (feet) 0.01 - 0.25 0.26 - 0.50 0.51 - 0.75 0.76 - 1.00 1.01 - 1.50 1.51 - 2.00 2.01 - 2.50 2.51 - 3.00 3.01 - 4.00 4.01+ 0 0.1 0.2 0.3 0.4 0.05 Miles
Tidal Flooding Depths


Captiva Island (South Segment) 2040 (NOAA Int-high)


± Legend Permanent Inundation Flooding Depth (feet) 0.01 - 0.25 0.26 - 0.50 0.51 - 0.75 0.76 - 1.00 1.01 - 1.50 1.51 - 2.00 2.01 - 2.50 2.51 - 3.00 3.01 - 4.00 4.01+ 0 0.1 0.2 0.3 0.4 0.05 Miles
Tidal Flooding Depths


Captiva Island (South Segment) 2070 (NOAA Int-low)


± Legend Permanent Inundation Flooding Depth (feet) 0.01 - 0.25 0.26 - 0.50 0.51 - 0.75 0.76 - 1.00 1.01 - 1.50 1.51 - 2.00 2.01 - 2.50 2.51 - 3.00 3.01 - 4.00 4.01+ 0 0.1 0.2 0.3 0.4 0.05 Miles
Tidal Flooding Depths


Captiva Island (South Segment) 2070 (NOAA Int-High)


± Legend Permanent Inundation Flooding Depth (feet) 0.01 - 0.25 0.26 - 0.50 0.51 - 0.75 0.76 - 1.00 1.01 - 1.50 1.51 - 2.00 2.01 - 2.50 2.51 - 3.00 3.01 - 4.00 4.01+ 0 0.1 0.2 0.3 0.4 0.05 Miles
page is intentionally blank
This
Tidal Flooding Depths


Captiva Island (Middle Segment) 2022 (Current)


Legend Permanent Inundation Flooding Depth (feet) 0.01 - 0.25 0.26 - 0.50 0.51 - 0.75 0.76 - 1.00 1.01 - 1.50 1.51 - 2.00 2.01 - 2.50 2.51 - 3.00 ± 0 0.1 0.2 0.3 0.4 0.05 Miles
Tidal Flooding Depths


Captiva Island (Middle Segment) 2040 (NOAA Int-low)


Legend Permanent Inundation Flooding Depth (feet) 0.01 - 0.25 0.26 - 0.50 0.51 - 0.75 0.76 - 1.00 1.01 - 1.50 1.51 - 2.00 2.01 - 2.50 2.51 - 3.00 ± 0 0.1 0.2 0.3 0.4 0.05 Miles
Tidal Flooding Depths


Captiva Island (Middle Segment) 2040 (NOAA Int-high)


Legend Permanent Inundation Flooding Depth (feet) 0.01 - 0.25 0.26 - 0.50 0.51 - 0.75 0.76 - 1.00 1.01 - 1.50 1.51 - 2.00 2.01 - 2.50 2.51 - 3.00 ± 0 0.1 0.2 0.3 0.4 0.05 Miles
Tidal Flooding Depths


Captiva Island (Middle Segment) 2070 (NOAA Int-low)


Legend Permanent Inundation Flooding Depth (feet) 0.01 - 0.25 0.26 - 0.50 0.51 - 0.75 0.76 - 1.00 1.01 - 1.50 1.51 - 2.00 2.01 - 2.50 2.51 - 3.00 ± 0 0.1 0.2 0.3 0.4 0.05 Miles
Tidal Flooding Depths

Captiva Island (Middle Segment) 2070 (NOAA Int-High)


Legend Permanent Inundation Flooding Depth (feet) 0.01 - 0.25 0.26 - 0.50 0.51 - 0.75 0.76 - 1.00 1.01 - 1.50 1.51 - 2.00 2.01 - 2.50 2.51 - 3.00 ± 0 0.1 0.2 0.3 0.4 0.05 Miles
page is intentionally blank
This
Tidal Flooding Depths


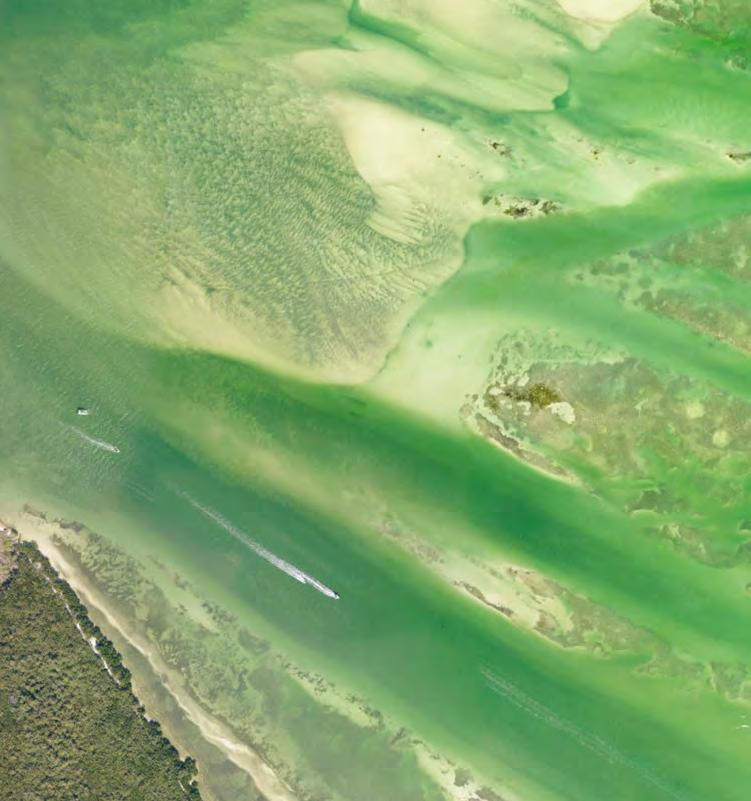
Captiva Island (North Segment) 2022 (Current)


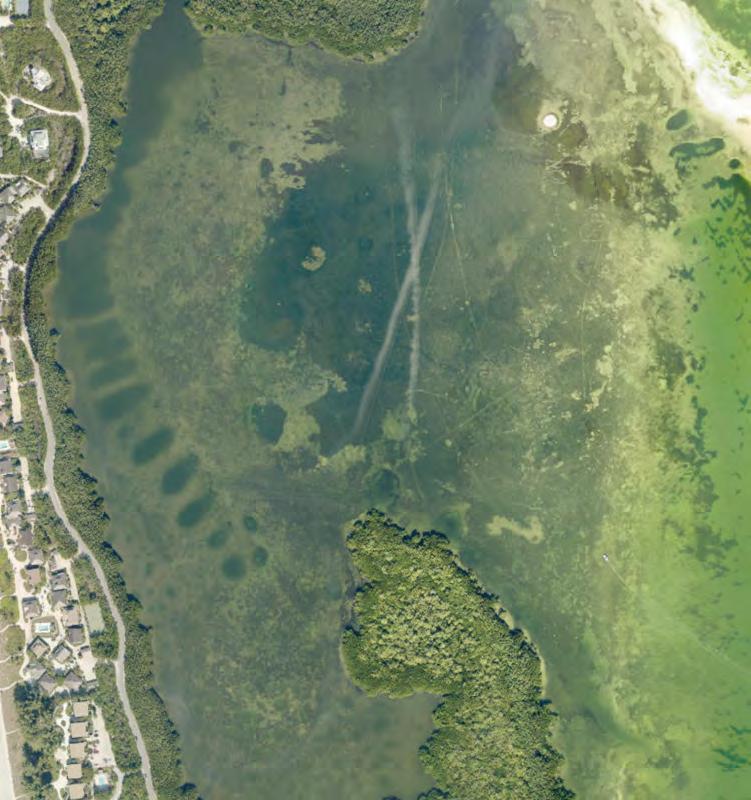
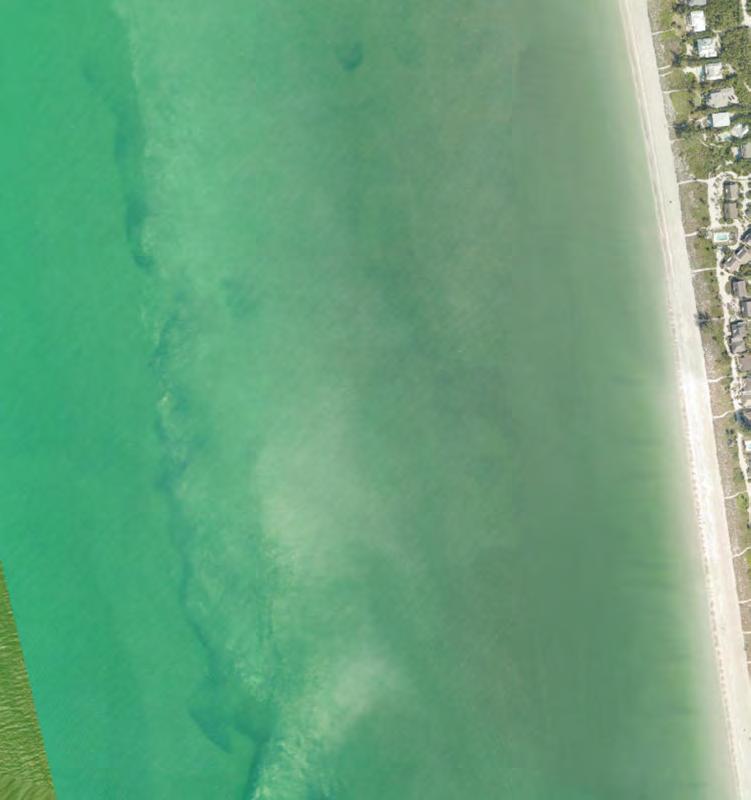
±
Legend Permanent Inundation Flooding Depth (feet) 0.01 - 0.25 0.26 - 0.50 0.51 - 0.75 0.76 - 1.00 1.01 - 1.50 1.51 - 2.00 2.01 - 2.50 2.51 - 3.00 3.01 - 4.00 4.01+ 0 0.1 0.2 0.3 0.4 0.05 Miles
Tidal Flooding Depths


Captiva Island (North Segment) 2040 (NOAA Int-Low)


±
Legend Permanent Inundation Flooding Depth (feet) 0.01 - 0.25 0.26 - 0.50 0.51 - 0.75 0.76 - 1.00 1.01 - 1.50 1.51 - 2.00 2.01 - 2.50 2.51 - 3.00 3.01 - 4.00 4.01+ 0 0.1 0.2 0.3 0.4 0.05 Miles
Tidal Flooding Depths


Captiva Island (North Segment) 2040 (NOAA Int-High)


±
Legend Permanent Inundation Flooding Depth (feet) 0.01 - 0.25 0.26 - 0.50 0.51 - 0.75 0.76 - 1.00 1.01 - 1.50 1.51 - 2.00 2.01 - 2.50 2.51 - 3.00 3.01 - 4.00 4.01+ 0 0.1 0.2 0.3 0.4 0.05 Miles
Tidal Flooding Depths


Captiva Island (North Segment) 2070 (NOAA Int-Low)


±
Legend Permanent Inundation Flooding Depth (feet) 0.01 - 0.25 0.26 - 0.50 0.51 - 0.75 0.76 - 1.00 1.01 - 1.50 1.51 - 2.00 2.01 - 2.50 2.51 - 3.00 3.01 - 4.00 4.01+ 0 0.1 0.2 0.3 0.4 0.05 Miles
Tidal Flooding Depths


Captiva Island (North Segment) 2070 (NOAA Int-High)


±
Legend Permanent Inundation Flooding Depth (feet) 0.01 - 0.25 0.26 - 0.50 0.51 - 0.75 0.76 - 1.00 1.01 - 1.50 1.51 - 2.00 2.01 - 2.50 2.51 - 3.00 3.01 - 4.00 4.01+ 0 0.1 0.2 0.3 0.4 0.05 Miles
page is intentionally blank
This
Tidal Flooding Days
Captiva Island (South Segment) 2022 (Current)


± Legend # of Flood Days 1-5 Days 6-10 Days 11-15 Days 16-20 Days 21-30 Days 31-60 Days 61-90 Days 91-182 Days 183-364 Days 365 Days 0 0.1 0.2 0.3 0.4 0.05 Miles
Tidal Flooding Days


Captiva Island (South Segment) 2040 (NOAA Int-High)


± Legend # of Flood Days 1-5 Days 6-10 Days 11-15 Days 16-20 Days 21-30 Days 31-60 Days 61-90 Days 91-182 Days 183-364 Days 365 Days 0 0.1 0.2 0.3 0.4 0.05 Miles
Tidal Flooding Days


Captiva Island (South Segment) 2040 (NOAA Int-Low)


± Legend # of Flood Days 1-5 Days 6-10 Days 11-15 Days 16-20 Days 21-30 Days 31-60 Days 61-90 Days 91-182 Days 183-364 Days 365 Days 0 0.1 0.2 0.3 0.4 0.05 Miles
Tidal Flooding Days

Captiva Island (South Segment) 2070 (NOAA Int-High)


± Legend # of Flood Days 1-5 Days 6-10 Days 11-15 Days 16-20 Days 21-30 Days 31-60 Days 61-90 Days 91-182 Days 183-364 Days 365 Days 0 0.1 0.2 0.3 0.4 0.05 Miles
Tidal Flooding Days


Captiva Island (South Segment) 2070 (NOAA Int-Low)


± Legend # of Flood Days 1-5 Days 6-10 Days 11-15 Days 16-20 Days 21-30 Days 31-60 Days 61-90 Days 91-182 Days 183-364 Days 365 Days 0 0.1 0.2 0.3 0.4 0.05 Miles
page is intentionally blank
This
Tidal Flooding Days
Captiva Island (Middle Segment) 2022 (Current)


Legend # of Flood Days 1-5 Days 6-10 Days 11-15 Days 16-20 Days 21-30 Days 31-60 Days 61-90 Days 91-182 Days 183-364 Days 365 Days ± 0 0.1 0.2 0.3 0.4 0.05 Miles
Tidal Flooding Days

Captiva Island (Middle Segment) 2040 (NOAA Int-Low)


Legend # of Flood Days 1-5 Days 6-10 Days 11-15 Days 16-20 Days 21-30 Days 31-60 Days 61-90 Days 91-182 Days 183-364 Days 365 Days ± 0 0.1 0.2 0.3 0.4 0.05 Miles
Tidal Flooding Days

Captiva Island (Middle Segment) 2040 (NOAA Int-High)


Legend # of Flood Days 1-5 Days 6-10 Days 11-15 Days 16-20 Days 21-30 Days 31-60 Days 61-90 Days 91-182 Days 183-364 Days 365 Days ± 0 0.1 0.2 0.3 0.4 0.05 Miles
Tidal Flooding Days

Captiva Island (Middle Segment) 2070 (NOAA Int-Low)


Legend # of Flood Days 1-5 Days 6-10 Days 11-15 Days 16-20 Days 21-30 Days 31-60 Days 61-90 Days 91-182 Days 183-364 Days 365 Days ± 0 0.1 0.2 0.3 0.4 0.05 Miles
Tidal Flooding Days

Captiva Island (Middle Segment) 2070 (NOAA Int-High)


Legend # of Flood Days 1-5 Days 6-10 Days 11-15 Days 16-20 Days 21-30 Days 31-60 Days 61-90 Days 91-182 Days 183-364 Days 365 Days ± 0 0.1 0.2 0.3 0.4 0.05 Miles
page is intentionally blank
This
Tidal Flooding Days


Captiva Island (North Segment) 2022 (Current)


±
Legend # of Flood Days 1-5 Days 6-10 Days 11-15 Days 16-20 Days 21-30 Days 31-60 Days 61-90 Days 91-182 Days 183-364 Days 365 Days 0 0.1 0.2 0.3 0.4 0.05 Miles
Tidal Flooding Days


Captiva Island (North Segment) 2040 (NOAA Int-Low)


±
Legend # of Flood Days 1-5 Days 6-10 Days 11-15 Days 16-20 Days 21-30 Days 31-60 Days 61-90 Days 91-182 Days 183-364 Days 365 Days 0 0.1 0.2 0.3 0.4 0.05 Miles
Tidal Flooding Days


Captiva Island (North Segment) 2040 (NOAA Int-High)


±
Legend # of Flood Days 1-5 Days 6-10 Days 11-15 Days 16-20 Days 21-30 Days 31-60 Days 61-90 Days 91-182 Days 183-364 Days 365 Days 0 0.1 0.2 0.3 0.4 0.05 Miles
Tidal Flooding Days


Captiva Island (North Segment) 2070 (NOAA Int-Low)


±
Legend # of Flood Days 1-5 Days 6-10 Days 11-15 Days 16-20 Days 21-30 Days 31-60 Days 61-90 Days 91-182 Days 183-364 Days 365 Days 0 0.1 0.2 0.3 0.4 0.05 Miles
Tidal Flooding Days


Captiva Island (North Segment) 2070 (NOAA Int-High)


±
Legend # of Flood Days 1-5 Days 6-10 Days 11-15 Days 16-20 Days 21-30 Days 31-60 Days 61-90 Days 91-182 Days 183-364 Days 365 Days 0 0.1 0.2 0.3 0.4 0.05 Miles
page is intentionally blank
This
Appendix D.
Precipitation Inundation Maps
page is intentionally blank
This
Precipitation Flooding Extents Captiva Island (South Segment) 25-Year, 1-Day Storm 2022 (Current)


±
Legend 2022 (Current) 25-Year, 1-Day Storm Flooding Depths (feet) 0.01 - 0.25 0.26 - 0.50 0.51 - 0.75 0.76 - 1.00 1.01 - 1.50 1.51 - 2.00 2.01 - 2.50 2.51 - 3.00 3.01 - 4.00 4.01+ 0 0.1 0.2 0.3 0.4 0.05 Miles
Precipitation Flooding Extents Captiva Island (South Segment) 25-Year, 1-Day Storm

2040 (NOAA Int-Low)


±
Legend 2040 (Int-Low) 25-Year, 1-Day Storm Flooding Depths (feet) 0.01 - 0.25 0.26 - 0.50 0.51 - 0.75 0.76 - 1.00 1.01 - 1.50 1.51 - 2.00 2.01 - 2.50 2.51 - 3.00 3.01 - 4.00 4.01+ 0 0.1 0.2 0.3 0.4 0.05 Miles
Precipitation Flooding Extents Captiva Island (South Segment) 25-Year, 1-Day Storm

2040 (NOAA Int-High)


±
Legend 2040 (Int-High) 25-Year, 1-Day Storm Flooding Depths (feet) 0.01 - 0.25 0.26 - 0.50 0.51 - 0.75 0.76 - 1.00 1.01 - 1.50 1.51 - 2.00 2.01 - 2.50 2.51 - 3.00 3.01 - 4.00 4.01+ 0 0.1 0.2 0.3 0.4 0.05 Miles
Precipitation Flooding Extents Captiva Island (South Segment) 25-Year, 1-Day Storm

2070 (NOAA Int-Low)


±
Legend 2070 (Int-Low) 25-Year, 1-Day Storm Flooding Depths (feet) 0.01 - 0.25 0.26 - 0.50 0.51 - 0.75 0.76 - 1.00 1.01 - 1.50 1.51 - 2.00 2.01 - 2.50 2.51 - 3.00 3.01 - 4.00 4.01+ 0 0.1 0.2 0.3 0.4 0.05 Miles
Precipitation Flooding Extents Captiva Island (South Segment) 25-Year, 1-Day Storm
2070 (NOAA Int-High)


±
Legend 2070 (Int-High) 25-Year, 1-Day Storm Flooding Depths (feet) 0.01 - 0.25 0.26 - 0.50 0.51 - 0.75 0.76 - 1.00 1.01 - 1.50 1.51 - 2.00 2.01 - 2.50 2.51 - 3.00 3.01 - 4.00 4.01+ 0 0.1 0.2 0.3 0.4 0.05 Miles
page is intentionally blank
This
Precipitation Flooding Extents Captiva Island (Middle Segment) 25-Year, 1-Day Storm 2022 (Current)


±
Legend 2022 (Current) 25-Year, 1-Day Storm Flooding Depths (feet) 0.01 - 0.25 0.26 - 0.50 0.51 - 0.75 0.76 - 1.00 1.01 - 1.50 1.51 - 2.00 2.01 - 2.50 2.51 - 3.00 3.01 - 4.00 4.01+ 0 0.1 0.2 0.3 0.4 0.05 Miles
Precipitation Flooding Extents Captiva Island (Middle Segment) 25-Year, 1-Day Storm

2040 (NOAA Int-Low)


±
Legend 2040 (Int-Low) 25-Year, 1-Day Storm Flooding Depths (feet) 0.01 - 0.25 0.26 - 0.50 0.51 - 0.75 0.76 - 1.00 1.01 - 1.50 1.51 - 2.00 2.01 - 2.50 2.51 - 3.00 3.01 - 4.00 4.01+ 0 0.1 0.2 0.3 0.4 0.05 Miles
Precipitation Flooding Extents

Captiva Island (Middle Segment) 25-Year, 1-Day Storm
2040 (NOAA Int-High)


±
Legend 2040 (Int-High) 25-Year, 1-Day Storm Flooding Depths (feet) 0.01 - 0.25 0.26 - 0.50 0.51 - 0.75 0.76 - 1.00 1.01 - 1.50 1.51 - 2.00 2.01 - 2.50 2.51 - 3.00 3.01 - 4.00 4.01+ 0 0.1 0.2 0.3 0.4 0.05 Miles
Precipitation Flooding Extents Captiva Island (Middle Segment) 25-Year, 1-Day Storm


2070 (NOAA Int-Low)


±
Legend 2070 (Int-Low) 25-Year, 1-Day Storm Flooding Depths (feet) 0.01 - 0.25 0.26 - 0.50 0.51 - 0.75 0.76 - 1.00 1.01 - 1.50 1.51 - 2.00 2.01 - 2.50 2.51 - 3.00 3.01 - 4.00 4.01+ 0 0.1 0.2 0.3 0.4 0.05 Miles
Precipitation Flooding Extents Captiva Island (Middle Segment) 25-Year, 1-Day Storm

2070 (NOAA Int-High)


±
Legend 2070 (Int-High) 25-Year, 1-Day Storm Flooding Depths (feet) 0.01 - 0.25 0.26 - 0.50 0.51 - 0.75 0.76 - 1.00 1.01 - 1.50 1.51 - 2.00 2.01 - 2.50 2.51 - 3.00 3.01 - 4.00 4.01+ 0 0.1 0.2 0.3 0.4 0.05 Miles
page is intentionally blank
This
Precipitation Flooding Extents Captiva Island (North Segment) 25-Year, 1-Day Storm 2022 (Current)


±
Legend 2022 (Current) 25-Year, 1-Day Storm Flooding Depths (feet) 0.01 - 0.25 0.26 - 0.50 0.51 - 0.75 0.76 - 1.00 1.01 - 1.50 1.51 - 2.00 2.01 - 2.50 2.51 - 3.00 3.01 - 4.00 4.01+ 0 0.1 0.2 0.3 0.4 0.05 Miles
Precipitation Flooding Extents Captiva Island (North Segment) 25-Year, 1-Day Storm
2040 (NOAA Int-Low)


±
Legend 2040 (Int-Low) 25-Year, 1-Day Storm Flooding Depths (feet) 0.01 - 0.25 0.26 - 0.50 0.51 - 0.75 0.76 - 1.00 1.01 - 1.50 1.51 - 2.00 2.01 - 2.50 2.51 - 3.00 3.01 - 4.00 4.01+ 0 0.1 0.2 0.3 0.4 0.05 Miles
Precipitation Flooding Extents Captiva Island (North Segment) 25-Year, 1-Day Storm
2040 (NOAA Int-High)


±
Legend 2040 (Int-High) 25-Year, 1-Day Storm Flooding Depths (feet) 0.01 - 0.25 0.26 - 0.50 0.51 - 0.75 0.76 - 1.00 1.01 - 1.50 1.51 - 2.00 2.01 - 2.50 2.51 - 3.00 3.01 - 4.00 4.01+ 0 0.1 0.2 0.3 0.4 0.05 Miles
Precipitation Flooding Extents Captiva Island (North Segment) 25-Year, 1-Day Storm

2070 (NOAA Int-Low)


±
Legend 2070 (Int-Low) 25-Year, 1-Day Storm Flooding Depths (feet) 0.01 - 0.25 0.26 - 0.50 0.51 - 0.75 0.76 - 1.00 1.01 - 1.50 1.51 - 2.00 2.01 - 2.50 2.51 - 3.00 3.01 - 4.00 4.01+ 0 0.1 0.2 0.3 0.4 0.05 Miles
Precipitation Flooding Extents Captiva Island (North Segment) 25-Year, 1-Day Storm
2070 (NOAA Int-High)


±
Legend 2070 (Int-High) 25-Year, 1-Day Storm Flooding Depths (feet) 0.01 - 0.25 0.26 - 0.50 0.51 - 0.75 0.76 - 1.00 1.01 - 1.50 1.51 - 2.00 2.01 - 2.50 2.51 - 3.00 3.01 - 4.00 4.01+ 0 0.1 0.2 0.3 0.4 0.05 Miles
page is intentionally blank
This
Precipitation Flooding Extents Captiva Island (South Segment) 100-Year, 1-Day Storm 2022 (Current)


±
Legend 2022 (Current) 100-Year, 1-Day Storm Flooding Depths (feet) 0.01 - 0.25 0.26 - 0.50 0.51 - 0.75 0.76 - 1.00 1.01 - 1.50 1.51 - 2.00 2.01 - 2.50 2.51 - 3.00 3.01 - 4.00 4.01+ 0 0.1 0.2 0.3 0.4 0.05 Miles
Precipitation Flooding Extents Captiva Island (South Segment) 100-Year, 1-Day Storm

2040 (NOAA Int-Low)


±
Legend 2040 (Int-Low) 100-Year, 1-Day Storm Flooding Depths (feet) 0.01 - 0.25 0.26 - 0.50 0.51 - 0.75 0.76 - 1.00 1.01 - 1.50 1.51 - 2.00 2.01 - 2.50 2.51 - 3.00 3.01 - 4.00 4.01+ 0 0.1 0.2 0.3 0.4 0.05 Miles
Precipitation Flooding Extents
Captiva Island (South Segment) 100-Year, 1-Day Storm
2040 (NOAA Int-High)


±
Legend 2040 (Int-High) 100-Year, 1-Day Storm Flooding Depths (feet) 0.01 - 0.25 0.26 - 0.50 0.51 - 0.75 0.76 - 1.00 1.01 - 1.50 1.51 - 2.00 2.01 - 2.50 2.51 - 3.00 3.01 - 4.00 4.01+ 0 0.1 0.2 0.3 0.4 0.05 Miles
Precipitation Flooding Extents Captiva Island (South Segment) 100-Year, 1-Day Storm

2070 (NOAA Int-Low)


±
Legend 2070 (Int-Low) 100-Year, 1-Day Storm Flooding Depths (feet) 0.01 - 0.25 0.26 - 0.50 0.51 - 0.75 0.76 - 1.00 1.01 - 1.50 1.51 - 2.00 2.01 - 2.50 2.51 - 3.00 3.01 - 4.00 4.01+ 0 0.1 0.2 0.3 0.4 0.05 Miles
Precipitation Flooding Extents Captiva Island (South Segment) 100-Year, 1-Day Storm
2070 (NOAA Int-High)


±
Legend 2070 (Int-High) 100-Year, 1-Day Storm Flooding Depths (feet) 0.01 - 0.25 0.26 - 0.50 0.51 - 0.75 0.76 - 1.00 1.01 - 1.50 1.51 - 2.00 2.01 - 2.50 2.51 - 3.00 3.01 - 4.00 4.01+ 0 0.1 0.2 0.3 0.4 0.05 Miles
page is intentionally blank
This
Precipitation Flooding Extents Captiva Island (Middle Segment) 100-Year, 1-Day Storm 2022 (Current)


±
Legend 2022 (Current) 100-Year, 1-Day Storm Flooding Depths (feet) 0.01 - 0.25 0.26 - 0.50 0.51 - 0.75 0.76 - 1.00 1.01 - 1.50 1.51 - 2.00 2.01 - 2.50 2.51 - 3.00 3.01 - 4.00 4.01+ 0 0.1 0.2 0.3 0.4 0.05 Miles
Precipitation Flooding Extents


Captiva Island (Middle Segment) 100-Year, 1-Day Storm
2040 (NOAA Int-Low)


±
Legend 2040 (Int-Low) 100-Year, 1-Day Storm Flooding Depths (feet) 0.01 - 0.25 0.26 - 0.50 0.51 - 0.75 0.76 - 1.00 1.01 - 1.50 1.51 - 2.00 2.01 - 2.50 2.51 - 3.00 3.01 - 4.00 4.01+ 0 0.1 0.2 0.3 0.4 0.05 Miles
Precipitation Flooding Extents

Captiva Island (Middle Segment) 100-Year, 1-Day Storm
2040 (NOAA Int-High)


±
Legend 2040 (Int-High) 100-Year, 1-Day Storm Flooding Depths (feet) 0.01 - 0.25 0.26 - 0.50 0.51 - 0.75 0.76 - 1.00 1.01 - 1.50 1.51 - 2.00 2.01 - 2.50 2.51 - 3.00 3.01 - 4.00 4.01+ 0 0.1 0.2 0.3 0.4 0.05 Miles
Precipitation Flooding Extents Captiva Island (Middle Segment) 100-Year, 1-Day Storm

2070 (NOAA Int-Low)


±
Legend 2070 (Int-Low) 100-Year, 1-Day Storm Flooding Depths (feet) 0.01 - 0.25 0.26 - 0.50 0.51 - 0.75 0.76 - 1.00 1.01 - 1.50 1.51 - 2.00 2.01 - 2.50 2.51 - 3.00 3.01 - 4.00 4.01+ 0 0.1 0.2 0.3 0.4 0.05 Miles
Precipitation Flooding Extents
Captiva Island (Middle Segment) 100-Year, 1-Day Storm
2070 (NOAA Int-High)


±
Legend 2070 (Int-High) 100-Year, 1-Day Storm Flooding Depths (feet) 0.01 - 0.25 0.26 - 0.50 0.51 - 0.75 0.76 - 1.00 1.01 - 1.50 1.51 - 2.00 2.01 - 2.50 2.51 - 3.00 3.01 - 4.00 4.01+ 0 0.1 0.2 0.3 0.4 0.05 Miles
page is intentionally blank
This
Precipitation Flooding Extents Captiva Island (North Segment) 100-Year, 1-Day Storm 2022 (Current)


±
Legend 2022 (Current) 100-Year, 1-Day Storm Flooding Depths (feet) 0.01 - 0.25 0.26 - 0.50 0.51 - 0.75 0.76 - 1.00 1.01 - 1.50 1.51 - 2.00 2.01 - 2.50 2.51 - 3.00 3.01 - 4.00 4.01+ 0 0.1 0.2 0.3 0.4 0.05 Miles
Precipitation Flooding Extents Captiva Island (North Segment) 100-Year, 1-Day Storm
2040 (NOAA Int-Low)


±
Legend 2040 (Int-Low) 100-Year, 1-Day Storm Flooding Depths (feet) 0.01 - 0.25 0.26 - 0.50 0.51 - 0.75 0.76 - 1.00 1.01 - 1.50 1.51 - 2.00 2.01 - 2.50 2.51 - 3.00 3.01 - 4.00 4.01+ 0 0.1 0.2 0.3 0.4 0.05 Miles
Precipitation Flooding Extents
Captiva Island (North Segment) 100-Year, 1-Day Storm
2040 (NOAA Int-High)


±
Legend 2040 (Int-High) 100-Year, 1-Day Storm Flooding Depths (feet) 0.01 - 0.25 0.26 - 0.50 0.51 - 0.75 0.76 - 1.00 1.01 - 1.50 1.51 - 2.00 2.01 - 2.50 2.51 - 3.00 3.01 - 4.00 4.01+ 0 0.1 0.2 0.3 0.4 0.05 Miles
Precipitation Flooding Extents Captiva Island (North Segment) 100-Year, 1-Day Storm
2070 (NOAA Int-Low)


±
Legend 2070 (Int-Low) 100-Year, 1-Day Storm Flooding Depths (feet) 0.01 - 0.25 0.26 - 0.50 0.51 - 0.75 0.76 - 1.00 1.01 - 1.50 1.51 - 2.00 2.01 - 2.50 2.51 - 3.00 3.01 - 4.00 4.01+ 0 0.1 0.2 0.3 0.4 0.05 Miles
Precipitation Flooding Extents Captiva Island (North Segment) 100-Year, 1-Day Storm
2070 (NOAA Int-High)


±
Legend 2070 (Int-High) 100-Year, 1-Day Storm Flooding Depths (feet) 0.01 - 0.25 0.26 - 0.50 0.51 - 0.75 0.76 - 1.00 1.01 - 1.50 1.51 - 2.00 2.01 - 2.50 2.51 - 3.00 3.01 - 4.00 4.01+ 0 0.1 0.2 0.3 0.4 0.05 Miles
