161
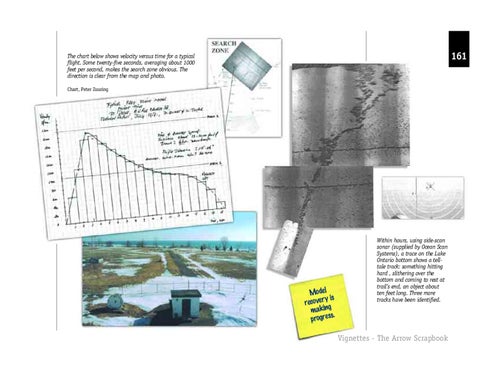
The chart below shows velocity versus time for a typical flight. Some twenty-five seconds, averaging about 1000 feet per second, makes the search zone obvious. The direction is clear from the map and photo. Chart, Peter Zuuring
Model y is recover making s. progres
Within hours, using side-scan sonar (supplied by Ocean Scan Systems), a trace on the Lake Ontario bottom shows a telltale track: something hitting hard , slithering over the bottom and coming to rest at trail’s end, an object about ten feet long. Three more tracks have been identified.
Vignettes - The Arrow Scrapbook