7 minute read
Gears and Periodic Error

Most modern mounts use a worm-andgear (also called worm-and-wheel) type of drive on each axis. These allow for a full 360-degrees of rotation and non-reversibility of drive along with a great amount of gear reduction.
The reduction in a worm and gear drive is the number of teeth in the gear. A 360-tooth gear will show 1:360 reduction while a 180-tooth gear will have a reduction of 1:180. Like the transmission of a car in low gear motor
Advertisement
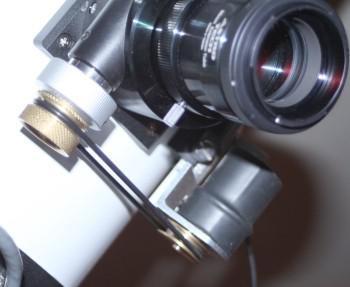
torque is greatly multiplied allowing a Fig. 10 small motor to easily turn a large and heavy telescope. Also, telescope has to track the sky accurately at approximately one revolution per day. A motor could not turn accurately at that slow a speed so the large amount of reduction in a worm drive also allows the motor to turn at a usable speed.
Figure 10 shows the worm and gear setup from a Mathis Instruments mount. The worm is the small driving gear and the worm-gear is the large bronze driven gear. Due to the non-reversibility of the gears.the worm-gear cannot drive the worm which is perfect for telescope use. This means that when the drive is stopped, even an out-of-balance condition will not cause the axis to slip.
Fig. 11

12
A favourite discussion in the on-line forums is the topic of periodic error (PE). PE is a tracking error caused by slight inaccuracies in the mount's RA worm which can make the mount speed up and slow down very slightly. This causes a target to 'wobble' back and forth in right ascension as shown in Figure 11. Different samples of similar mounts from a single manufacturer may show differing PE.
PE can be caused by many different types of inaccuracies in the worm. Figure 12 shows two worms that have machining errors compared to one that is perfect (left graphic). The centre worm itself is round but is being driven off centre which will cause it to strike the gear alternatively closer and further from the centre of the gear's rotation. The graphic on the right is a worm which is out-of-round, or egg-shaped.
Fig. 12

Both of these types machining errors will cause the mount's RA axis to speed up and slow down alternately with the period of the worm and could generate a PE curve such as in that in Figure 12.
A greater problem is a worm that is 'bumpy' as is shown in Figure 13. The left hand graphic shows a smooth worm (red) striking the gear (black). As the worm turns it will turn the gear smoothly. The right side of the graphic shows a poorly polished or lapped worm striking the gear. This will cause the gear to jerk quickly while turning, either speeding up or slowing down rapidly with a period much shorter than a full worm rotation.
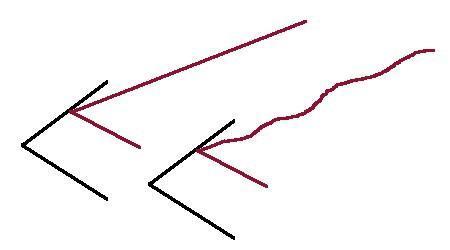
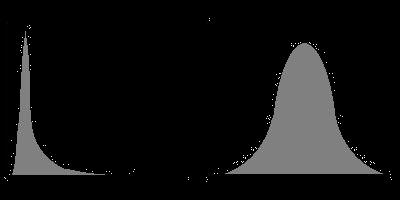
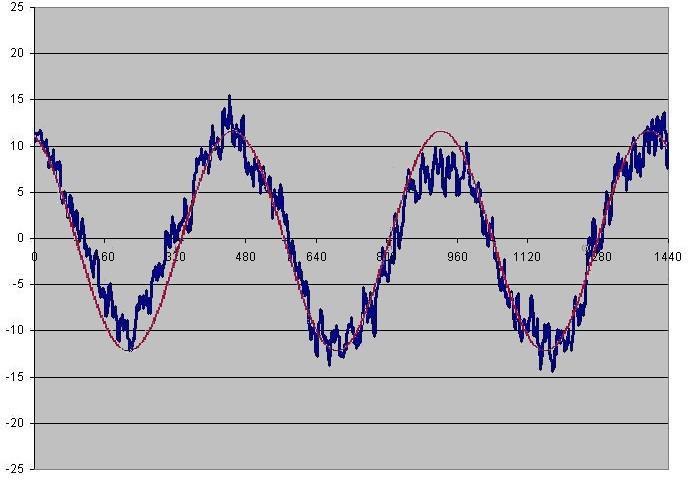
Figure 14 shows the actual PE curve of a modern popular GEM with a peak-to-valley amplitude of about 26 arcseconds. This sounds like a lot but is not unheard of with today's telescopes. The PE curve is superimposed by a perfect sine curve which shows that the mount's gears are quite Fig. 13 smooth. The spikes are due to seeing.
13
The important thing in the graph is not the amount of PE but that the curve almost perfectly matches the sine curve. On this mount an autoguider will be able to correct any drift in a guide-star perfectly.
Fig. 14
To show how bad a modern mount can be is the PE curve displayed in Figure 15. This is also from a popular mount that is touted by the manufacturer as being well-suited for imaging. Over this mount's PE curve I have tried to fit a sine curve but this was not as simple a task as in the previous example. This mount would not be very useful for imaging without some work.
Today just about everyone is guiding their images so normally any PE will be guided out. The amount (amplitude of the PE curve) of PE isn't generally an issue but more important is the shape of the curve. Figure 15 shows many areas where the curve is so steep that an autoguider may not be able to correct for the changes quickly enough.
Even if it displays a bad PE curve like Figure 15 a mount may still be usable for imaging. Most mounts these days come with some form of periodic error correction (PEC) built into their firmware. PEC has always been a rather dark art to me and I never really did get it to work properly on my HEQ5. I don't even try on my CGE as it isn't needed. The theory of how PEC works is quite simple. Start the mount's PEC 'learn' routine and let the mount run over three or four worm revolutions (see calculation below) while guiding on a star. While in learning mode, the PEC system records any guiding done. Once stored, the PEC system is turned onto 'playback' and any guiding that was recorded is used by the mount's firmware, speeding up and slowing down as needed to smooth out the curve.

There may be an problem using PEC while auto-guiding in that the guider, during its calibration phase, is doing its calculations with no knowledge of any worm rotation speed changes. If the
Fig. 15
14
mount is being guided during times of very slow or very fast worm rotation, as dictated by the PEC routines, then guider error could be introduced. This may or may not be an issue and SBIG has in the past stated that PEC should be turned off when using their guiders.
So how good is PEC? Generally quite good from the examples I've seen where people have taken their time and used the available software tools correctly. With very good mounts PEC can reduce error to the point where an auto guider isn't needed for short(ish) exposures making the system good for survey or patrol duties. Generally it's not good enough for long-exposure imaging with any mounts that normal humans can afford.

There are several tools available to help with both determining the amount of PE a mount exhibits and to help with the mount's PEC routines to smooth it out. If the plan is to use Fig. 16 both PEC and an auto guider it would be in their best interest to check the on-line forums to see if there will be any issues.
Figure 16 shows a Fourier analysis of Figure 14 curve. A Fourier analysis determines all of the sine curves that, when added up, generate the curve being analyzed. These individual sine curves show up as 'spikes' in the graph with the centre of the spike being the period of that curve. This type of chart shows the PE generated by all of the gears between the motor and the worm-gear individually. As can be seen in the graph, the analysis of the Figure 14 curve shows really only two periods, that of the worm at about 480 seconds and a smaller curve at about 150 seconds which is probably due to some error in the transfer gears between the motor and worm. Figure 17 shows a typical worm-and-gear setup. Places were PE shows up are in the worm and gear, the transfer gears and in the gearbox of the motor. Errors generated in the gearbox usually show up as the 'noise' at the far left of the Fourier analysis graph. Normally, PE from the gearbox and transfer gears do not have a deleterious effect on tracking, but very bad transfer gears may. Fixing transfer gear PE could be difficult. Dirty or sticky bearings in the worm's shaft may also add to the noise in the Fourier analysis.
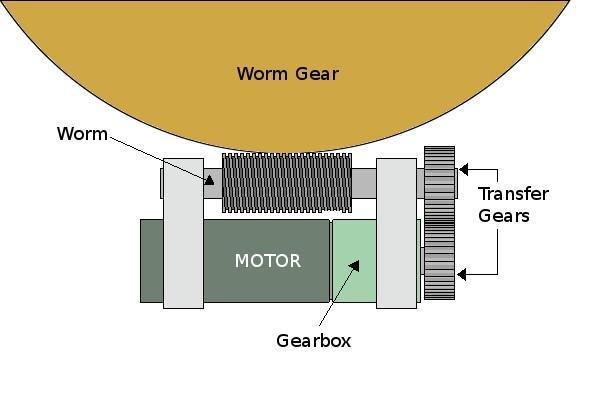
Fig. 17
15
Calculating worm period
A PE curve will have an amplitude equal to the greatest excursion of the star from centre and a period of which can be calculated thusly:

86164 / number of teeth in the worm gear
So, a gear with 180 teeth will have a worm period of 479 seconds while a gear with 360 teeth will have a period of 239 seconds. A telescope mount's documentation will generally tell both how many teeth are on the worm gear and possibly the average PE the manufacturer puts on that mount.
Canon XT through the trees using a tripod and the 18-55 mm kit lens.
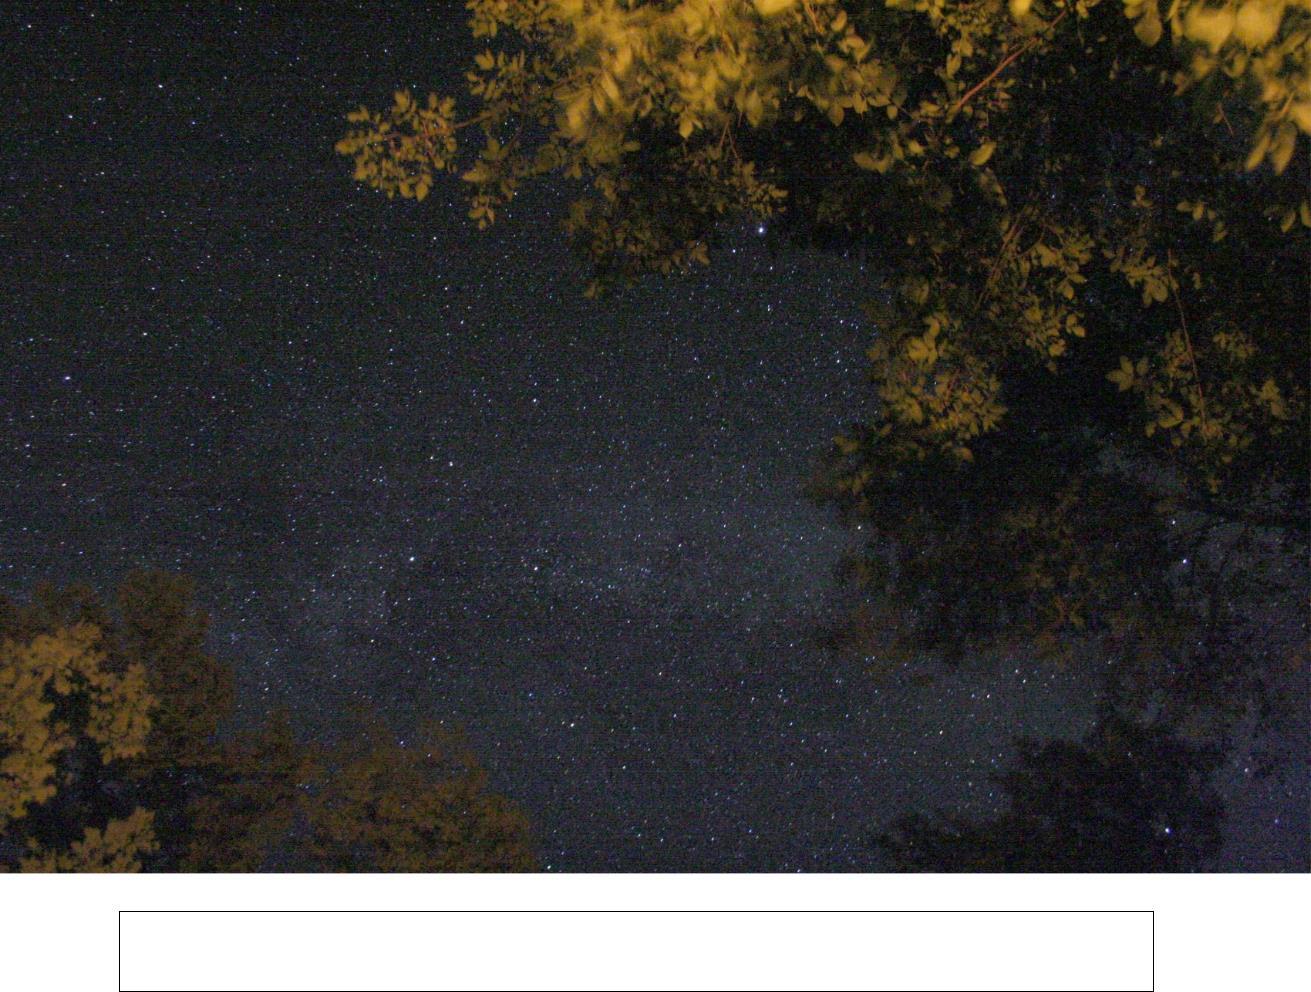
16