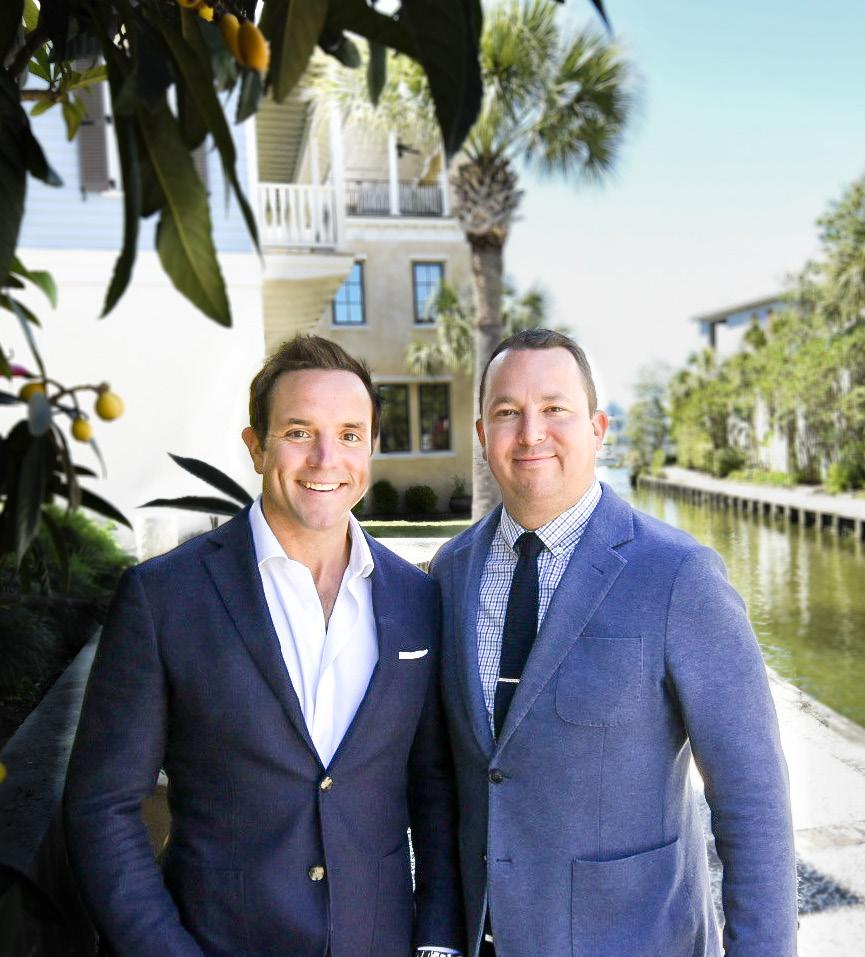
PARKER MOORE & MIKE MILLIKIN
LUXURY MARKET REPORT


CHARLESTON | MARCH 2023
843.270.3481
mike@pointbreakpropertiesre.com

Sharpened by over 30 years of savvy expertise, insight, and experience, Point Break Properties is an elite group of top-producing luxury real estate professionals in Charleston. Our agents are relentless advocates for our clients and are passionate about delivering singular, bespoke, and exceptional experiences. The access our advisors have to the most relevant, reliable, & up-to-date industry information and education is paramount. The removal of uncertainty allows our team to expertly advise at every stage of a real estate transaction which enables our clients to make powerful and confident decisions.

Point Break Properties advisors boast backgrounds in Real Estate Appraisal & Property Valuation, Marketing, Commodity Markets, and New Home Construction, to name a few. “Often the real estate process is quite emotional for first-time and primary home buyers and sellers, while what developers and investors are most focused on are the analytics and bottom-line dollars.” Point Break’s diverse experience affords keen insight into residential investments, executive and corporate relocation services, resort/vacation rentals, and allows for the ability to adapt to constant changes in the luxury market.
The leadership team at Point Break Properties consists of Mike Millikin and Parker Moore. Both raised in the Lowcountry and as best friends for over 20 years, they have the proactive insight & acumen to service their affluent clientele, their team, and their equity partners in the Charleston market. Together they manage both the Point Break Properties team as well as the Realty One Group

MIKE MILLIKIN REALTOR®, GUILD
Managing Partner Point Break Properties
PARKER MOORE REALTOR®, CLHMS Managing Partner Point Break Properties 843.801.4888 parker@pointbreakpropertiesre.com WWW.POINTBREAKPROPERTIESRE.COM
TABLE OF CONTENTS
PAGE 4 LUXURY REPORT EXPLAINED
PAGE 5 WELCOME MESSAGE
PAGE 6-9 NORTH AMERICAN LUXURY MARKET REVIEW
PAGE 10 13-MONTH MARKET TRENDS
PAGE 11 SINGLE-FAMILY HOMES MONTHLY OVERVIEW
PAGE 12 ATTACHED HOMES MONTHLY OVERVIEW
PAGE 13-16 MONTHLY STATISTICS BY CITY - Single-Family Homes

PAGE 17-20 MONTHLY STATISTICS BY CITY - Attached Homes
PAGE 21 LOCAL LUXURY MARKET REVIEW
PAGE 22-23 SINGLE-FAMILY HOMES - Monthly Statistics
PAGE 24-25 ATTACHED HOMES - Monthly Statistics
PAGE 26 THANK YOU
LUXURY REPORT EXPLAINED –
The Institute for Luxury Home Marketing has analyzed a number of metrics — including sales prices, sales volumes, number of sales, sales-price-to-list-price ratios, days on market and price-per-square-foot – to provide you a comprehensive North American Luxury Market report. Additionally, we have further examined all of the individual luxury markets to provide both an overview and an in-depth analysis - including, where data is sufficient, a breakdown by luxury single-family homes and luxury attached homes.
It is our intention to include additional luxury markets on a continual basis. If your market is not featured, please contact us so we can implement the necessary qualification process. More in-depth reports on the luxury communities in your market are available as well.
Looking through this report, you will notice three distinct market statuses, Buyer's Market, Seller's Market, and Balanced Market. A Buyer's Market indicates that buyers have greater control over the price point. This market type is demonstrated by a substantial number of homes on the market and few sales, suggesting demand for residential properties is slow for that market and/or price point.
By contrast, a Seller's Market gives sellers greater control over the price point. Typically, this means there are few homes on the market and a generous demand, causing competition between buyers who ultimately drive sales prices higher.
A Balanced Market indicates that neither the buyers nor the sellers control the price point at which that property will sell and that there is neither a glut nor a lack of inventory. Typically, this type of market sees a stabilization of both the list and sold price, the length of time the property is on the market as well as the expectancy amongst homeowners in their respective communities – so long as their home is priced in accordance with the current market value.
REPORT GLOSSARY
REMAINING INVENTORY: The total number of homes available at the close of a month.
DAYS ON MARKET: Measures the number of days a home is available on the market before a purchase offer is accepted.
LUXURY BENCHMARK PRICE: The price point that marks the transition from traditional homes to luxury homes.
NEW LISTINGS: The number of homes that entered the market during the current month.
PRICE PER SQUARE FOOT: Measures the dollar amount of the home's price for an individual square foot.
SALES RATIO: Sales Ratio defines market speed and determines whether the market currently favors buyers or sellers. Buyer's Market = up to 14%; Balanced Market = 15 to 20%; Seller's Market = 21% plus. If >100%, sales from previous month exceed current inventory.
SP/LP RATIO: The Sales Price/List Price Ratio compares the value of the sold price to the value of the list price.
–
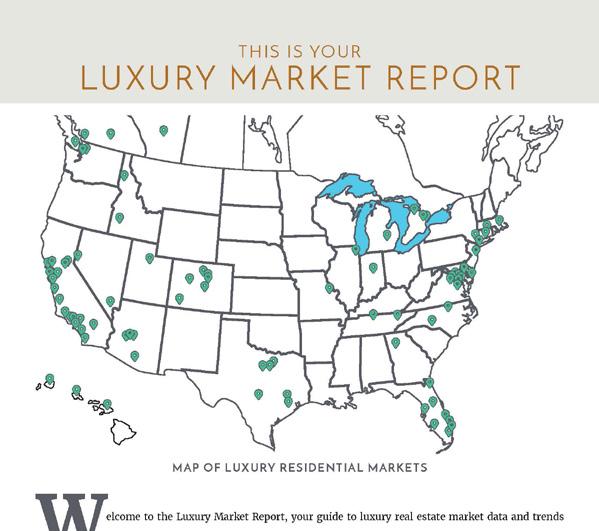
LUXURY MARKET REPORT
MAP OF LUXURY RESIDENTIAL MARKETS
Welcome to the Luxury Market Report, your guide to luxury real estate market data and trends for North America. Produced monthly by The Institute for Luxury Home Marketing, this report provides an in-depth look at the top residential markets across the United States and Canada. Within the individual markets, you will find established luxury benchmark prices and detailed survey of luxury active and sold properties designed to showcase current market status and recent trends. The national report illustrates a compilation of the top North American markets to review overall standards and trends.
Copyright © 2023 Institute for Luxury Home Marketing | www.luxuryhomemarketing.com | 214.485.3000
The Luxury Market Report is a monthly analysis provided by The Institute for Luxury Home Marketing. Luxury benchmark prices are determined by The Institute. This active and sold data has been provided by REAL Marketing, who has compiled the data through various sources, including local MLS boards, local tax records and Realtor.com. Data is deemed reliable to the best of our knowledge, but is not guaranteed.
THIS IS YOUR
NORTH AMERICAN LUXURY REVIEW
The Demand for Luxury Real Estate Examined
Over the last 2.5 years, the state of the luxury real estate market has become one of the hottest topics discussed in news outlets, multi-media platforms, and within the industry itself.
Conversations initially focused on spiraling demand and rising prices. This was soon followed by reports on the increasing demand for multi-faceted relocations and migrations. After which, the impact of falling inventory levels took prime spot. While these topics are still highly key in understanding the current market, the declining sales volume has become the most recent focus of attention by the media.
Reports of plunging sales have sparked much discussion as to what the spring market will bring, coupled with the uncertainty about the economy and whether there will be any further changes to the interest rate.
But there is also quiet optimism in the air. Overall prices seem little impacted – according to the Institute’s median sold prices for the last three months, prices have edged up, and there is only a small 1.38% decrease compared to February 2022.
The reality is that except for the markets where the buying frenzy caused both price increases and continued sales growth to become unsustainable, luxury home purchases are mostly returning to more traditional transaction levels.
The data for February 2023 does indicate there is positive movement with respect to sales. Compared to January 2023, the number of new listings entering the market increased, but of more significance is that the number of sales also increased in both the single-family and attached markets.
This may only be the start of a possible trend, but if it continues in this direction, buyer demand, which has remained hesitant for the last few months, could return as we enter the spring market.
While the affluent tend to be less impacted by outside influences, concerns over the financial market and economic variables have seen buyers take a long pause. However, with less competition and more competitive rates for mortgage and other loan types now offered to affluent buyers (as their wealth makes them considerably less risky to lenders), this may continue to help ignite sales again.
Mansion Global just announced that both New York and San Francisco saw their numbers of sales increase during February. However, both markets report that there has been trade-off insomuch as asking prices were negotiated downwards by as much as 17% in San Francisco and 12% in New York. Although, of equal note, both these markets did see their price points reach unprecedented heights at the end of 2021, so a leveling out was not unexpected.
On the other hand, as we reported last month, markets that still offer more affordability or potential price growth are expected to see an uptick in demand. The growth of demand for the luxury sector in these markets is heavily driven by millennials, particularly those who can work from home.
According to Bloomberg, this generation is not living in their parent’s basements anymore; they are buying multimillion-dollar homes1. Equally, Bloomberg expects this generation to change the high-end housing market as their preferences are driven by technology and environmental requirements.
Expectations are that we will see many fluctuations in demand, prices, and sales over the next few months. There will be a lack of consistency between markets and within markets themselves, where certain price points will see high demand and others very little interest.
Specific property types, as well as locations, are very much back on the table when it comes to buyers’ preferences too.
Location has always been important to the affluent, and there is very little expectation for this to change, except perhaps in the diversity of new locations that will come to the forefront of demand this year.
Old favorites such as key metropolises will continue to attract those whose business lies within, but it is the increasing demand for multiple ownership of properties in rural, waterfront, and mountain locations, especially those that are less affected by climate change, that are expected to see the most growth.
Demand for very specific property types will also bring change in the luxury market, as the wealthy not only seek the right location but also homes with amenities that equally meet their practical needs and “must-have” requirements.
Expect to see growth in the multi-generational home. New builds are being designed to cater to extended families, whether its multiple master suites, separate living spaces, or even additional homes on the property.
That is not to say the trend is all about bigger. As people recognize they are happy to return to smaller footprints, particularly those heading towards metropolitan lifestyles, health and wellness are still top of mind. Instead, it is the use of space to promote physical and mental well-being that has become appreciated in an entirely new way.
While the obvious, such as access to amenities like gyms, yoga studios, and spas, is important, it is the demand for sustainability and smart homes that is truly on the rise. Luxury homes, apartment buildings, and townhome complexes are turning towards sustainable living options. This is not just for new builds, as many properties have gone through extensive renovations to provide for this demand.
Using smart home technology has helped to facilitate changing these environments with fully automated systems that control not just entertainment and security systems but lighting, temperature, air quality, and water conservation.
One trend that was on the uptick prior to the arrival of the pandemic was the demand for hotelstyle living in private residences, and according to Mansion Global, we should expect to see the demand for branded residences return2.
They predict that these residences will dominate the high-end home market as the affluent seek not just the best white-glove service but also the opportunity to enjoy ‘experiences’ – and they are willing to pay top dollar.
Privacy and security also remain highly important to the affluent, and there has been a notable increase in advanced security systems being implemented, as well as demand for properties that offer privacy and seclusion, whether branded residences or private homesteads.

The art of selling and buying in this market needs a critical and analytical approach; understanding the realities and setting expectations accordingly will ensure that goals are achieved. For homeowners looking to buy or sell in today’s market, we recommend working with a Realtor who can capitalize on the preferences, trends, and demands in this dynamic and evolving environment.
Sources:
1. https://www.bloomberg.com/news/articles/2021-02-01/millennials-are-changing-the-luxury-real-estatemarket#xj4y7vzkg
2. https://www.mansionglobal.com/articles/hotel-level-service-gathering-space-and-gardens-are-2023s-topamenity-trends-01672313535?mod=sponsored_main&tesla=y
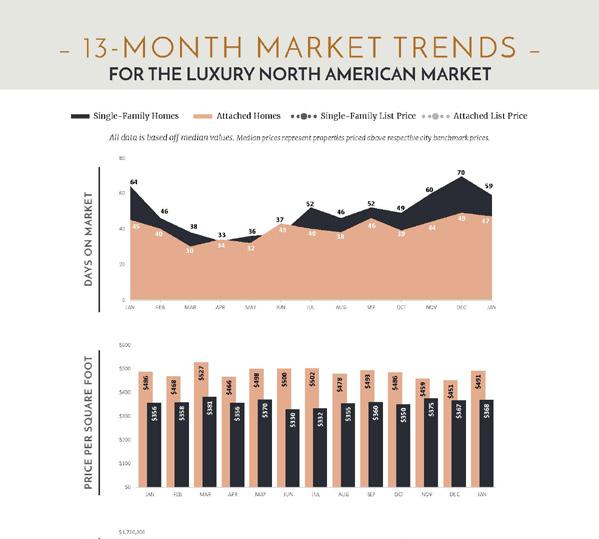
FOR THE LUXURY NORTH AMERICAN MARKET
Single-Family Homes Attached Homes Single-Family List Price Attached List Price DAYS ON MARKET
All data is based off median values. Median prices represent properties priced above respective city benchmark prices.
– 13 -
–
MONTH MARKET TRENDS
SALES PRICE VS. LIST PRICE
13 9 8 8 9 12 18 22 22 25 32 35 40 11 8 8 9 9 13 18 21 24 28 29 32 28 0 5 10 15 20 25 30 35 40 45 FEB MAR APR MAY JUN JUL AUG SEP OCT NOV DEC JAN FEB PRICE PER SQUARE FOOT $525 $540 $524 $553 $563 $546 $527 $530 $521 $528 $519 $507 $509 $412 $421 $441 $437 $431 $432 $417 $426 $425 $415 $423 $399 $432 $0 $100 $200 $300 $400 $500 $600 FEB MAR APR MAY JUN JUL AUG SEP OCT NOV DEC JAN FEB $500,000 $700,000 $900,000 $1,100,000 $1,300,000 $1,500,000 $1,700,000 $1,900,000 FEB MAR APR MAY JUN JUL AUG SEP OCT NOV DEC JAN FEB
LUXURY MONTHLY MARKET REVIEW –
A Review of Key Market Differences Year over Year
41.94%
SINGLE-FAMILY HOMES MARKET SUMMARY | FEBRUARY 2023
• Official Market Type: Seller's with a 22.26% Sales Ratio.1
• Homes are selling for an average of 97.67% of list price.
• The median luxury threshold2 price is $937,500, and the median luxury home sales price is $1,335,000.
• Markets with the Highest Median Sales Price: Aspen ($21,000,000), Telluride ($5,912,500), Los Angeles Beach Cities ($5,902,500), and Naples ($4,500,000).
• Markets with the Highest Sales Ratio: Hamilton County, IN (59%), St. Louis (55%), East Bay, CA (50%), and Montgomery County, MD (50%).
–
1Sales Ratio defines market speed and market type: Buyer's < 15.5%; Balanced >= 15.5 to < 20.5%; Seller's >= 20.5% plus. If >100%, sales from previous month exceeds current inventory. 2The luxury threshold price is set by The Institute for Luxury Home Marketing. SINGLE-FAMILY HOMES Median List Price $1,795,000 $1,650,000 Median Sale Price $1,353,725 $1,335,000 Median SP/LP Ratio 100.00% 97.67% Total Sales Ratio 64.20% 22.26% Median Price per Sq. Ft. $412 $432 Total Inventory 22,039 43,010 New Listings 9,578 13,194 Total Sold 14,148 9,576 Median Days on Market 13 40 Average Home Size 3,275 3,279
February 2022 | February 2023 Median prices represent properties priced above respective city benchmark prices. February 2023 February 2022 February 2023 February 2022
New Listings 3,616 Total Sold 4,572 Med. Sale Price $18,725 Days on Market
Sales Ratio
27
LUXURY MONTHLY MARKET REVIEW –
A Review of Key Market Differences Year over Year
ATTACHED 807 Total Sold
2,531 Med. Sale Price
$19,750 Days on Market
17 Sales Ratio
• Official Market Type: Seller's Market with a 20.98% Sales Ratio 1
• Attached homes are selling for an average of 98.37% of list price.
45.26%
• The median luxury threshold2 price is $700,000, and the median attached luxury sale price is $879,000
• Markets with the Highest Median Sales Price: Vail ($3,637,500), Aspen ($3,575,000), San Francisco ($2,301,650), and Park City ($2,197,000).
• Markets with the Highest Sales Ratio: Howard County, MD (144%), Marin County, CA (92%), Santa Barbara (86%), and Fairfax County, VA (85%).
1Sales Ratio defines market speed and market type: Buyer's < 15.5%; Balanced >= 15.5 to < 20.5%; Seller's >= 20.5% plus. If >100%, sales from previous month exceeds current inventory. 2The luxury threshold price is set by The Institute for Luxury Home Marketing. Median List Price $1,145,879 $950,000 Median Sale Price $898,750 $879,000 Median SP/LP Ratio 100.00% 98.37% Total Sales Ratio 66.24% 20.98% Median Price per Sq. Ft. $525 $509 Total Inventory 8,623 15,163 New Listings 4,094 4,901 Total Sold 5,712 3,181 Median Days on Market 11 28 Average Home Size 1,867 1,888 –
Median prices represent properties priced above respective city benchmark prices.
February
February
February 2023 February 2022 February 2023 February 2022
2022 |
2023
ATTACHED HOMES MARKET SUMMARY | FEBRUARY 2023 HOMES New Listings
LUXURY MONTHLY MARKET REVIEW –
SINGLE-FAMILY HOMES
Median prices represent properties priced above respective city benchmark prices. Prices shown for Canadian cites are shown in Canadian Dollars. –
State Market Name Median List Price Median Sold Price Inventory New Listings Sold Days on Market Market Status AB Calgary $1,150,000 $988,750 $408 $259 $148 $17 Seller's AZ Chandler and Gilbert $989,945 $1,100,000 $156 $48 $45 $58 Seller's AZ Flagstaff $1,950,000 $1,800,000 $52 $5 $9 $89 Balanced AZ Mesa $917,200 $870,000 $148 $43 $39 $55 Seller's AZ Paradise Valley $6,150,000 $3,200,000 $165 $46 $22 $47 Buyer's AZ Phoenix $899,900 $779,990 728 226 203 73 Seller's AZ Scottsdale $2,195,000 $1,622,500 778 191 155 59 Balanced AZ Tucson $690,557 $634,500 861 217 182 24 Seller's BC Mid Vancouver Island $1,599,000 $1,338,700 133 38 14 38 Buyer's BC Okanagan Valley $1,747,450 $1,475,000 646 191 47 75 Buyer's BC Vancouver $4,500,000 $3,404,000 868 267 76 13 Buyer's BC Victoria $2,425,000 $1,960,000 118 65 21 21 Balanced BC Whistler $5,690,000 $3,598,500 41 13 4 3 Buyer's CA Central Coast $2,995,000 $2,335,000 170 60 30 16 Balanced CA East Bay $2,350,000 $1,890,000 265 145 133 12 Seller's CA Greater Palm Springs $2,133,000 $1,850,000 403 116 79 43 Balanced CA Lake Tahoe $2,997,000 $1,925,000 118 28 22 99 Balanced CA Los Angeles Beach Cities $5,999,000 $5,902,500 309 102 40 20 Buyer's CA Los Angeles City $5,995,000 $3,450,000 653 213 75 32 Buyer's CA Los Angeles The Valley $2,699,000 $2,300,000 459 189 89 40 Balanced CA Marin County $3,900,000 $3,200,000 59 12 15 11 Seller's CA Napa County $3,950,000 $2,212,500 83 23 6 76 Buyer's CA Orange County $2,995,000 $2,100,000 692 246 213 31 Seller's CA Placer County $1,149,990 $1,050,000 197 65 56 28 Seller's CA Sacramento $1,031,500 $870,000 434 163 129 34 Seller's CA San Diego $2,692,000 $1,817,500 574 217 204 23 Seller's CA San Francisco $4,689,000 $3,325,000 114 36 21 26 Balanced CA San Luis Obispo County $1,825,000 $1,335,000 $141 $41 $33 $18 Seller's CA Santa Barbara $5,880,000 $3,175,000 91 35 29 15 Seller's CA Silicon Valley $4,345,000 $3,575,000 317 184 115 12 Seller's CA Sonoma County $2,290,000 $1,847,500 141 30 24 58 Balanced CA Ventura County $2,199,000 $1,760,000 195 66 26 85 Buyer's CO Aspen $18,675,000 $21,000,000 12 13 1 22 Buyer's CO Boulder $2,350,000 $1,855,000 178 69 37 46 Balanced CO Colorado Springs $899,000 $894,000 305 83 64 43 Balanced CO Denver $1,837,000 $1,425,000 444 192 144 27 Seller's CO Douglas County $1,450,000 $1,232,500 252 92 62 42 Seller's
LUXURY MONTHLY MARKET REVIEW –SINGLE-FAMILY HOMES
–
Median prices represent properties priced above respective city benchmark prices. Prices shown for Canadian cites are shown in Canadian Dollars. State Market Name Median List Price Median Sold Price Inventory New Listings Sold Days on Market Market Status CO Durango $1,850,000 $1,178,750 53 6 8 59 Balanced CO Summit County $3,695,000 $2,625,000 53 9 7 103 Buyer's CO Telluride $7,112,500 $5,912,500 76 7 4 71 Buyer's CO Vail $6,125,000 $2,995,000 62 4 5 140 Buyer's CT Central Connecticut $707,500 $617,500 272 68 58 20 Seller's CT Coastal Connecticut $2,497,000 $1,551,000 414 115 53 51 Buyer's DC Washington D.C. $3,947,500 $2,395,000 38 9 9 10 Seller's DE Sussex County Coastal $1,449,990 $1,173,882 125 31 31 1 Seller's FL Boca Raton/Delray Beach $2,999,500 $1,907,500 462 109 70 53 Balanced FL Coastal Pinellas County $2,499,000 $1,830,850 106 29 26 40 Seller's FL Greater Fort Lauderdale $1,397,000 $1,075,000 1425 335 201 54 Buyer's FL Jacksonville Beaches $1,395,000 $1,079,500 279 84 54 52 Balanced FL Lee County $1,400,055 $1,270,550 693 229 96 19 Buyer's FL Marco Island $2,575,000 $2,627,500 163 38 16 63 Buyer's FL Miami $2,200,000 $1,415,000 1029 223 87 108 Buyer's FL Naples $5,300,000 $4,500,000 458 117 41 44 Buyer's FL Orlando $1,299,000 $1,157,500 627 190 140 37 Seller's FL Sarasota & Beaches $2,895,000 $1,840,500 435 93 46 39 Buyer's FL South Pinellas County $1,599,997 $1,390,000 279 89 59 40 Seller's FL South Walton $2,399,000 $2,404,887 351 82 41 77 Buyer's FL Space Coast $885,000 $776,250 283 80 80 42 Seller's FL Tampa $769,000 $700,000 1011 300 314 30 Seller's FL Palm Beach Towns $4,500,000 $1,700,000 338 77 17 83 Buyer's FL Weston $1,277,499 $915,000 86 27 22 52 Seller's GA Atlanta $1,650,000 $1,208,750 557 181 98 19 Balanced GA Duluth $1,482,500 $1,112,500 16 6 4 22 Seller's HI Island of Hawaii $2,100,000 $1,800,000 127 16 14 41 Buyer's HI Kauai $2,993,000 $2,132,223 54 10 6 27 Buyer's HI Maui $3,187,500 $2,495,000 148 26 11 84 Buyer's HI Oahu $3,195,000 $2,394,000 173 42 36 49 Balanced ID Ada County $774,500 $769,900 569 192 195 44 Seller's ID Northern Idaho $1,749,480 $1,400,000 257 68 15 244 Buyer's IL Chicago $1,650,000 $1,297,552 421 147 128 59 Seller's IL DuPage County $1,244,900 $950,000 195 59 55 49 Seller's IL Lake County $1,199,950 $897,000 180 44 41 32 Seller's IL Will County $649,900 $564,963 164 58 50 45 Seller's IN Hamilton County $837,000 $776,540 123 40 73 14 Seller's
LUXURY MONTHLY MARKET REVIEW –SINGLE-FAMILY HOMES
–
Median prices represent properties priced above respective city benchmark prices. Prices shown for Canadian cites are shown in Canadian Dollars. State Market Name Median List Price Median Sold Price Inventory New Listings Sold Days on Market Market Status KS Johnson County $833,741 $830,000 428 55 69 25 Balanced MA Cape Cod $2,595,000 $1,702,500 100 22 24 64 Seller's MA Greater Boston $3,431,000 $2,649,000 104 35 17 72 Balanced MA South Shore $1,800,000 $1,275,000 41 13 11 44 Seller's MD Anne Arundel County $984,750 $906,011 138 47 42 19 Seller's MD Frederick County $875,000 $885,000 55 22 16 18 Seller's MD Howard County $1,091,132 $997,020 65 12 26 8 Seller's MD Montgomery County $2,000,000 $1,500,000 110 45 55 9 Seller's MD Talbot County $3,000,000 $2,612,500 17 7 6 4 Seller's MD Worcester County $1,112,500 $755,500 46 12 7 60 Balanced MI Livingston County $750,000 $697,500 63 21 8 38 Buyer's MI Monroe County $674,900 $590,000 12 4 3 11 Seller's MI Oakland County $799,000 $640,000 590 195 155 21 Seller's MI Washtenaw County $999,999 $824,500 105 22 21 51 Balanced MI Wayne County $749,000 $630,769 130 43 43 17 Seller's MN Olmsted County $799,900 $738,833 69 21 8 53 Buyer's MN Twin Cities $1,250,000 $990,560 492 151 91 63 Balanced MO Kansas City $689,900 $650,351 1273 175 223 20 Balanced MO St. Louis $849,500 $650,000 64 17 35 28 Seller's NC Asheville $1,100,000 $925,000 178 44 41 43 Seller's NC Charlotte $1,200,900 $993,653 407 122 173 16 Seller's NC Lake Norman $1,150,000 $1,075,000 162 48 57 16 Seller's NC Raleigh-Durham $1,188,750 $938,750 408 107 111 0 Seller's NJ Bergen County $2,254,950 $2,195,000 216 69 31 85 Buyer's NJ Hudson County $1,550,000 $2,300,000 21 8 5 106 Seller's NJ Morris County $1,630,000 $1,770,000 104 30 19 48 Balanced NJ Ocean County $966,950 $855,000 334 110 63 34 Balanced NM Taos $1,200,000 $1,100,000 42 3 5 237 Buyer's NV Lake Tahoe $5,495,000 $1,837,500 67 8 4 209 Buyer's NV Las Vegas $1,799,450 $1,350,000 622 180 70 69 Buyer's NV Reno $1,694,500 $1,935,000 76 11 5 160 Buyer's NY Finger Lakes $1,725,000 $999,999 16 2 3 199 Balanced NY Nassau County $1,800,000 $1,500,000 559 132 67 58 Buyer's NY Staten Island $1,249,999 $1,250,000 129 29 18 105 Buyer's NY Suffolk County $1,999,000 $1,422,500 674 149 88 80 Buyer's OH Cincinnati $874,900 $830,000 170 34 42 4 Seller's OH Cleveland Suburbs $931,450 $685,000 22 11 9 9 Seller's
LUXURY MONTHLY MARKET REVIEW –SINGLE-FAMILY HOMES
–
Median prices represent properties priced above respective city benchmark prices. Prices shown for Canadian cites are shown in Canadian Dollars. State Market Name Median List Price Median Sold Price Inventory New Listings Sold Days on Market Market Status ON GTA - Durham $1,750,000 $1,700,000 137 84 31 10 Seller's ON GTA - York $2,599,950 $1,877,500 370 258 168 11 Seller's ON Hamilton $1,890,000 $1,509,500 157 86 26 23 Balanced ON Mississauga $3,199,850 $2,780,000 97 54 15 34 Balanced ON Oakville $3,149,900 $2,325,000 99 76 37 11 Seller's ON Toronto $3,800,000 $3,120,000 303 202 89 11 Seller's ON Waterloo Region $1,500,000 $1,315,000 104 76 36 9 Seller's OR Portland $1,350,000 $1,052,200 430 117 106 22 Seller's QC Montreal - - - - - -SC Charleston $1,967,500 $1,425,000 354 105 83 71 Seller's SC Hilton Head $2,100,000 $1,750,000 228 45 31 59 Buyer's SC The Grand Strand $839,000 $772,165 418 99 69 119 Balanced TN Greater Chattanooga $997,900 $908,100 137 30 34 41 Seller's TN Nashville $1,750,000 $1,312,500 585 179 138 9 Seller's TX Austin $1,249,700 $949,000 844 301 155 49 Balanced TX Collin County $750,000 $709,705 852 278 398 47 Seller's TX Dallas $1,585,000 $1,000,000 327 120 134 17 Seller's TX Denton County $775,000 $727,000 657 188 262 48 Seller's TX El Paso $625,000 $599,015 181 28 18 14 Buyer's TX Fort Worth $875,000 $740,000 683 208 225 56 Seller's TX Greater Tyler $799,000 $619,900 205 68 25 53 Buyer's TX Houston $999,000 $849,900 913 290 189 17 Balanced TX Lubbock $629,900 $590,000 121 43 21 58 Balanced TX San Angelo $649,900 $617,450 68 12 8 113 Buyer's TX San Antonio $799,900 $750,000 558 151 101 45 Balanced TX The Woodlands & Spring $849,000 $682,500 135 56 50 18 Seller's UT Park City $5,150,000 $4,338,046 161 17 16 82 Buyer's UT Salt Lake City $1,190,044 $1,049,000 295 99 87 63 Seller's VA Arlington & Alexandria $2,259,500 $2,000,000 98 39 20 11 Balanced VA Charlottesville $1,398,000 $1,307,761 129 33 22 18 Balanced VA Fairfax County $2,129,950 $1,485,000 256 83 59 13 Seller's VA McLean & Vienna $2,799,950 $1,830,000 112 34 25 65 Seller's VA Richmond $787,475 $803,250 274 85 108 8 Seller's VA Smith Mountain Lake $1,475,000 $1,725,000 17 5 5 32 Seller's WA King County - Greater Seattle $2,100,000 $1,650,000 571 265 237 22 Seller's WA Seattle $2,060,750 $1,574,500 150 77 48 10 Seller's WA Spokane $1,250,000 $1,059,294 65 18 6 71 Buyer's
LUXURY MONTHLY MARKET REVIEW –ATTACHED HOMES
–
Markets with dashes do not have a significant luxury market for this report. Median prices represent properties priced above respective city benchmark prices. Prices shown for Canadian cites are shown in Canadian Dollars. State Market Name Median List Price Median Sold Price Inventory New Listings Sold Days on Market Market Status AB Calgary $849,500 $674,250 $118 $57 $30 $18 Seller's AZ Chandler and Gilbert - - - - - -AZ Flagstaff - - - - - -AZ Mesa - - - - - -AZ Paradise Valley - - - - - -AZ Phoenix - - - - - -AZ Scottsdale $865,000 $760,000 $240 $73 $57 $52 Seller's AZ Tucson - - - - - -BC Mid Vancouver Island $814,900 $807,500 $51 $27 $8 $39 Balanced BC Okanagan Valley - - - - - -BC Vancouver $1,980,000 $1,713,333 $854 $315 $73 $21 Buyer's BC Victoria $999,000 $879,000 $115 $66 $37 $28 Seller's BC Whistler $2,538,000 $2,120,000 $35 $14 $11 $15 Seller's CA Central Coast $1,150,000 $1,038,000 $25 $14 $13 $16 Seller's CA East Bay $1,119,000 $1,097,500 $86 $53 $56 $14 Seller's CA Greater Palm Springs - - - - - -CA Lake Tahoe $1,949,000 $1,100,000 $19 $3 $4 $57 Seller's CA Los Angeles Beach Cities $1,827,000 $1,500,680 $122 $46 $37 $35 Seller's CA Los Angeles City $1,949,000 $1,465,900 $316 $88 $40 $26 Buyer's CA Los Angeles The Valley $792,000 $786,000 $96 $61 $53 $26 Seller's CA Marin County $1,398,354 $1,145,000 $12 $6 $11 $13 Seller's CA Napa County - - - - - -CA Orange County $1,289,000 $1,110,000 $254 $99 $137 $24 Seller's CA Placer County - - - - - -CA Sacramento - - - - - -CA San Diego $1,196,500 $1,095,050 $228 $107 $104 $12 Seller's CA San Francisco $2,649,000 $2,301,650 $105 $18 $14 $7 Buyer's CA San Luis Obispo County - - - - - -CA Santa Barbara $2,195,000 $1,567,500 $7 $4 $6 $14 Seller's CA Silicon Valley $1,698,000 $1,560,000 $75 $45 $33 $9 Seller's CA Sonoma County $725,501 $763,250 $8 $3 $4 $19 Seller's CA Ventura County $773,000 $700,000 $80 $34 $25 $42 Seller's CO Aspen $3,925,000 $3,575,000 $58 $6 $5 $92 Buyer's CO Boulder $916,239 $860,000 $61 $25 $21 $55 Seller's CO Colorado Springs $592,000 $650,000 $50 $7 $9 $110 Balanced CO Denver $875,000 $760,000 $140 $40 $39 $21 Seller's CO Douglas County $535,000 $589,000 $17 $7 $6 $43 Seller's
LUXURY MONTHLY MARKET REVIEW –ATTACHED HOMES
–
Markets with dashes do not have a significant luxury market for this report. Median prices represent properties priced above respective city benchmark prices. Prices shown for Canadian cites are shown in Canadian Dollars. State Market Name Median List Price Median Sold Price Inventory New Listings Sold Days on Market Market Status CO Durango $799,000 $742,500 $25 $2 $2 $55 Buyer's CO Summit County $1,224,500 $1,332,500 $28 $9 $6 $70 Seller's CO Telluride $1,850,000 $1,925,000 $43 $8 $14 $69 Seller's CO Vail $3,995,000 $3,637,500 $69 $7 $12 $32 Balanced CT Central Connecticut - - - - - -CT Coastal Connecticut $1,150,000 $707,500 $155 $32 $26 $47 Balanced DC Washington D.C. $2,000,000 $1,610,000 $158 $67 $53 $12 Seller's DE Sussex County Coastal $849,900 $925,000 $19 $5 $5 $29 Seller's FL Boca Raton/Delray Beach $1,062,500 $725,500 $330 $92 $60 $38 Balanced FL Coastal Pinellas County $1,295,000 $1,200,000 $140 $45 $31 $26 Seller's FL Greater Fort Lauderdale $849,000 $700,000 $1,058 $239 $101 $46 Buyer's FL Jacksonville Beaches $1,111,335 $865,000 $40 $10 $8 $67 Balanced FL Lee County $829,000 $742,500 $387 $150 $70 $18 Balanced FL Marco Island $1,649,000 $1,605,000 $57 $14 $6 $32 Buyer's FL Miami $1,496,500 $1,165,000 $1,424 $249 $97 $84 Buyer's FL Naples $2,339,044 $2,195,000 $273 $104 $49 $32 Balanced FL Orlando $556,694 $560,000 220 59 41 40 Balanced FL Sarasota & Beaches $1,647,000 $1,600,000 212 78 62 12 Seller's FL South Pinellas County $1,037,450 $960,500 246 77 54 13 Seller's FL South Walton $1,638,800 $1,412,500 159 24 32 47 Balanced FL Space Coast $755,000 $675,000 173 43 34 30 Balanced FL Tampa $967,300 $702,500 $171 $53 $48 $25 Seller's FL Palm Beach Towns $1,837,500 $1,650,000 $316 $67 $28 $70 Buyer's FL Weston - - - - - -GA Atlanta $736,200 $640,000 462 140 103 25 Seller's GA Duluth - - - - - -HI Island of Hawaii $1,897,000 $1,251,250 $60 $8 $12 $17 Balanced HI Kauai $1,797,500 $1,100,000 44 7 11 11 Seller's HI Maui $1,995,000 $1,982,500 $97 $20 $18 $106 Balanced HI Oahu $1,244,278 $972,500 $460 $89 $58 $27 Buyer's ID Ada County $625,000 $575,000 $41 $14 $12 $50 Seller's ID Northern Idaho - - - - - -IL Chicago $1,199,000 $974,203 $671 $251 $73 $78 Buyer's IL DuPage County $885,000 $625,000 $19 $8 $8 $21 Seller's IL Lake County - - - - - -IL Will County - - - - - -IN Hamilton County - - - - - - -
LUXURY MONTHLY MARKET REVIEW –ATTACHED HOMES
–
Markets with dashes do not have a significant luxury market for this report. Median prices represent properties priced above respective city benchmark prices. Prices shown for Canadian cites are shown in Canadian Dollars. State Market Name Median List Price Median Sold Price Inventory New Listings Sold Days on Market Market Status KS Johnson County $594,770 $682,425 140 12 12 29 Buyer's MA Cape Cod $787,500 $1,182,500 $18 $4 $4 $81 Seller's MA Greater Boston $2,595,000 $1,972,500 299 108 26 47 Buyer's MA South Shore $855,000 $825,000 15 3 1 67 Buyer's MD Anne Arundel County $579,990 $588,990 46 20 39 13 Seller's MD Frederick County - - - - - -MD Howard County $615,000 $594,000 16 10 23 5 Seller's MD Montgomery County $809,990 $769,990 63 32 41 8 Seller's MD Talbot County - - - - - -MD Worcester County $739,900 $577,500 58 23 18 19 Seller's MI Livingston County - - - - - -MI Monroe County - - - - - -MI Oakland County $671,179 $700,000 56 16 11 36 Balanced MI Washtenaw County $599,995 $569,500 49 14 8 44 Balanced MI Wayne County $665,100 $630,000 63 9 7 12 Buyer's MN Olmsted County - - - - - -MN Twin Cities - - - - - -MO Kansas City - - - - - -MO St. Louis - - - - - -NC Asheville $789,000 $625,000 35 7 11 8 Seller's NC Charlotte $652,500 $615,000 134 36 60 37 Seller's NC Lake Norman $621,900 $567,500 23 3 10 80 Seller's NC Raleigh-Durham - - - - - -NJ Bergen County $1,222,500 $1,123,314 122 41 22 45 Balanced NJ Hudson County $1,407,500 $1,112,500 92 29 12 16 Buyer's NJ Morris County $674,990 $620,000 61 27 33 14 Seller's NJ Ocean County $852,500 $667,500 $20 $8 $6 $35 Seller's NM Taos - - - - - -NV Lake Tahoe $1,345,000 $2,124,500 $16 $4 $2 $225 Buyer's NV Las Vegas - - - - - -NV Reno - - - - - -NY Finger Lakes - - - - - -NY Nassau County $1,507,900 $1,362,500 $68 $7 $6 $56 Buyer's NY Staten Island $625,000 $695,000 67 16 6 45 Buyer's NY Suffolk County $795,000 $645,000 $133 $29 $25 $38 Balanced OH Cincinnati - - - - - -OH Cleveland Suburbs - - - - - - -
LUXURY MONTHLY MARKET REVIEW –ATTACHED HOMES
–
Markets with dashes do not have a significant luxury market for this report. Median prices represent properties priced above respective city benchmark prices. Prices shown for Canadian cites are shown in Canadian Dollars. State Market Name Median List Price Median Sold Price Inventory New Listings Sold Days on Market Market Status ON GTA - Durham $849,000 $823,500 27 21 10 9 Seller's ON GTA - York $810,000 $775,000 189 146 84 16 Seller's ON Hamilton $894,945 $890,000 24 13 8 34 Seller's ON Mississauga $950,000 $938,500 73 53 24 19 Seller's ON Oakville $1,417,000 $1,212,500 $38 $31 $24 $15 Seller's ON Toronto $1,299,000 $1,100,000 712 395 171 16 Seller's ON Waterloo Region $777,400 $744,500 22 11 12 36 Seller's OR Portland $729,900 $639,500 183 58 52 16 Seller's QC Montreal - - - - - -SC Charleston $1,150,000 $1,002,750 82 29 12 24 Buyer's SC Hilton Head $1,087,500 $1,100,000 $22 $5 $9 $55 Seller's SC The Grand Strand $539,000 $490,000 159 41 42 85 Seller's TN Greater Chattanooga - - - - - -TN Nashville $774,950 $622,975 128 36 34 28 Seller's TX Austin $849,500 $785,100 268 89 51 55 Balanced TX Collin County - - - - - -TX Dallas $715,000 $686,250 93 29 42 20 Seller's TX Denton County - - - - - -TX El Paso - - - - - -TX Fort Worth - - - - - -TX Greater Tyler - - - - - -TX Houston $599,950 $550,000 90 33 17 37 Balanced TX Lubbock - - - - - -TX San Angelo - - - - - -TX San Antonio $800,000 $913,500 41 8 2 46 Buyer's TX The Woodlands & Spring - - - - - -UT Park City $2,300,000 $2,197,000 79 12 13 26 Balanced UT Salt Lake City $629,950 $560,000 102 54 28 41 Seller's VA Arlington & Alexandria $1,067,000 $1,019,000 $62 $34 $31 $18 Seller's VA Charlottesville $869,900 $630,000 23 2 6 4 Seller's VA Fairfax County $845,000 $720,000 $102 $50 $87 $10 Seller's VA McLean & Vienna $1,294,500 $940,000 $24 $6 $15 $10 Seller's VA Richmond - - - - - -VA Smith Mountain Lake - - - - - -WA King County - Greater Seattle $1,212,500 $975,000 194 66 44 14 Seller's WA Seattle $1,500,000 $1,250,000 103 32 13 25 Buyer's WA Spokane - - - - - - -
CHARLESTON SOUTH CAROLINA
2023 MARCH
24 14 11 24 25 47 27 32 27 17 15 34 20 11 26 5 0 1 3 2 6 6 4 10 6 7 5 10 12 6 $5,000,000+ $4,500,000 - $4,999,999 $4,000,000 - $4,499,999 $3,500,000 - $3,999,999 $3,000,000 - $3,499,999 $2,500,000 - $2,999,999 $2,000,000 - $2,499,999 $1,750,000 - $1,999,999 $1,500,000 - $1,749,999 $1,400,000 - $1,499,999 $1,300,000 - $1,399,999 $1,200,000 - $1,299,999 $1,100,000 - $1,199,999 $1,000,000 - $1,099,999 $950,000 - $999,999 Inventory Sales Square Feet3 -RangePrice -Median SoldBeds -Median SoldBaths -Median SoldSold -TotalInventory -TotalSales Ratio -Sold/Inventory0 - 1,999 $1,175,000 3 3 9 32 28% 2,000 - 2,999 $1,150,000 4 3 23 101 23% 3,000 - 3,999 $1,512,500 4 4 34 116 29% 4,000 - 4,999 $1,678,430 5 5 12 52 23% 5,000 - 5,999 $1,700,000 6 5 3 26 12% 6,000+ $7,190,000 5 6 2 26 8% CHARLESTON SINGLE - FAMILY HOMES LUXURY INVENTORY VS. SALES | FEBRUARY 2023 Luxury Benchmark Price 1: $950,000 Seller's Market 354 Total Inventory: 83 Total Sales: 23% Total Sales Ratio2: 1 The luxury threshold price is set by The Institute for Luxury Home Marketing. 2Sales Ratio defines market speed and market type: Buyer's < 14.5%; Balanced >= 14.5 to < 20.5%; Seller's >= 20.5% plus. If >100% MLS® data reported previous month’s sales exceeded current inventory.
CHARLESTON SINGLE - FAMILY HOMES
13 - MONTH LUXURY MARKET TREND 4
MEDIAN DATA REVIEW | FEBRUARY
TOTAL INVENTORY
394 354 Feb. 2022 Feb. 2023
VARIANCE: - 10 %
VARIANCE: - 14 % $536 $460
TOTAL SOLDS
110 83
VARIANCE: - 25 %
SALE TO LIST PRICE RATIO
100.00% 96.61%
VARIANCE: - 3 %
SALES PRICE
VARIANCE: - 7 % $1.54m $1.43m
DAYS ON MARKET
VARIANCE: 1320 % 5 71
CHARLESTON MARKET SUMMARY | FEBRUARY 2023
• The Charleston single-family luxury market is a Seller's Market with a 23% Sales Ratio.
• Homes sold for a median of 96.61% of list price in February 2023.
• The most active price band is $1,000,000-$1,099,999, where the sales ratio is 109%
• The median luxury sales price for single-family homes is $1,425,000.
• The median days on market for February 2023 was 71 days, up from 5 in February 2022.
3Square foot table does not account for listings and solds where square foot data is not disclosed. 4Data reported includes Active and Sold properties and does not include Pending properties.
Solds Median Sales Price Inventory 394 419 419 433 406 397 395 375 374 379 361 373 354 110 183 197 200 208 149 119 118 119 96 100 84 83 $1,540,500 $1,500,000 $1,500,000 $1,467,500 $1,500,000 $1,425,000 $1,595,000 $1,475,625 $1,350,000 $1,472,739 $1,416,875 $1,400,000 $1,425,000 Feb-22 Mar-22 Apr-22 May-22 Jun-22 Jul-22 Aug-22 Sep-22 Oct-22 Nov-22 Dec-22 Jan-23 Feb-23
Feb. 2022 Feb. 2023 Feb. 2022 Feb. 2023 Feb. 2022 Feb. 2023 Feb. 2022 Feb. 2023 Feb. 2022 Feb. 2023
SALE PRICE PER SQFT.
CHARLESTON ATTACHED HOMES
LUXURY INVENTORY VS. SALES | FEBRUARY 2023
6 3 19 3 4 2 8 3 6 3 8 2 7 4 4 0 1 2 0 0 0 1 2 1 1 0 1 1 1 1 $2,500,000+ $2,000,000 - $2,499,999 $1,500,000 - $1,999,999 $1,400,000 - $1,499,999 $1,300,000 - $1,399,999 $1,200,000 - $1,299,999 $1,100,000 - $1,199,999 $1,000,000 - $1,099,999 $950,000 - $999,999 $900,000 - $949,999 $850,000 - $899,999 $800,000 - $849,999 $775,000 - $799,999 $750,000 - $774,999 $725,000 - $749,999 Inventory Sales
Square Feet3 -RangePrice -Median SoldBeds -Median SoldBaths -Median SoldSold -TotalInventory -TotalSales Ratio -Sold/Inventory0 - 999 NA NA NA 0 5 0% 1,000 - 1,499 $905,000 2 3 2 22 9% 1,500 - 1,999 $1,080,000 3 3 5 30 17% 2,000 - 2,499 $965,500 3 4 5 11 45% 2,500 - 2,999 NA NA NA 0 8 0% 3,000+ NA NA NA 0 6 0%
Luxury Benchmark Price 1: $725,000 Balanced Market 82 Total Inventory: 12 Total Sales: 15% Total Sales Ratio2: 1 The luxury threshold price is set by The Institute for Luxury Home Marketing. 2Sales Ratio defines market speed and market type: Buyer's < 14.5%; Balanced >= 14.5 to < 20.5%; Seller's >= 20.5% plus. If >100% MLS® data reported previous month’s sales exceeded current inventory.
CHARLESTON ATTACHED HOMES
13 - MONTH LUXURY MARKET TREND 4
MEDIAN DATA REVIEW | FEBRUARY
TOTAL INVENTORY TOTAL SOLDS
- 15 % 96 82
SALE PRICE PER SQFT.
VARIANCE: - 19 % $727 $586
SALE TO LIST PRICE RATIO
100.00% 97.73%
VARIANCE: - 2 %
SALES PRICE
$1.13m $1.00m
DAYS ON MARKET
20 24
VARIANCE: 20 %
CHARLESTON MARKET SUMMARY | FEBRUARY 2023
• The Charleston attached luxury market is a Balanced Market with a 15% Sales Ratio.
• Homes sold for a median of 97.73% of list price in February 2023.
• The most active price band is $1,000,000-$1,099,999, where the sales ratio is 67%
• The median luxury sales price for attached homes is $1,002,750.
• The median days on market for February 2023 was 24 days, up from 20 in February 2022.
3Square foot table does not account for listings and solds where square foot data is not disclosed. 4Data reported includes Active and Sold properties and does not include Pending properties.
96 87 89 91 103 100 102 81 78 79 79 75 82 27 42 42 41 42 27 24 36 22 22 18 15 12 $1,125,000 $927,500 $1,087,500 $951,000 $1,107,500 $1,150,000 $927,000 $899,500 $1,208,858 $882,552 $952,500 $950,000 $1,002,750 Feb-22 Mar-22 Apr-22 May-22 Jun-22 Jul-22 Aug-22 Sep-22 Oct-22 Nov-22 Dec-22 Jan-23 Feb-23 Solds Sale Price Inventory
VARIANCE:
%
VARIANCE:
%
VARIANCE:
- 56
27 12
- 11
Feb. 2022 Feb. 2023 Feb. 2022 Feb. 2023 Feb. 2022 Feb. 2023 Feb. 2022 Feb. 2023 Feb. 2022 Feb. 2023 Feb. 2022 Feb. 2023


PARKER MOORE & MIKE MILLIKIN 843.801.4888 | Parker@pointbreakpropertiesre.com 843.270.3481 | Mike@pointbreakpropertiesre.com Thank you for taking time to view this report. For more information about this report and the services we can offer you and your luxury property, please give us a call at 843.801.4888 or 843.270.3481. - Parker Moore and Mike Millikin
