PARKER MOORE & MIKE MILLIKIN
LUXURY MARKET REPORT


CHARLESTON | AUGUST 2023

843.270.3481
mike@pointbreakpropertiesre.com

Sharpened by over 30 years of savvy expertise, insight, and experience, Point Break Properties is an elite group of top-producing luxury real estate professionals in Charleston. Our agents are relentless advocates for our clients and are passionate about delivering singular, bespoke, and exceptional experiences. The access our advisors have to the most relevant, reliable, & up-to-date industry information and education is paramount. The removal of uncertainty allows our team to expertly advise at every stage of a real estate transaction which enables our clients to make powerful and confident decisions.

Point Break Properties advisors boast backgrounds in Real Estate Appraisal & Property Valuation, Marketing, Commodity Markets, and New Home Construction, to name a few. “Often the real estate process is quite emotional for first-time and primary home buyers and sellers, while what developers and investors are most focused on are the analytics and bottom-line dollars.” Point Break’s diverse experience affords keen insight into residential investments, executive and corporate relocation services, resort/vacation rentals, and allows for the ability to adapt to constant changes in the luxury market.
The leadership team at Point Break Properties consists of Mike Millikin and Parker Moore. Both raised in the Lowcountry and as best friends for over 20 years, they have the proactive insight & acumen to service their affluent clientele, their team, and their equity partners in the Charleston market. Together they manage both the Point Break Properties team as well as the Realty One Group

MIKE MILLIKIN REALTOR®, GUILD
Managing Partner Point Break Properties
PARKER MOORE REALTOR®, CLHMS Managing Partner Point Break Properties 843.801.4888 parker@pointbreakpropertiesre.com WWW.POINTBREAKPROPERTIESRE.COM
TABLE OF CONTENTS
PAGE 4 LUXURY REPORT EXPLAINED

PAGE 5 WELCOME MESSAGE
PAGE 6-9 NORTH AMERICAN LUXURY MARKET REVIEW
PAGE 10 13-MONTH MARKET TRENDS
PAGE 11 SINGLE-FAMILY HOMES MONTHLY OVERVIEW
PAGE 12 ATTACHED HOMES MONTHLY OVERVIEW
PAGE 13-16 MONTHLY STATISTICS BY CITY - Single-Family Homes

PAGE 17-20 MONTHLY STATISTICS BY CITY - Attached Homes
PAGE 21 LOCAL LUXURY MARKET REVIEW
PAGE 22-23 SINGLE-FAMILY HOMES - Monthly Statistics
PAGE 24-25 ATTACHED HOMES - Monthly Statistics
PAGE 26 THANK YOU
LUXURY REPORT EXPLAINED –
The Institute for Luxury Home Marketing has analyzed a number of metrics — including sales prices, sales volumes, number of sales, sales-price-to-list-price ratios, days on market and price-per-square-foot – to provide you a comprehensive North American Luxury Market report. Additionally, we have further examined all of the individual luxury markets to provide both an overview and an in-depth analysis - including, where data is sufficient, a breakdown by luxury single-family homes and luxury attached homes.
It is our intention to include additional luxury markets on a continual basis. If your market is not featured, please contact us so we can implement the necessary qualification process. More in-depth reports on the luxury communities in your market are available as well.
Looking through this report, you will notice three distinct market statuses, Buyer's Market, Seller's Market, and Balanced Market. A Buyer's Market indicates that buyers have greater control over the price point. This market type is demonstrated by a substantial number of homes on the market and few sales, suggesting demand for residential properties is slow for that market and/or price point.
By contrast, a Seller's Market gives sellers greater control over the price point. Typically, this means there are few homes on the market and a generous demand, causing competition between buyers who ultimately drive sales prices higher.
A Balanced Market indicates that neither the buyers nor the sellers control the price point at which that property will sell and that there is neither a glut nor a lack of inventory. Typically, this type of market sees a stabilization of both the list and sold price, the length of time the property is on the market as well as the expectancy amongst homeowners in their respective communities – so long as their home is priced in accordance with the current market value.
REPORT GLOSSARY
REMAINING INVENTORY: The total number of homes available at the close of a month.
DAYS ON MARKET: Measures the number of days a home is available on the market before a purchase offer is accepted.
LUXURY BENCHMARK PRICE: The price point that marks the transition from traditional homes to luxury homes.
NEW LISTINGS: The number of homes that entered the market during the current month.
PRICE PER SQUARE FOOT: Measures the dollar amount of the home's price for an individual square foot.
SALES RATIO: Sales Ratio defines market speed and determines whether the market currently favors buyers or sellers. Buyer's Market = up to 14%; Balanced Market = 15 to 20%; Seller's Market = 21% plus. If >100%, sales from previous month exceed current inventory.
SP/LP RATIO: The Sales Price/List Price Ratio compares the value of the sold price to the value of the list price.
–
LUXURY MARKET REPORT
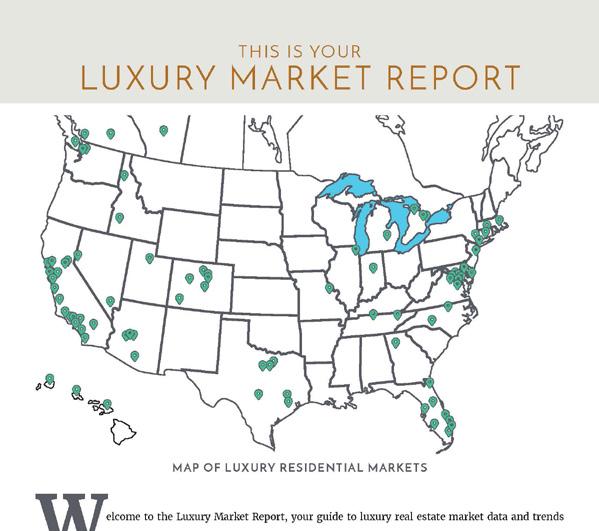
MAP OF LUXURY RESIDENTIAL MARKETS
Welcome to the Luxury Market Report, your guide to luxury real estate market data and trends for North America. Produced monthly by The Institute for Luxury Home Marketing, this report provides an in-depth look at the top residential markets across the United States and Canada. Within the individual markets, you will find established luxury benchmark prices and detailed survey of luxury active and sold properties designed to showcase current market status and recent trends. The national report illustrates a compilation of the top North American markets to review overall standards and trends.
Copyright © 2023 Institute for Luxury Home Marketing | www.luxuryhomemarketing.com | 214.485.3000
The Luxury Market Report is a monthly analysis provided by The Institute for Luxury Home Marketing. Luxury benchmark prices are determined by The Institute. This active and sold data has been provided by REAL Marketing, who has compiled the data through various sources, including local MLS boards, local tax records and Realtor.com. Data is deemed reliable to the best of our knowledge, but is not guaranteed.
THIS IS YOUR
NORTH AMERICAN LUXURY REVIEW
Understanding the New Reality of 2023
In this month’s report, we take a step back in time to understand why the luxury real market has truly changed, how this new reality for buyers and sellers was created, and why it needs to be appreciated.
Using 2019 as our benchmark year, a year that saw a steady and more typical sales cycle but one that also showed a growing confidence in the purchase of luxury homes as the year progressed. Growth was driven by demand as buyers saw financial potential due to strong stability within the luxury real estate market.

Inventory availability in 2019 was not considered to be a factor in preventing sales, as most markets typically saw a significantly greater number of homes for sale than potential buyers. It’s interesting to note that prior to the pandemic it was rare for the luxury real estate market not to be more favorable to buyers, and equally, expectations were that homes would take much longer to sell than those in the traditional market.
As we all know, and it has been well documented, this all changed with the onset of the Covid-19 pandemic and the surge in demand for luxury properties. Demand outstripped supply at a dramatic and voracious level so that even the rapid change of the market in April 2022, which saw an influx of new listings, proved to be too little, given the uptake in sales during May and June of the same year.
Like 2019, in 2023 there has been a return of confidence in the purchase of homes, month over month sales volumes have increased, after the market faltered in the last four months of 2022. However, this is where the similarities end, as while demand is still important, the new reality is the status of the luxury real estate market is now clearly correlated to the level of available inventory.
Comparing inventory data in 2023 shows the average level of total listings per month is still approximately 40% below levels in 2019.
The data also clearly shows that it is not just the depleted level of inventory that is holding back sales, but as we can see from the charts below, it is the actual number of new listings entering the market each month that must also be directly correlated to sales activity – if the level of new inventory increases, so does the number of sold properties for the month, and vice versa.
New Listings & Solds for Single Famlly Homes in 2023
& Solds for Attached Properties in 2023
Putting this into context against 2019’s statistical data, specifically for May, June, and July, the percentage of sales against total inventory is, on average, around 17%, and against new inventory, the sales percentage is about 68%. In 2023, there is a distinct change with the percentage of sales against total inventory increasing to, on average, 35%, but more significantly, against new inventory, the sales percentage is about 95%.
0 1,000 2,000 3,000 4,000 5,000 6,000 7,000 8,000 January Feb March April May June July
Listings
New Listings Solds 0 5,000 10,000 15,000 20,000 25,000 January Feb March April May June July
New
New Listings Solds
This new reality of understanding inventory levels compared to sales is the key to appreciating how the market will continue to favor sellers, especially as many homeowners continue to remain reluctant to list their properties.
It’s safe to say that we can all recognize that the luxury real estate market has shifted, but overall, the market has now found its new norm, slowing from the fast-paced seller’s market of previous years. So, the key to selling and achieving the maximum return on your property lies in leveraging what the market is currently demanding.
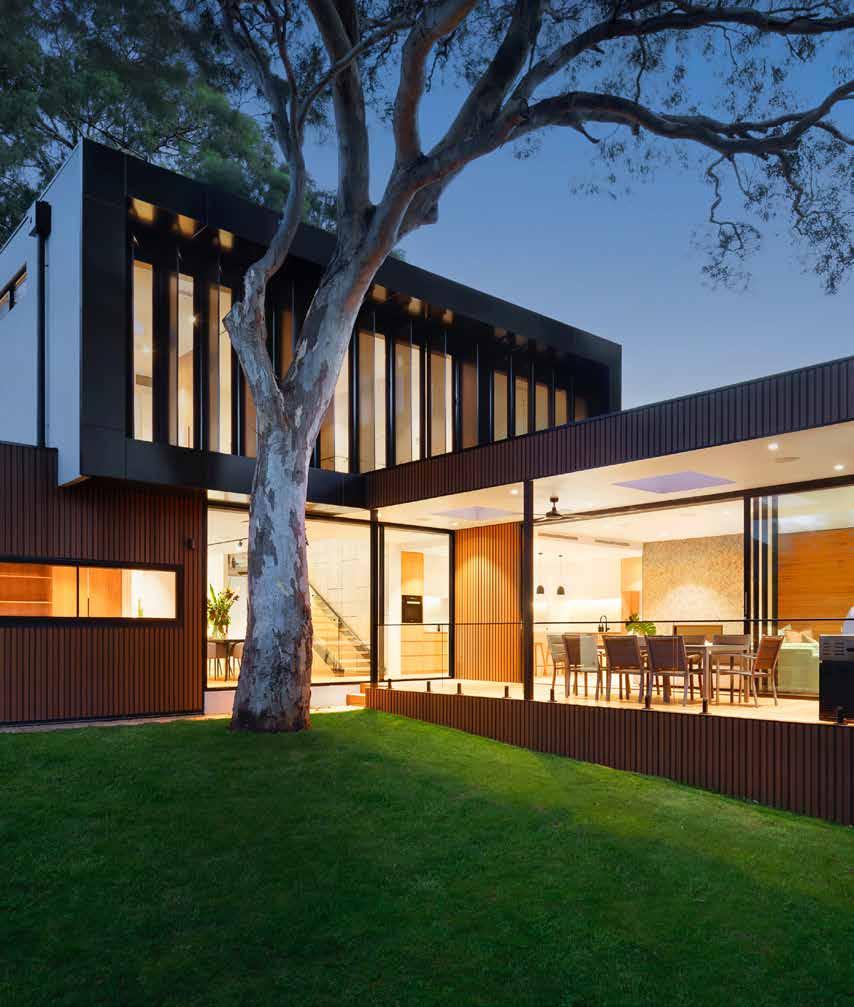
While each market certainly has its own nuances, one trend has become very apparent in the luxury market – it’s all about the ‘experience.’ No matter who we talk to, savvy homeowners, luxury real estate professionals, developers, architects and designers, they are all putting their emphasis on defining the experience as part of their luxury marketing message.

The general message is that luxury is not about throwing money around by adding more fancy materials but rather about creating a comfortable experience that affords the feeling of luxurious wellness and safety.
In an era where mass consumption means both the upper class and the middle class can own the same luxury brand, the rich are forgoing material goods to invest in the immaterial as a way to signify status.
This is one of the reasons why luxury buyers are investing in smart homes and how this technology has often become a priority in their choice of new homes. Not only does a smart home add cosmetic value, but it also improves the quality of their lifestyle as they can use technology to create healthier environments, control daily routines and provide security and safety when at home or even at a distance.
The growth of the smart home industry is set to grow as the affluent and their design, construction, and architectural teams have moved from the “fun to have” to it becoming a necessary component to augment their lifestyle.

Developers who build with an eye toward environmental responsibility have been rewarded with high demand. Buyers are paying top dollar for properties that properly utilize green building technology and carbon-neutral energy programs, incorporating outdoor elements within the design, and implementing cleaner air systems and paint.
Many developers and architects are not seeing LEED (Leadership in Energy and Environmental Design – the gold standard of environmentally conscious and energy efficient design) as a plateau to reach. Instead, it is their starting point for a new way of thinking as well as making economic sense for future generations. It is a sentiment that holds true no matter the demographic or property being sold or purchased.
Members of The Institute are also noticing that affluent customers are putting greater expectations on the service levels of their realtors. They are looking for innovation in marketing their properties with the advent of AI and expertise in finding amenity-rich properties in preferred locations.
For homeowners looking for their next home, it is still important to recognize that although costs to purchase will be much higher currently, over the long-term real estate offers one of the most consistent ways to see a good return. More importantly, ownership provides security and a haven for their family.
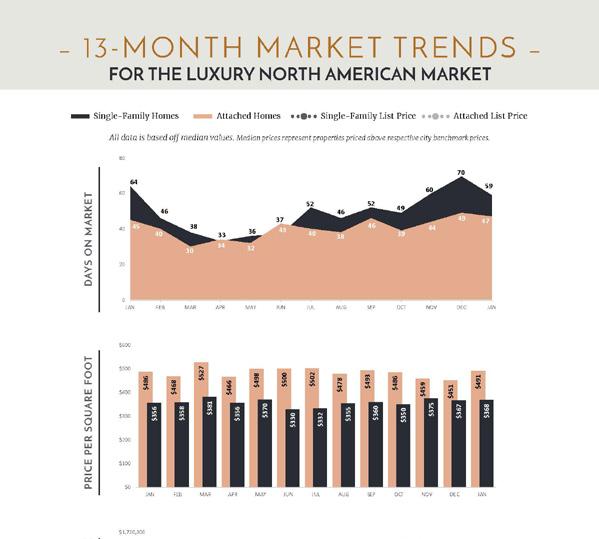
FOR THE LUXURY NORTH AMERICAN MARKET
Single-Family Homes Attached Homes Single-Family List Price Attached List Price
All data is based off median values. Median prices represent properties priced above respective city benchmark prices.
– 13 -
–
MONTH MARKET TRENDS
DAYS ON MARKET SALES PRICE VS. LIST PRICE
12 17 21 22 25 32 35 40 24 17 14 14 16 12 18 19 24 28 29 32 29 23 19 17 17 18 0 5 10 15 20 25 30 35 40 45 JUL AUG SEP OCT NOV DEC JAN FEB MAR APR MAY JUN JUL PRICE PER SQUARE FOOT $535 $517 $523 $500 $500 $505 $488 $492 $498 $478 $489 $491 $496 $427 $417 $422 $414 $410 $401 $385 $410 $408 $402 $423 $409 $411 $0 $100 $200 $300 $400 $500 $600 JUL AUG SEP OCT NOV DEC JAN FEB MAR APR MAY JUN JUL $500,000 $700,000 $900,000 $1,100,000 $1,300,000 $1,500,000 $1,700,000 $1,900,000 JUL AUG SEP OCT NOV DEC JAN FEB MAR APR MAY JUN JUL
LUXURY MONTHLY MARKET REVIEW –
A Review of Key Market Differences Year over Year
SINGLE-FAMILY HOMES MARKET SUMMARY | JULY 2023
• Official Market Type: Seller's with a 30.13% Sales Ratio.1
• Homes are selling for an average of 99.43% of list price.
• The median luxury threshold2 price is $900,000, and the median luxury home sales price is $1,331,389.
• Markets with the Highest Median Sales Price: Aspen ($10,635,000), Vail ($6,490,000), Telluride ($6,100,000), and Whistler ($4,500,000).
• Markets with the Highest Sales Ratio: East Bay, CA (119%), Howard County, MD (100%), Hamilton County, IN (90%), and St. Louis, MO (89%).
–
1Sales Ratio defines market speed and market type: Buyer's < 15.5%; Balanced >= 15.5 to < 20.5%; Seller's >= 20.5% plus. If >100%, sales from previous month exceeds current inventory. 2The luxury threshold price is set by The Institute for Luxury Home Marketing. SINGLE-FAMILY HOMES Median List Price $1,548,500 $1,649,500 Median Sale Price $1,309,000 $1,331,389 Median SP/LP Ratio 100.00% 99.43% Total Sales Ratio 34.14% 30.13% Median Price per Sq. Ft. $427 $411 Total Inventory 54,919 57,289 New Listings 20,330 18,704 Total Sold 18,751 17,263 Median Days on Market 12 16 Average Home Size 3,222 3,248
July 2022 | July 2023 Median prices represent properties priced above respective city benchmark prices. July 2023 July 2022 July 2023 July 2022
New Listings 1,626 Total Sold 1,488 Med. Sale Price $22,389 Days on Market 4 Sales Ratio 4.01%
– LUXURY MONTHLY MARKET REVIEW –
A Review of Key Market Differences Year over Year
ATTACHED HOMES
$49,500
4.27%
ATTACHED HOMES MARKET SUMMARY | JULY 2023
• Official Market Type: Seller's Market with a 25.23% Sales Ratio 1
• Attached homes are selling for an average of 99.96% of list price.
• The median luxury threshold2 price is $700,000, and the median attached luxury sale price is $878,250
• Markets with the Highest Median Sales Price: Vail ($2,525,000), Palm Beach Towns ($2,506,000), San Francisco ($2,400,000), and Telluride ($2,400,000).
• Markets with the Highest Sales Ratio: Howard County, MD (140%),
County, MD (113%), Fairfax County, VA (107%), and Anne
Arundel
1Sales Ratio defines market speed and market type: Buyer's < 15.5%; Balanced >= 15.5 to < 20.5%; Seller's >= 20.5% plus. If >100%, sales from previous month exceeds current inventory. 2The luxury threshold price is set by The Institute for Luxury Home Marketing. Median List Price $935,000 $995,000 Median Sale Price $828,750 $878,250 Median SP/LP Ratio 100.00% 99.96% Total Sales Ratio 29.50% 25.23% Median Price per Sq. Ft. $535 $496 Total Inventory 16,073 18,003 New Listings 5,900 6,167 Total Sold 4,742 4,543 Median Days on Market 12 18 Average Home Size 1,811 1,893
Montgomery
County, MD (89%).
Median prices represent properties priced above respective city benchmark prices.
2022
July 2023 July 2023 July 2022 July 2023 July 2022
July
|
New Listings 267 Total Sold
Med. Sale Price
Days
Market
199
on
6 Sales Ratio
LUXURY MONTHLY MARKET REVIEW –
SINGLE-FAMILY HOMES
Median prices represent properties priced above respective city benchmark prices. Prices shown for Canadian cites are shown in Canadian Dollars. –
State Market Name Median List Price Median Sold Price Inventory New Listings Sold Days on Market Market Status AB Calgary $1,190,000 $975,000 633 379 275 19 Seller's AZ Chandler and Gilbert $1,156,401 $990,000 120 48 69 36 Seller's AZ Flagstaff $1,675,000 $1,492,500 99 33 20 42 Balanced AZ Mesa $899,995 $855,000 154 47 57 41 Seller's AZ Paradise Valley $5,950,000 $4,350,000 105 18 22 84 Balanced AZ Phoenix $875,000 $795,000 616 189 261 41 Seller's AZ Scottsdale $2,318,998 $1,710,000 566 140 143 63 Seller's AZ Tucson $699,000 $661,250 756 220 276 17 Seller's BC Mid Vancouver Island $1,649,000 $1,600,000 234 89 35 41 Buyer's BC Okanagan Valley $1,749,900 $1,575,000 1069 314 84 37 Buyer's BC Vancouver $4,288,000 $3,104,000 1195 338 70 15 Buyer's BC Victoria $2,424,500 $1,965,000 194 104 28 17 Buyer's BC Whistler $5,980,000 $4,500,000 47 14 4 136 Buyer's CA Central Coast $2,881,450 $2,402,500 272 77 68 15 Seller's CA East Bay $2,299,000 $1,988,750 288 144 344 10 Seller's CA Greater Palm Springs $1,755,000 $1,742,500 320 78 64 50 Balanced CA Lake Tahoe $2,569,500 $1,790,000 216 69 31 11 Buyer's CA Los Angeles Beach Cities $5,995,000 $3,550,000 395 124 65 19 Balanced CA Los Angeles City $4,999,999 $3,775,000 668 208 106 26 Balanced CA Los Angeles The Valley $2,688,500 $2,050,000 614 253 168 36 Seller's CA Marin County $3,495,000 $3,030,000 95 24 42 26 Seller's CA Napa County $3,550,000 $2,527,500 140 14 14 71 Buyer's CA Orange County $2,999,999 $2,200,000 950 353 373 18 Seller's CA Placer County $1,150,000 $1,099,450 267 84 96 12 Seller's CA Sacramento $995,000 $925,000 630 249 261 12 Seller's CA San Diego $2,599,998 $1,799,450 858 350 374 11 Seller's CA San Francisco $4,499,000 $3,050,000 105 26 39 15 Seller's CA San Luis Obispo County $1,762,000 $1,477,500 186 58 62 30 Seller's CA Silicon Valley $4,288,800 $3,115,500 451 205 230 10 Seller's CA Sonoma County $2,474,000 $1,735,000 273 51 50 47 Balanced CA Ventura County $2,400,000 $1,697,500 249 88 82 47 Seller's CO Aspen $17,500,000 $10,635,000 92 20 4 27 Buyer's CO Boulder $2,200,000 $1,582,262 309 100 90 39 Seller's CO Colorado Springs $924,950 $895,000 518 168 113 11 Seller's CO Denver $1,650,000 $1,390,000 827 302 267 8 Seller's CO Douglas County $1,295,000 $1,200,000 369 146 141 11 Seller's CO Durango $1,518,000 $1,250,000 130 31 21 55 Balanced CO Summit County $3,250,000 $1,940,000 86 26 9 30 Buyer's
LUXURY MONTHLY MARKET REVIEW –SINGLE-FAMILY HOMES
–
Median prices represent properties priced above respective city benchmark prices. Prices shown for Canadian cites are shown in Canadian Dollars. State Market Name Median List Price Median Sold Price Inventory New Listings Sold Days on Market Market Status CO Telluride $6,600,000 $6,100,000 113 21 2 554 Buyer's CO Vail $5,900,000 $6,490,000 103 26 4 175 Buyer's CT Central Connecticut $699,900 $620,000 354 107 209 5 Seller's CT Coastal Connecticut $2,350,000 $1,786,350 511 124 214 23 Seller's DC Washington D.C. $4,000,000 $2,450,000 47 10 16 6 Seller's DE Sussex County Coastal $1,432,500 $1,349,900 144 29 39 10 Seller's FL Boca Raton/Delray Beach $2,795,000 $2,062,500 485 104 82 58 Balanced FL Brevard County $849,000 $768,000 316 125 122 12 Seller's FL Broward County $1,794,000 $1,499,500 675 186 96 37 Buyer's FL Coastal Pinellas County $2,250,000 $1,850,000 94 17 21 49 Seller's FL Ft. Lauderdale $4,800,000 $3,397,500 170 24 16 116 Buyer's FL Jacksonville Beaches $1,375,000 $1,150,138 389 102 98 34 Seller's FL Lee County $1,400,000 $1,400,000 753 164 105 35 Buyer's FL Marco Island $2,595,000 $2,406,250 129 20 18 60 Buyer's FL Miami $2,150,000 $1,315,000 960 223 127 51 Buyer's FL Naples $5,499,000 $3,400,000 371 48 33 110 Buyer's FL Orlando $1,250,000 $1,100,000 840 256 181 15 Seller's FL Palm Beach Towns $3,795,000 $3,085,000 267 36 18 80 Buyer's FL Sarasota & Beaches $2,799,000 $2,000,000 442 78 51 44 Buyer's FL South Pinellas County $1,462,500 $1,187,500 264 60 74 28 Seller's FL South Walton $2,400,000 $2,370,000 500 84 33 20 Buyer's FL Tampa $772,500 $725,075 1193 433 432 15 Seller's GA Atlanta $1,675,000 $1,150,000 713 235 195 10 Seller's GA Duluth $1,595,000 $1,580,000 19 6 8 14 Seller's HI Island of Hawaii $2,137,500 $1,512,500 156 30 26 27 Balanced HI Kauai $2,645,000 $2,595,000 74 14 7 8 Buyer's HI Maui $3,695,000 $2,600,000 161 29 21 96 Buyer's HI Oahu $3,190,000 $2,325,000 193 47 31 13 Balanced IA Greater Des Moines $650,000 $617,500 484 104 115 13 Seller's ID Ada County $798,995 $766,795 703 232 251 19 Seller's ID Northern Idaho $1,700,000 $1,375,000 524 122 63 63 Buyer's IL Chicago $1,599,450 $1,300,000 640 260 297 10 Seller's IL DuPage County $1,200,000 $980,000 280 126 138 9 Seller's IL Lake County $1,275,000 $917,500 295 111 130 8 Seller's IL Will County $689,900 $650,000 267 125 162 8 Seller's IN Hamilton County $837,450 $775,000 162 52 145 4 Seller's KS Johnson County $826,340 $817,001 491 93 168 3 Seller's MA Cape Cod $2,650,000 $2,100,000 175 40 31 44 Balanced
LUXURY MONTHLY MARKET REVIEW –SINGLE-FAMILY HOMES
–
Median prices represent properties priced above respective city benchmark prices. Prices shown for Canadian cites are shown in Canadian Dollars. State Market Name Median List Price Median Sold Price Inventory New Listings Sold Days on Market Market Status MA Greater Boston $3,259,000 $2,712,500 137 35 56 19 Seller's MA South Shore $1,999,900 $1,400,000 85 24 33 16 Seller's MD Anne Arundel County $1,025,000 $950,000 183 71 101 7 Seller's MD Baltimore City $881,950 $785,500 20 6 12 9 Seller's MD Baltimore County $1,199,000 $940,000 140 46 53 9 Seller's MD Frederick County $865,999 $848,500 61 27 32 6 Seller's MD Howard County $1,164,236 $966,450 60 37 60 6 Seller's MD Montgomery County $1,999,900 $1,650,000 153 45 107 7 Seller's MD Talbot County $3,985,000 $1,575,000 42 6 8 11 Balanced MD Worcester County $1,000,000 $807,500 49 15 16 8 Seller's MI Grand Traverse $1,200,000 $910,000 91 29 20 44 Seller's MI Livingston County $750,000 $717,500 101 32 38 13 Seller's MI Monroe County $674,900 $604,500 25 7 4 21 Balanced MI Oakland County $774,900 $669,500 778 323 306 9 Seller's MI Washtenaw County $991,998 $725,000 154 37 67 6 Seller's MI Wayne County $749,900 $600,000 191 73 102 9 Seller's MN Olmsted County $893,700 $710,000 82 21 18 12 Seller's MN Twin Cities $1,199,000 $997,500 880 273 234 11 Seller's MO Kansas City $693,950 $685,000 1514 293 487 5 Seller's MO St. Louis $895,000 $727,500 122 50 108 5 Seller's NC Asheville $1,124,950 $882,500 280 79 83 7 Seller's NC Charlotte $1,227,000 $945,000 550 176 330 4 Seller's NC Lake Norman $1,200,000 $1,082,390 211 70 83 11 Seller's NC Raleigh-Durham $1,180,000 $970,000 482 122 263 4 Seller's NJ Bergen County $2,199,995 $1,650,000 253 76 79 16 Seller's NJ Hudson County $1,562,500 $1,337,778 22 9 8 13 Seller's NJ Morris County $1,699,000 $1,505,000 137 41 77 15 Seller's NJ Ocean County $949,900 $800,000 506 159 116 15 Seller's NM Taos $1,212,500 $993,250 74 13 10 32 Buyer's NV Lake Tahoe $3,750,000 $2,300,000 93 24 15 110 Balanced NV Las Vegas $1,725,000 $1,365,000 604 169 121 25 Balanced NV Reno $1,923,500 $1,550,000 157 47 23 51 Buyer's NY Finger Lakes $1,775,000 $1,569,000 23 5 4 16 Balanced NY Nassau County $1,899,000 $1,570,000 671 178 167 27 Seller's NY Staten Island $1,200,000 $1,080,000 159 46 17 66 Buyer's NY Suffolk County $1,950,000 $1,252,500 897 240 136 26 Balanced OH Cincinnati $849,450 $700,000 256 58 107 4 Seller's OH Cleveland Suburbs $689,000 $685,000 45 19 35 15 Seller's
LUXURY MONTHLY MARKET REVIEW –SINGLE-FAMILY HOMES
–
Median prices represent properties priced above respective city benchmark prices. Prices shown for Canadian cites are shown in Canadian Dollars. State Market Name Median List Price Median Sold Price Inventory New Listings Sold Days on Market Market Status OH Columbus $849,990 $762,000 501 168 226 5 Seller's ON GTA - Durham $1,750,000 $1,630,851 307 217 82 11 Seller's ON GTA - York $2,460,400 $1,900,000 692 437 170 12 Seller's ON Hamilton $1,912,500 $1,592,500 250 120 36 21 Buyer's ON Mississauga $2,986,500 $2,523,500 160 81 22 16 Buyer's ON Oakville $2,999,000 $2,050,001 161 99 43 15 Seller's ON Toronto $3,499,999 $3,250,000 441 216 71 13 Balanced ON Waterloo Region $1,399,900 $1,265,000 $231 $176 $71 $10 Seller's OR Portland $1,299,999 $1,125,000 812 275 205 11 Seller's SC Charleston $1,812,500 $1,487,000 446 119 147 12 Seller's SC Hilton Head $1,995,000 $1,525,000 232 49 63 35 Seller's SC The Grand Strand $869,950 $792,955 396 107 86 82 Seller's TN Greater Chattanooga $975,000 $820,000 210 61 49 9 Seller's TN Knoxville $989,500 $940,000 146 52 65 5 Seller's TN Nashville $1,699,900 $1,325,000 915 285 244 10 Seller's TX Austin $1,195,000 $1,008,800 1427 409 305 28 Seller's TX Collin County $750,000 $712,200 1342 548 576 19 Seller's TX Dallas $1,395,000 $1,003,000 482 179 190 12 Seller's TX Denton County $781,864 $755,000 1210 456 404 18 Seller's TX El Paso $645,875 $592,500 208 45 47 19 Seller's TX Fort Worth $876,464 $800,000 1078 372 423 18 Seller's TX Greater Tyler $684,800 $675,000 246 108 43 21 Balanced TX Houston $995,000 $845,000 1155 473 322 12 Seller's TX Lubbock $644,500 $615,000 165 80 40 88 Seller's TX San Angelo $646,500 $548,500 96 28 14 123 Buyer's TX San Antonio $799,995 $755,323 752 217 176 28 Seller's TX The Woodlands & Spring $838,000 $810,250 244 119 132 8 Seller's UT Park City $4,492,500 $2,875,000 250 61 23 27 Buyer's UT Salt Lake City $1,179,900 $1,005,000 519 177 143 23 Seller's VA Arlington & Alexandria $2,162,000 $1,900,000 90 30 35 12 Seller's VA Charlottesville $1,297,000 $1,150,000 112 29 41 5 Seller's VA Fairfax County $2,088,880 $1,500,000 325 110 152 6 Seller's VA McLean & Vienna $2,699,000 $1,850,000 141 46 49 9 Seller's VA Richmond $823,900 $778,700 341 102 175 8 Seller's VA Smith Mountain Lake $1,699,900 $1,025,000 39 11 9 12 Seller's WA King County $2,109,000 $1,705,250 913 414 468 6 Seller's WA Seattle $2,095,000 $1,577,500 235 97 111 6 Seller's WA Spokane $1,125,000 $1,072,500 178 66 32 18 Balanced
LUXURY MONTHLY MARKET REVIEW –ATTACHED HOMES
–
Markets with dashes do not have a significant luxury market for this report. Median prices represent properties priced above respective city benchmark prices. Prices shown for Canadian cites are shown in Canadian Dollars. State Market Name Median List Price Median Sold Price Inventory New Listings Sold Days on Market Market Status AB Calgary $799,900 $726,000 153 62 47 25 Seller's AZ Chandler and Gilbert - - - - - -AZ Flagstaff - - - - - -AZ Mesa - - - - - -AZ Paradise Valley - - - - - -AZ Phoenix - - - - - -AZ Scottsdale $890,000 $790,000 176 39 53 45 Seller's AZ Tucson - - - - - -BC Mid Vancouver Island $872,000 $761,500 79 21 14 31 Balanced BC Okanagan Valley - - - - - -BC Vancouver $1,899,999 $1,797,000 1091 440 88 11 Buyer's BC Victoria $948,950 $925,000 152 93 56 19 Seller's BC Whistler $2,480,000 $2,337,500 55 18 4 25 Buyer's CA Central Coast $1,295,000 $1,109,000 48 22 14 18 Seller's CA East Bay $1,150,000 $1,056,390 115 57 95 9 Seller's CA Greater Palm Springs - - - - - -CA Lake Tahoe $1,597,000 $1,250,000 46 12 11 23 Seller's CA Los Angeles Beach Cities $1,799,000 $1,650,000 157 58 43 10 Seller's CA Los Angeles City $1,809,500 $1,350,000 374 136 69 22 Balanced CA Los Angeles The Valley $822,500 $786,694 100 51 88 19 Seller's CA Marin County $1,174,500 $1,375,000 20 12 15 19 Seller's CA Napa County - - - - - -CA Orange County $1,265,000 $1,157,000 291 158 219 17 Seller's CA Placer County - - - - - -CA Sacramento - - - - - -CA San Diego $1,375,000 $1,087,500 293 169 182 9 Seller's CA San Francisco $2,695,000 $2,400,000 117 10 11 47 Buyer's CA San Luis Obispo County - - - - - -CA Silicon Valley $1,666,495 $1,553,000 102 65 68 9 Seller's CA Sonoma County $855,000 $828,600 9 5 6 16 Seller's CA Ventura County $809,000 $735,000 97 31 51 36 Seller's CO Aspen $3,500,000 46 3 0 Buyer's CO Boulder $975,000 $875,000 85 29 23 44 Seller's CO Colorado Springs $559,000 $523,495 45 14 12 15 Seller's CO Denver $895,000 $775,944 165 55 65 17 Seller's CO Douglas County $595,000 $599,900 15 9 7 48 Seller's CO Durango $793,905 $875,000 31 7 5 107 Balanced CO Summit County $1,225,000 $1,100,000 26 7 13 11 Seller's
LUXURY MONTHLY MARKET REVIEW –ATTACHED HOMES
–
Markets with dashes do not have a significant luxury market for this report. Median prices represent properties priced above respective city benchmark prices. Prices shown for Canadian cites are shown in Canadian Dollars. State Market Name Median List Price Median Sold Price Inventory New Listings Sold Days on Market Market Status CO Telluride $2,498,000 $2,400,000 41 11 5 44 Buyer's CO Vail $3,895,000 $2,525,000 83 22 5 0 Buyer's CT Central Connecticut - - - - - -CT Coastal Connecticut $1,199,000 $738,000 129 33 52 17 Seller's DC Washington D.C. $1,947,500 $1,627,500 206 57 64 15 Seller's DE Sussex County Coastal $1,064,500 $900,000 20 7 6 4 Seller's FL Boca Raton/Delray Beach $1,099,000 $755,000 313 87 64 38 Balanced FL Brevard County $740,000 $649,950 167 54 28 49 Balanced FL Broward County $699,000 $609,000 745 175 85 23 Buyer's FL Coastal Pinellas County $1,259,500 $1,112,500 168 41 30 22 Balanced FL Ft. Lauderdale $2,635,000 $1,720,000 143 27 7 55 Buyer's FL Jacksonville Beaches $1,150,000 $1,212,500 39 14 18 39 Seller's FL Lee County $849,500 $745,000 420 72 43 30 Buyer's FL Marco Island $1,772,000 $1,587,500 56 5 8 75 Buyer's FL Miami $1,490,000 $1,280,000 1319 220 93 119 Buyer's FL Naples $2,390,000 $1,850,000 231 36 29 40 Buyer's FL Orlando $559,450 $565,000 282 78 49 15 Balanced FL Palm Beach Towns $1,749,500 $2,506,000 234 54 39 15 Balanced FL Sarasota & Beaches $1,555,000 $1,250,000 255 60 31 39 Buyer's FL South Pinellas County $1,100,000 $970,000 263 74 39 32 Buyer's FL South Walton $1,475,000 $999,000 209 34 25 35 Buyer's FL Tampa $1,103,204 $770,000 236 74 51 8 Seller's GA Atlanta $745,000 $620,000 548 203 145 15 Seller's GA Duluth - - - - - -HI Island of Hawaii $2,800,000 $2,397,500 21 6 14 79 Seller's HI Kauai $1,697,000 $1,482,500 30 11 12 4 Seller's HI Maui $1,991,500 $1,512,500 96 27 18 83 Balanced HI Oahu $1,199,000 $989,477 454 95 88 14 Balanced IA Greater Des Moines - - - - - -ID Ada County $688,950 $574,888 70 24 7 29 Buyer's ID Northern Idaho - - - - - -IL Chicago $1,249,000 $950,000 811 277 161 22 Balanced IL DuPage County $1,129,500 $703,800 20 10 11 12 Seller's IL Lake County - - - - - -IL Will County - - - - - -IN Hamilton County - - - - - -KS Johnson County $634,000 $725,000 153 16 23 40 Balanced MA Cape Cod $995,000 $760,000 29 9 10 82 Seller's
LUXURY MONTHLY MARKET REVIEW –ATTACHED HOMES
–
Markets with dashes do not have a significant luxury market for this report. Median prices represent properties priced above respective city benchmark prices. Prices shown for Canadian cites are shown in Canadian Dollars. State Market Name Median List Price Median Sold Price Inventory New Listings Sold Days on Market Market Status MA Greater Boston $2,496,500 $2,061,250 400 106 122 18 Seller's MA South Shore $750,000 $899,000 15 6 13 20 Seller's MD Anne Arundel County $565,995 $552,670 66 39 59 6 Seller's MD Baltimore City $699,000 $625,000 91 30 37 6 Seller's MD Baltimore County $599,995 $625,000 22 8 11 4 Seller's MD Frederick County - - - - - -MD Howard County $694,990 $620,325 25 19 35 4 Seller's MD Montgomery County $799,990 $740,000 72 50 81 6 Seller's MD Talbot County - - - - - -MD Worcester County $670,000 $690,000 65 32 27 28 Seller's MI Grand Traverse - - - - - -MI Livingston County - - - - - -MI Monroe County - - - - - -MI Oakland County $670,649 $625,000 71 29 27 10 Seller's MI Washtenaw County $639,000 $582,498 47 11 12 75 Seller's MI Wayne County $652,248 $620,500 80 23 24 23 Seller's MN Olmsted County - - - - - -MN Twin Cities - - - - - -MO Kansas City - - - - - -MO St. Louis - - - - - -NC Asheville $814,700 $603,133 46 8 16 21 Seller's NC Charlotte $674,900 $603,800 201 55 77 7 Seller's NC Lake Norman $622,950 $590,000 30 9 12 10 Seller's NC Raleigh-Durham - - - - - -NJ Bergen County $1,195,000 $1,105,500 157 45 42 41 Seller's NJ Hudson County $1,350,000 $1,250,000 110 40 25 9 Seller's NJ Morris County $677,450 $675,000 58 29 33 13 Seller's NJ Ocean County $1,049,000 $987,500 77 23 10 37 Buyer's NM Taos - - - - - -NV Lake Tahoe $1,475,000 $1,237,500 17 5 10 78 Seller's NV Las Vegas - - - - - -NV Reno - - - - - -NY Finger Lakes - - - - - -NY Nassau County $1,485,000 $1,330,000 83 27 21 20 Seller's NY Staten Island $599,950 $562,500 92 39 20 43 Seller's NY Suffolk County $759,990 $633,750 121 43 52 22 Seller's OH Cincinnati - - - - - -OH Cleveland Suburbs - - - - - - -
LUXURY MONTHLY MARKET REVIEW –ATTACHED HOMES
–
Markets with dashes do not have a significant luxury market for this report. Median prices represent properties priced above respective city benchmark prices. Prices shown for Canadian cites are shown in Canadian Dollars. State Market Name Median List Price Median Sold Price Inventory New Listings Sold Days on Market Market Status OH Columbus $717,000 $607,500 110 28 30 9 Seller's ON GTA - Durham $799,900 $850,000 47 37 19 7 Seller's ON GTA - York $800,000 $760,000 314 216 93 15 Seller's ON Hamilton $949,000 $881,500 37 18 6 9 Balanced ON Mississauga $977,000 $952,450 157 106 40 14 Seller's ON Oakville $1,399,900 $1,282,500 25 17 16 29 Seller's ON Toronto $1,200,000 $1,160,000 1050 602 203 14 Balanced ON Waterloo Region $793,471 $767,450 43 35 14 14 Seller's OR Portland $715,000 $650,000 269 97 51 9 Balanced SC Charleston $1,150,000 $1,206,690 79 23 25 3 Seller's SC Hilton Head $1,100,000 $1,099,950 33 14 16 6 Seller's SC The Grand Strand $550,000 $537,000 209 78 64 61 Seller's TN Greater Chattanooga - - - - - -TN Knoxville - - - - - -TN Nashville $729,900 $605,000 239 83 93 3 Seller's TX Austin $825,000 $799,000 395 103 49 38 Buyer's TX Collin County - - - - - -TX Dallas $750,000 $645,000 184 67 40 13 Seller's TX Denton County - - - - - -TX El Paso - - - - - -TX Fort Worth - - - - - -TX Greater Tyler - - - - - -TX Houston $624,998 $585,250 116 46 32 18 Seller's TX Lubbock - - - - - -TX San Angelo - - - - - -TX San Antonio $685,000 $904,950 29 11 2 30 Buyer's TX The Woodlands & Spring - - - - - -UT Park City $2,095,000 $1,975,000 87 22 17 19 Balanced UT Salt Lake City $624,950 $609,150 144 48 56 27 Seller's VA Arlington & Alexandria $1,232,500 $1,010,000 78 49 45 6 Seller's VA Charlottesville $639,900 $538,016 51 18 18 3 Seller's VA Fairfax County $808,433 $706,000 150 77 160 5 Seller's VA McLean & Vienna $1,112,500 $1,335,599 28 11 25 4 Seller's VA Richmond $575,000 $583,780 71 12 28 9 Seller's VA Smith Mountain Lake - - - - - -WA King County $1,189,000 $1,065,000 287 127 86 8 Seller's WA Seattle $1,372,500 $1,299,975 146 50 30 9 Balanced WA Spokane - - - - - - -
CHARLESTON SOUTH CAROLINA
2023 AUGUST
27 8 8 21 25 55 53 37 45 27 28 29 33 26 24 3 0 3 4 3 12 11 13 22 7 17 17 11 8 16 $5,000,000+ $4,500,000 - $4,999,999 $4,000,000 - $4,499,999 $3,500,000 - $3,999,999 $3,000,000 - $3,499,999 $2,500,000 - $2,999,999 $2,000,000 - $2,499,999 $1,750,000 - $1,999,999 $1,500,000 - $1,749,999 $1,400,000 - $1,499,999 $1,300,000 - $1,399,999 $1,200,000 - $1,299,999 $1,100,000 - $1,199,999 $1,000,000 - $1,099,999 $950,000 - $999,999 Inventory Sales Square Feet3 -RangePrice -Median SoldBeds -Median SoldBaths -Median SoldSold -TotalInventory -TotalSales Ratio -Sold/Inventory0 - 1,999 $1,418,750 3 3 10 44 23% 2,000 - 2,999 $1,262,500 4 3 38 126 30% 3,000 - 3,999 $1,399,990 4 4 65 156 42% 4,000 - 4,999 $1,875,000 5 5 22 66 33% 5,000 - 5,999 $2,800,000 5 5 11 27 41% 6,000+ $1,875,000 13 5 1 26 4% CHARLESTON SINGLE - FAMILY HOMES LUXURY INVENTORY VS. SALES | JULY 2023 Luxury Benchmark Price 1: $950,000 Seller's Market 446 Total Inventory: 147 Total Sales: 33% Total Sales Ratio2: 1 The luxury threshold price is set by The Institute for Luxury Home Marketing. 2Sales Ratio defines market speed and market type: Buyer's < 14.5%; Balanced >= 14.5 to < 20.5%; Seller's >= 20.5% plus. If >100% MLS® data reported previous month’s sales exceeded current inventory.
CHARLESTON SINGLE - FAMILY HOMES
TOTAL INVENTORY
397 446 Jul. 2022 Jul. 2023
VARIANCE: 12 %
VARIANCE: - 8 % $518 $475
MEDIAN DATA REVIEW | JULY
TOTAL SOLDS
VARIANCE: - 1 % 149 147
SALE TO LIST PRICE RATIO
100.00% 98.48%
VARIANCE: - 2 %
SALES PRICE
VARIANCE: 4 % $1.43m $1.49m
DAYS ON MARKET
VARIANCE: 140 % 5 12
CHARLESTON MARKET SUMMARY | JULY 2023
• The Charleston single-family luxury market is a Seller's Market with a 33% Sales Ratio.
• Homes sold for a median of 98.48% of list price in July 2023.
• The most active price band is $950,000-$999,999, where the sales ratio is 67%
• The median luxury sales price for single-family homes is $1,487,000.
• The median days on market for July 2023 was 12 days, up from 5 in July 2022.
3Square foot table does not account for listings and solds where square foot data is not disclosed. 4Data reported includes Active and Sold properties and does not include Pending properties.
Solds Median Sales Price Inventory 397 395 375 374 379 361 373 354 347 377 419 453 446 149 119 118 119 96 100 84 83 149 136 161 174 147 $1,425,000 $1,595,000 $1,475,625 $1,350,000 $1,472,739 $1,416,875 $1,400,000 $1,425,000 $1,435,000 $1,350,000 $1,475,000 $1,441,250 $1,487,000 Jul-22 Aug-22 Sep-22 Oct-22 Nov-22 Dec-22 Jan-23 Feb-23 Mar-23 Apr-23 May-23 Jun-23 Jul-23
13 - MONTH LUXURY MARKET TREND 4
Jul. 2022 Jul. 2023 Jul. 2022 Jul. 2023 Jul. 2022 Jul. 2023 Jul. 2022 Jul. 2023 Jul. 2022 Jul. 2023
SALE PRICE PER SQFT.
CHARLESTON ATTACHED HOMES
8 6 13 3 2 4 5 3 5 6 4 5 4 2 9 1 0 5 0 5 2 1 1 0 1 0 3 2 3 1 $2,500,000+ $2,000,000 - $2,499,999 $1,500,000 - $1,999,999 $1,400,000 - $1,499,999 $1,300,000 - $1,399,999 $1,200,000 - $1,299,999 $1,100,000 - $1,199,999 $1,000,000 - $1,099,999 $950,000 - $999,999 $900,000 - $949,999 $850,000 - $899,999 $800,000 - $849,999 $775,000 - $799,999 $750,000 - $774,999 $725,000 - $749,999 Inventory Sales
Square Feet3 -RangePrice -Median SoldBeds -Median SoldBaths -Median SoldSold -TotalInventory -TotalSales Ratio -Sold/Inventory0 - 999 $812,500 2 2 1 8 13% 1,000 - 1,499 $795,000 3 2 5 21 24% 1,500 - 1,999 $1,250,000 3 3 9 22 41% 2,000 - 2,499 $775,000 4 4 5 13 38% 2,500 - 2,999 $1,570,000 3 3 2 6 33% 3,000+ $1,525,000 4 4 3 9 33%
INVENTORY
Luxury Benchmark Price 1: $725,000 Seller's Market 79 Total Inventory: 25 Total Sales: 32% Total Sales Ratio2: 1 The luxury threshold price is set by The Institute for Luxury Home Marketing. 2Sales Ratio defines market speed and market type: Buyer's < 14.5%; Balanced >= 14.5 to < 20.5%; Seller's >= 20.5% plus. If >100% MLS® data reported previous month’s sales exceeded current inventory.
LUXURY
VS. SALES | JULY 2023
CHARLESTON ATTACHED HOMES
13 - MONTH LUXURY MARKET TREND 4
MEDIAN DATA REVIEW | JULY
$1.21m
SALE PRICE PER SQFT.
VARIANCE: - 8 % $689 $631
SALE TO LIST PRICE RATIO
100.00% 98.71%
VARIANCE: - 1 %
VARIANCE: - 25 % 4 3
CHARLESTON MARKET SUMMARY | JULY 2023
• The Charleston attached luxury market is a Seller's Market with a 32% Sales Ratio.
• Homes sold for a median of 98.71% of list price in July 2023.
• The most active price band is $1,300,000-$1,399,999, where the sales ratio is 250%
• The median luxury sales price for attached homes is $1,206,690.
• The median days on market for July 2023 was 3 days, down from 4 in July 2022.
3Square foot table does not account for listings and solds where square foot data is not disclosed. 4Data reported includes Active and Sold properties and does not include Pending properties.
100 102 81 78 79 79 75 82 84 90 91 79 79 27 24 36 22 22 18 15 12 26 26 49 39 25 $1,150,000 $927,000 $899,500 $1,208,858 $882,552 $952,500 $950,000 $1,002,750 $1,025,000 $885,500 $1,025,000 $900,000 $1,206,690 Jul-22 Aug-22 Sep-22 Oct-22 Nov-22 Dec-22 Jan-23 Feb-23 Mar-23 Apr-23 May-23 Jun-23 Jul-23 Solds Sale Price Inventory
VARIANCE: - 21 % 100 79 VARIANCE: - 7 % 27 25 VARIANCE: 5 % $1.15m
SALES PRICE
DAYS ON MARKET
Jul. 2022 Jul. 2023 Jul. 2022 Jul. 2023 Jul. 2022 Jul. 2023 Jul. 2022 Jul. 2023 Jul. 2022 Jul. 2023 Jul. 2022 Jul. 2023
TOTAL INVENTORY TOTAL SOLDS


PARKER MOORE & MIKE MILLIKIN 843.801.4888 | Parker@pointbreakpropertiesre.com 843.270.3481 | Mike@pointbreakpropertiesre.com Thank you for taking time to view this report. For more information about this report and the services we can offer you and your luxury property, please give us a call at 843.801.4888 or 843.270.3481. - Parker Moore and Mike Millikin
