N O T E S T O T H E F I N A N C I A L S T A T E M E N T S F O R T H E Y E A R E N D E D 30 J U N E 2011 NOTE 10:
RESULTS OF ACTIVITIES (continued)
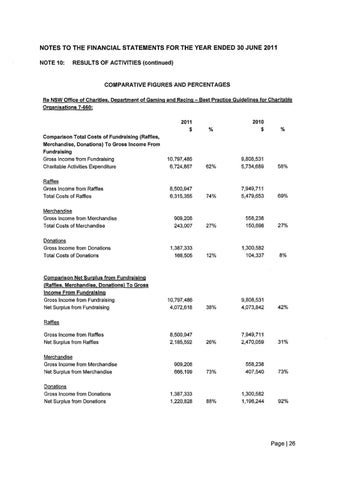
COMPARATIVE FIGURES AND PERCENTAGES Re NSW Office of Charities. Department of Gaming and Racing - Best Practice Guidelines for Charitable Organisations 7-660:
2011 $ Comparison Total Costs of Fundraising (Raffles, Merchandise, Donations) To Gross Income From Fundraising Gross Income from Fundraising Charitable Activities Expenditure
0,797,486 6,724,867
Raffles Gross Income from Raffles Total Costs of Raffles
8,500,947 6,315,355
Merchandise Gross Income from Merchandise Total Costs of Merchandise Donations Gross Income from Donations Total Costs of Donations
Comparison Net Surplus from Fundraising (Raffles. Merchandise. Donations) To Gross Income From Fundraising Gross Income from Fundraising Net Surplus from Fundraising
2010 %
$
62%
9,808,531 5,734,689
58%
74%
7,949,711 5,479,653
69%
27%
558,238 150,698
27%
12%
1,300,582 104,337
8%
10,797,486 4,072,618
38%
9,808,531 4,073,842
42%
8,500,947 2,185,592
26%
7,949,711 2,470,059
31%
909,206 666,199
73%
558,238 407,540
73%
1,387,333 1,220,828
88%
1,300,582 1,196,244
92%
909,206 243,007
1,387,333 166,505
Raffles Gross Income from Raffles Net Surplus from Raffles Merchandise Gross Income from Merchandise Net Surplus from Merchandise Donations Gross Income from Donations Net Surplus from Donations
Page|26