BUSINESS TOP 500 AFRICAN COMPANIES
201
219
202 231 203 208 204 154 205 209
Diff.
Rank ’13
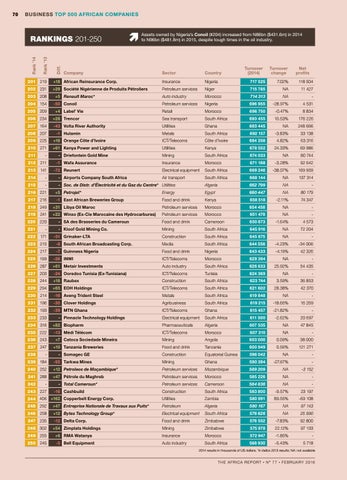
RANKINGS 201-250 Rank ’14
70
Assets owned by Nigeria’s Conoil (#204) increased from N86bn ($431.6m) in 2014 to N96bn ($481.8m) in 2015, despite tough times in the oil industry.
Company
Sector
Country
Turnover (2014)
Turnover change
Net profits
+18 African Reinsurance Corp.
Insurance
Nigeria
717 525
7.02%
118 504
+29 Société Nigérienne de Produits Pétroliers
Petroleum services
Niger
715 785
NA
11 427
Auto industry
Morocco
714 313
NA
-
Petroleum services
Nigeria
696 955
-28.97%
4 531
Retail
Morocco
696 750
-0.47%
8 834
Sea transport
South Africa
693 455
10.53%
176 226
+5 Renault Maroc* -50 Conoil +4 Label’ Vie
206 234
+28 Trencor
207 164
-43 Volta River Authority
208 207
!
-1 Hulamin
Utilities
Ghana
693 445
NA
248 666
Metals
South Africa
692 157
-3.83%
33 138
209 225
+16 Orange Côte d’Ivoire
ICT/Telecoms
Côte d’Ivoire
684 258
4.82%
63 316
210 271
+61 Kenya Power and Lighting
Utilities
Kenya
678 552
24.33%
69 986
- Driefontein Gold Mine
Mining
South Africa
674 033
NA
80 744
Insurance
Morocco
671 188
-3.28%
92 642
Electrical equipment
South Africa
669 246
-38.07%
169 959
Air transport
South Africa
668 144
NA
137 314
Algeria
662 799
NA
-
Egypt
660 447
NA
80 179 74 347
211
-
212
211
213
141
214
-
- Airports Company South Africa
215
-
- Soc. de Distr. d’Électricité et du Gaz du Centre* Utilities
216 221 217
216
218 249 219
241
220 220 221
-
222
171
223
215
224
217
-1 Wafa Assurance -72 Reunert
+5 Petrojet* -1 East African Breweries Group
Energy Food and drink
Kenya
658 518
-2.11%
+31 Libya Oil Maroc
Petroleum services
Morocco
654 458
NA
-
+22 Winxo (Ex-Cie Marocaine des Hydrocarbures)
Petroleum services
Morocco
651 478
NA
-
- SA des Brasseries du Cameroun
Food and drink
Cameroon
650 673
-1.64%
4 573
- Kloof Gold Mining Co.
Mining
South Africa
645 916
NA
72 204
-51 Grinaker-LTA
Construction
South Africa
645 675
NA
-
-8 South African Broadcasting Corp.
Media
South Africa
644 556
-4.23%
-34 006
-7 Guinness Nigeria
42 326
Food and drink
Nigeria
643 433
-4.19%
225 199
-26 INWI
ICT/Telecoms
Morocco
629 394
NA
-
226 287
+61 Metair Investments
Auto industry
South Africa
626 633
25.92%
54 435
227 203
-24 Ooredoo Tunisia (Ex-Tunisiana)
ICT/Telecoms
Tunisia
624 369
NA
-
228 244
+16 Raubex
Construction
South Africa
623 744
3.59%
36 853
229 294
+65 EOH Holdings
ICT/Telecoms
South Africa
621 602
28.38%
42 370
-16 Aveng Trident Steel
Metals
South Africa
619 848
NA
-
231 196
-35 Clover Holdings
Agribusiness
South Africa
619 215
-18.66%
16 269
232 193
-39 MTN Ghana
230
214
233 233 234
316
235 222 236 243 237
247
238
-
239 184
ICT/Telecoms
Ghana
615 457
-21.82%
-
Electrical equipment
South Africa
611 500
-2.62%
20 697
+82 Biopharm
Pharmaceuticals
Algeria
607 535
NA
47 845
-13 Médi Télécom
ICT/Telecoms
Morocco
607 310
NA
-
Mining
Angola
603 000
0.09%
38 000 121 271
- Pinnacle Technology Holdings
+7 Catoca Sociedade Mineira +10 Tanzania Breweries - Somagec GE -55 Tarkwa Mines
Food and drink
Tanzania
600 949
0.56%
Construction
Equatorial Guinea
596 042
NA
-
Mining
Ghana
590 394
-27.67%
-3 152
240 252
+12 Petroleos de Moçambique*
Petroleum services
Mozambique
589 209
NA
241 288
+47 Pétrole du Maghreb
Petroleum services
Morocco
585 226
NA
-
- Total Cameroun*
Petroleum services
Cameroon
584 836
NA
-
242
-
243 227
-16 Cashbuild
244 406 +162 Copperbelt Energy Corp.
Construction
South Africa
583 800
-9.57%
23 197
Utilities
Zambia
580 991
89.55%
-69 108
245 292
+47 Entreprise Nationale de Travaux aux Puits*
Petroleum
Algeria
580 167
NA
97 143
246 258
+12 Bytes Technology Group*
Electrical equipment
South Africa
576 626
NA
25 990
-12 Delta Corp.
Food and drink
Zimbabwe
576 552
-7.83%
92 800
Mining
Zimbabwe
575 978
22.12%
97 133
247 235 248 302
+54 Zimplats Holdings
249 255
+6 RMA Watanya
Insurance
Morocco
572 947
-1.85%
-
250 245
-5 Bell Equipment
Auto industry
South Africa
568 930
-5.43%
5 718
2014 results in thousands of US dollars; *in italics 2013 results; NA: not available
THE AFRICA REPORT
•
N° 77
•
F E B R UA R Y 2 016