Seacoast Overview
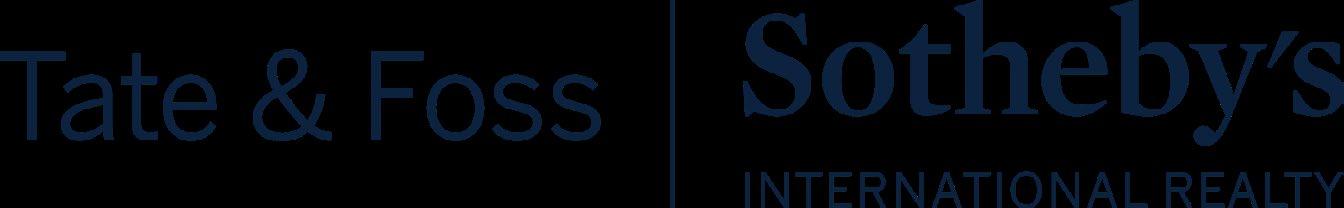
Inflation, inventory, interest rates. All three played important roles as 2022 unfolded in the 13 Sample Seacoast Towns—and beyond. The year began with interest rates near 3% for a 30-year fixed mortgage, just a slight uptick from the low point of 2.65% in January 2021. Bargain basement financing fueled high demand and multiple offer scenarios were commonplace across all price points. But by September 2022, rates topped 6%, and single-family sales dropped 13.9% through the end of the month. Rates flirted around the 7% mark at year’s end.
Meanwhile, inventory set records for monthly lows in each of the year’s first four months. March and April, in fact, recorded their fewest sales ever. Yet despite rising interest rates, median sale prices continued to climb. As affordability declined, days on market lengthened. Inevitably, June saw an-ever-so slight increase in inventory. A transition to a more balanced market was underway. Old-fashioned negotiation became more commonplace.
Against this background—and a declining stock market—multi-million-dollar sales soared to record levels. Despite all odds, monthly volume records for million-dollar-plus transactions were posted in every month except July and September including an all-time monthly mark of 26 total million-dollar sales in June. Topping the new volume records was a $25 million dollar December sale of an oceanfront property in a prime Straws Point, Rye location. The sale price is believed to be the largest for a single-family home ever in New Hampshire.
Tate & Foss Sotheby’s International Realty found itself, as always, a significant player in this amazing market segment. We posted the top sales in New Castle, Portsmouth, and Rye Beach, including the year’s biggest non-waterfront sale in coastal New Hampshire at $6.4 million dollars. The company also had the second highest sale in Seabrook, Exeter, Dover, and New Durham. Million-dollar sales were so prevalent that only Lee, Northwood, and Somersworth did not record one. Fifteen of 30 towns had sales of more than $2 million dollars with Rye Beach, as usual, having the highest median sale price—$2.65 million.
Across the river in Maine, all six coastal communities from Kittery to Kennebunkport had sales of more than $2 million dollars with the largest coming in Kennebunkport at $6.9 million. By contrast, the Berwicks remained one of the area’s most affordable options with a median sale price of $438,000. Despite overall market volatility, Rochester, Dover, Hampton, and Portsmouth were the most active markets with well over 300 transactions in each. Greenland proved another hot spot with the area’s slimmest average days on market: 12.
In sum, sales were off 8% for the year in the 13 Sample Seacoast Towns while the median sale price rose 19% to $750,000 and the average sale price was even higher at $943,628, up 11%.
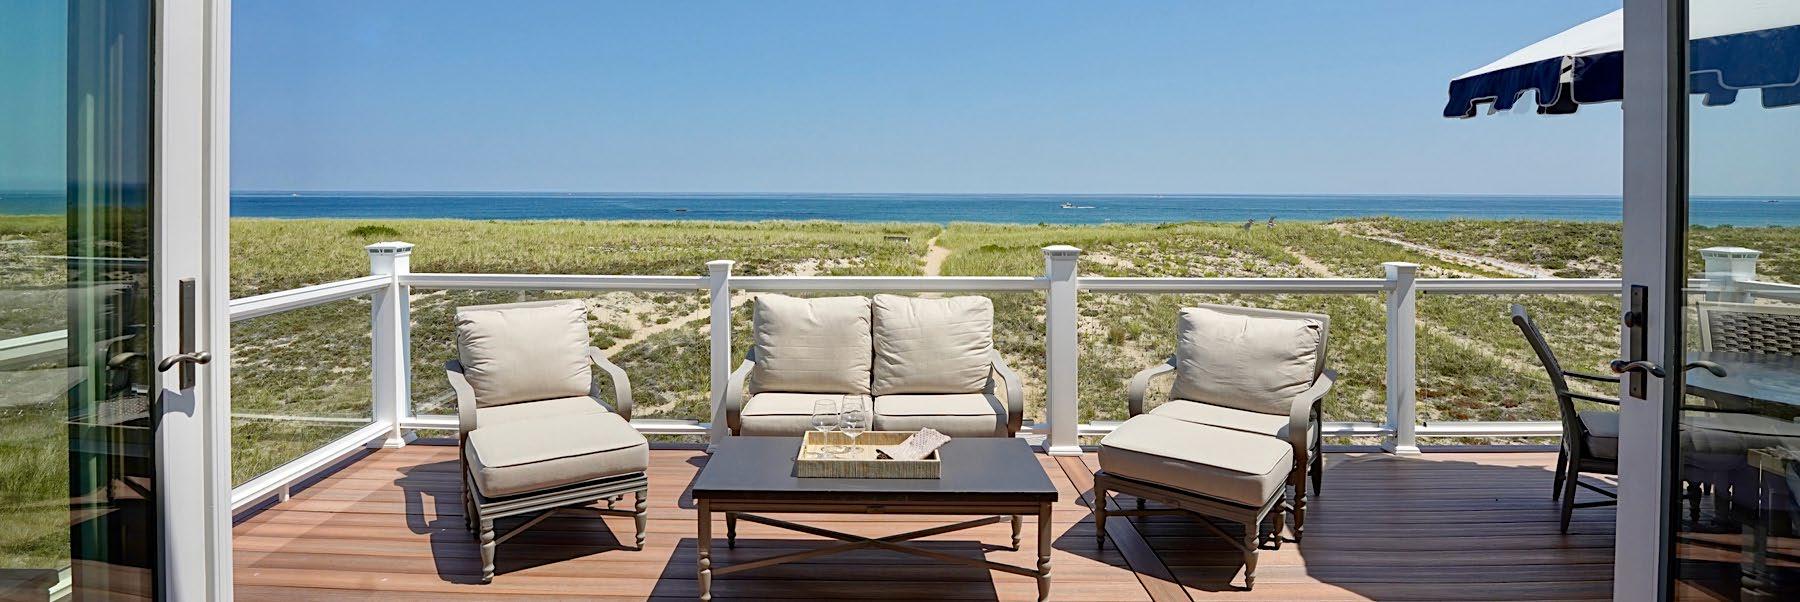
Amidst all the varied and complex market forces at play at year’s end, there was some good news. December month-over-month sales remained steady from a year ago, for the first time since June. It seems 2023 has potential to be more challenging than what we have recently experienced. But, as the saying goes, under all is the land. And there’s no denying that the Seacoast is and always will be a very special part of the world to call home.
SEACOAST MARKET WATCH • 4 BROWSE ALL MLS LISTINGS AND LEARN MORE ABOUT THE MARKET AT LIVESEACOAST.COM
AVERAGE SALES PRICE $991,286 NUMBER OF HOMES SOLD 500 DAYS ON MARKET 26 GREENLAND • NEW CASTLE NEWINGTON • PORTSMOUTH RYE • RYE BEACH at a glance 2022 Greater Portsmouth Area
NUMBER OF SALES
DAYS ON MARKET
AVERAGE PRICE MEDIAN PRICE HIGHEST PRICE
Greenland 2022 2021 Change 57 12 $838,150 $720,000 $3,250,000

63 28 $625,094 $539,000 $1,550,000
Tax Rate: $18.09
-10% -58% 34% 34% 110%
NUMBER OF SALES DAYS ON MARKET
AVERAGE PRICE MEDIAN PRICE HIGHEST PRICE
New Castle 2022 2021 Change 11 104 $2,225,455 $1,795,000 $5,080,000
15 17 $2,005,557 $1,350,000 $5,676,350
Tax Rate: $4.50
-27% 505% 11% 33% -11%
Change
NUMBER OF SALES DAYS ON MARKET
AVERAGE PRICE MEDIAN PRICE HIGHEST PRICE
Newington 2022 2021 4 18 $912,500 $950,000 $1,300,000
9 15 $992,833 $902,000 $2,250,000
Tax Rate: $9.88
-56% 21% -8% 5% -42%
NUMBER OF SALES DAYS ON MARKET AVERAGE PRICE MEDIAN PRICE HIGHEST PRICE
Portsmouth 2022 2021 333 27 $824,740 $695,000 $4,950,000
382 31 $749,105 $596,000 $4,650,000
Tax Rate: $15.20
Change
-13% -12% 10% 17% 6%
Change
NUMBER OF SALES DAYS ON MARKET
AVERAGE PRICE MEDIAN PRICE HIGHEST PRICE
Rye 2022 2021 87 24 $1,371,207 $960,000 $25,000,000
61 40 $1,223,049 $1,000,000 $4,500,000
Tax Rate: $7.39
43% -39% 12% -4% 456%
T&F Significant Sale: Greenland NH I $1,550,000
NUMBER OF SALES DAYS ON MARKET AVERAGE PRICE MEDIAN PRICE HIGHEST PRICE
Rye Beach 2022 2021 8 14 $3,225,625 $2,650,000 $6,400,000
9 38 $2,090,000 $2,350,000 $3,848,000
Tax Rate: $7.27
Change
-11% -62% 54% 13% 66%
Highest Sale in Rye Beach
66%
SEACOAST MARKET WATCH • 6 BROWSE ALL MLS LISTINGS AND LEARN MORE ABOUT THE MARKET AT LIVESEACOAST.COM 58%
Days on Market in Greenland
AVERAGE SALES PRICE $723,714 NUMBER OF HOMES SOLD 515 DAYS ON MARKET 33 HAMPTON • HAMPTON FALLS NORTH HAMPTON • SEABROOK SOUTH HAMPTON at a glance 2022 Greater Hampton Area
NUMBER OF SALES
DAYS ON MARKET
AVERAGE PRICE MEDIAN PRICE HIGHEST PRICE
Hampton 2022 2021 Change 342 37 $628,771 $570,000 $4,900,000
365 27 $521,831 $450,000 $5,500,000
Tax Rate: $15.84
-6% 36% 20% 27% -11%
NUMBER OF SALES DAYS ON MARKET
AVERAGE PRICE MEDIAN PRICE HIGHEST PRICE
Hampton Falls 2022 2021 Change 25 23 $999,394 $985,000 $2,450,000
35 52 $861,030 $843,000 $2,250,000
Tax Rate: $20.99
-29% -55% 16% 17% 9%
Change
NUMBER OF SALES DAYS ON MARKET
AVERAGE PRICE MEDIAN PRICE HIGHEST PRICE
North Hampton 2022 2021 68 25 $1,070,793 $902,000 $3,000,000
62 37 $959,953 $633,750 $3,500,000
Tax Rate: $19.39
10% -32% 12% 42% -14%
NUMBER OF SALES DAYS ON MARKET
AVERAGE PRICE MEDIAN PRICE HIGHEST PRICE
Seabrook 2022 2021 71 29 $716,030 $490,000 $4,600,000

86 27 $547,222 $496,500 $2,300,000
Tax Rate: $13.25
Change
-17% 4% 31% -1% 100%
Change
NUMBER OF SALES DAYS ON MARKET
AVERAGE PRICE MEDIAN PRICE HIGHEST PRICE
South Hampton 2022 2021 9 14 $1,004,000 $960,000 $2,000,000
10 33 $670,350 $630,000 $1,125,000
Tax Rate: $19.86
-10% -57% 50% 52% 78%
Highest Price in South Hampton
SEACOAST MARKET WATCH • 8 BROWSE ALL MLS LISTINGS AND LEARN MORE ABOUT THE MARKET AT LIVESEACOAST.COM
78%
T&F Significant Sale: North
NH I $2,350,000 I June
Hampton
2022
AVERAGE SALES PRICE $589,302 NUMBER OF HOMES SOLD 510 DAYS ON MARKET 23 BRENTWOOD • EAST KINGSTON EXETER • KENSINGTON NEWFIELDS • STRATHAM at a glance 2022 Greater Exeter Area
NUMBER OF SALES DAYS ON MARKET
AVERAGE PRICE MEDIAN PRICE HIGHEST PRICE
Brentwood 2022 2021 Change 91 28 $597,090 $585,000 $1,250,000
90 22 $553,408 $549,900 $889,000
Tax Rate: $22.15
1% 28% 8% 6% 41%
NUMBER OF SALES DAYS ON MARKET
AVERAGE PRICE MEDIAN PRICE HIGHEST PRICE
East Kingston 2022 2021 Change 17 24 $840,453 $680,000 $3,400,000
43 16 $521,742 $476,000 $1,125,000
Tax Rate: $22.80
-60% 47% 61% 43% 202%
Change
NUMBER OF SALES DAYS ON MARKET
AVERAGE PRICE MEDIAN PRICE HIGHEST PRICE
Exeter 2022 2021 237 20 $515,271 $499,900 $1,200,000
314 32 $483,184 $450,500 $1,725,000
Tax Rate: $24.75
-25% -35% 7% 11% -30%
NUMBER OF SALES DAYS ON MARKET AVERAGE PRICE MEDIAN PRICE HIGHEST PRICE
Kensington 2022 2021 20 54 $693,300 $633,000 $1,360,000
18 44 $696,989 $617,500 $1,257,500
Tax Rate: $19.86
Change
11% 21% -1% 3% 8%
Change
NUMBER OF SALES DAYS ON MARKET
AVERAGE PRICE MEDIAN PRICE HIGHEST PRICE
Newfields 2022 2021 19 16 $675,589 $649,900 $1,276,500
31 22 $687,048 $690,000 $1,200,000
Tax Rate: $20.96
-39% -25% -2% -6% 6%
NUMBER OF SALES DAYS ON MARKET AVERAGE PRICE MEDIAN PRICE HIGHEST PRICE
Stratham 2022 2021 126 21 $659,520 $613,750 $1,845,000

176 23 $580,515 $575,750 $1,375,000
Tax Rate: $18.71
Change
-28% -10% 14% 7% 34%

SEACOAST MARKET WATCH • 10 BROWSE ALL MLS LISTINGS AND LEARN MORE ABOUT THE MARKET AT LIVESEACOAST.COM 39%
35% Days on
Number of Sales in Newfields
Market in Exeter

AVERAGE SALES PRICE $423,177 NUMBER OF HOMES SOLD 773 DAYS ON MARKET 19 DOVER • ROCHESTER ROLLINSFORD • SOMERSWORTH at a glance 2022 Greater Dover Area
NUMBER OF SALES
DAYS ON MARKET
AVERAGE PRICE MEDIAN PRICE
HIGHEST PRICE
Dover 2022 2021 Change 369 20 $504,752 $415,000 $9,750,000
486 18 $440,608 $380,000 $3,750,000
Tax Rate: $19.84
-24% 15% 15% 9% 160%
NUMBER OF SALES DAYS ON MARKET
AVERAGE PRICE MEDIAN PRICE
HIGHEST PRICE
Rochester 2022 2021 Change 382 17 $340,505 $325,000 $2,100,000
519 22 $296,984 $290,000 $825,000
Tax Rate: $25.28
-26% -22% 15% 12% 155%
Change
NUMBER OF SALES DAYS ON MARKET
AVERAGE PRICE MEDIAN PRICE
HIGHEST PRICE
Rollinsford 2022 2021 22 26 $490,414 $422,500 $1,300,000
50 15 $357,366 $317,500 $990,000
Tax Rate: $14.87
-56% 73% 37% 39% 31%
NUMBER OF SALES DAYS ON MARKET
AVERAGE PRICE MEDIAN PRICE HIGHEST PRICE
Somersworth 2022 2021 158 22 $376,162 $365,000 $910,000

145 28 $327,289 $315,000 $535,000
Tax Rate: $28.09
Change
9% -22% 15% 16% 70%

SEACOAST MARKET WATCH • 12 BROWSE ALL MLS LISTINGS AND LEARN MORE ABOUT THE MARKET AT LIVESEACOAST.COM 160%
56%
T&F Significant Sale: 1 Cullen Bay Road, Dover NH I $2,195,000 I April 2022
Highest Price in Dover
Number of Sales in Rollinsford

AVERAGE SALES PRICE $550,469 NUMBER OF HOMES SOLD 234 DAYS ON MARKET 18 DURHAM • LEE MADBURY • NEWMARKET at a glance 2022 Greater Durham Area
NUMBER OF SALES
DAYS ON MARKET
AVERAGE PRICE MEDIAN PRICE HIGHEST PRICE
Durham 2022 2021 Change 64 21 $627,405 $575,500 $2,250,000

83 28 $618,411 $530,000 $2,300,000
Tax Rate: $29.04
-23% -25% 1% 9% -2%
NUMBER OF SALES DAYS ON MARKET AVERAGE PRICE MEDIAN PRICE HIGHEST PRICE
Lee 2022 2021 Change 41 17 $512,009 $510,000 $809,000
39 23 $504,179 $465,000 $1,400,000
Tax Rate: $21.72
5% -26% 2% 10% -42%
Change
NUMBER OF SALES DAYS ON MARKET
AVERAGE PRICE MEDIAN PRICE HIGHEST PRICE
Madbury 2022 2021 19 12 $630,357 $622,000 $1,025,000
22 17 $525,195 $467,500 $995,000
Tax Rate: $25.27
-14% -32% 20% 33% 3%
NUMBER OF SALES DAYS ON MARKET AVERAGE PRICE MEDIAN PRICE HIGHEST PRICE
Newmarket 2022 2021 110 17 $506,242 $498,500 $1,264,500
160 15 $408,450 $381,450 $1,295,000
Tax Rate: $26.99
Change
-31% 15% 24% 31% -2%
SEACOAST MARKET WATCH • 14 BROWSE ALL MLS LISTINGS AND LEARN MORE ABOUT THE MARKET AT LIVESEACOAST.COM 33%
31%
of Sales in Newmarket
Median Price in Madbury
Number

AVERAGE SALES PRICE $481,482 NUMBER OF HOMES SOLD 297 DAYS ON MARKET 17 BARRINGTON • NORTHWOOD NOTTINGHAM • STRAFFORD at a glance 2022 Greater Seacoast Lakes Area
NUMBER OF SALES
DAYS ON MARKET
AVERAGE PRICE MEDIAN PRICE HIGHEST PRICE
Barrington 2022 2021 Change 106 15 $464,783 $432,500 $1,300,000
142 32 $397,784 $400,500 $960,000
Tax Rate: $19.85
-25% -55% 17% 8% 35%
NUMBER OF SALES DAYS ON MARKET AVERAGE PRICE MEDIAN PRICE HIGHEST PRICE
Northwood 2022 2021 Change 57 14 $391,227 $373.000 $737.500
91 23 $380,169 $370,000 $830,000
Tax Rate: $12.58
-37% -38% 3% 1% -11%
Change
NUMBER OF SALES DAYS ON MARKET
AVERAGE PRICE MEDIAN PRICE HIGHEST PRICE
Nottingham 2022 2021 76 28 $542,546 $540,075 $1,100,000
77 29 $458,368 $459,500 $795,000
Tax Rate: $19.11
-1% -5% 18% 18% 38%
NUMBER OF SALES DAYS ON MARKET AVERAGE PRICE MEDIAN PRICE HIGHEST PRICE

Strafford 2022 2021 58 11 $520,684 $451,450 $2,707,000

38 18 $384,626 $373,000 $742,500
Tax Rate: $17.13
Change
53% -41% 35% 21% 265%
SEACOAST MARKET WATCH • 16 BROWSE ALL MLS LISTINGS AND LEARN MORE ABOUT THE MARKET AT LIVESEACOAST.COM 38%
53%
Highest Price in Nottingham
Number of Sales in Strafford

AVERAGE SALES PRICE $457,453 NUMBER OF HOMES SOLD 303 DAYS ON MARKET 17 BERWICK • ELIOT NORTH BERWICK • SOUTH BERWICK at a glance 2022 Eliot & The Berwicks
NUMBER OF SALES DAYS ON MARKET AVERAGE PRICE MEDIAN PRICE HIGHEST PRICE
Berwick 2022 2021 Change 91 20 $416,450 $410,000 $980,000
114 17 $352,892 $327,250 $780,000
Tax Rate: $18.22
-20% 13% 18% 25% 26%
NUMBER OF SALES DAYS ON MARKET AVERAGE PRICE MEDIAN PRICE HIGHEST PRICE
Eliot 2022 2021 Change 72 15 $557,989 $507,295 $1,425,000
110 13 $498,702 $447,250 $1,430,000
Tax Rate: $13.50
-35% 9% 12% 13% 0%
Change
NUMBER OF SALES DAYS ON MARKET
AVERAGE PRICE MEDIAN PRICE HIGHEST PRICE
North Berwick 2022 2021 57 17 $406,924 $400,000 $960,000
61 15 $383,986 $350,000 $1,110,000
Tax Rate: $11.15
-7% 19% 6% 14% -14%
Days on Market in South Berwick
South Berwick 2022 2021 83 16 $449,897 $431,000 $855,000

Change

NUMBER OF SALES DAYS ON MARKET AVERAGE PRICE MEDIAN PRICE HIGHEST PRICE
91 22 $390.937 $380,000 $888,000
Tax Rate: $15.54
-9% -29% 15% 13% -4%
Number of Sales in Eliot
SEACOAST MARKET WATCH • 18 BROWSE ALL MLS LISTINGS AND LEARN MORE ABOUT THE MARKET AT LIVESEACOAST.COM
35%
29%

AVERAGE SALES PRICE $692,979 NUMBER OF HOMES SOLD 1,153 DAYS ON MARKET 33 KENNEBUNK • KENNEBUNKPORT KITTERY • OGUNQUIT • WELLS YORK at a glance 2022 Southern York County Coast
NUMBER OF SALES
DAYS ON MARKET
AVERAGE PRICE MEDIAN PRICE HIGHEST PRICE
Kennebunk 2022 2021 Change 267 31 $669,804 $570,000 $6,250,000
303 32 $596,863 $475,000 $3,662,500
Tax Rate: $14.60
-12% -2% 12% 20% 71%
NUMBER OF SALES DAYS ON MARKET AVERAGE PRICE MEDIAN PRICE HIGHEST PRICE
Kennebunkport 2022 2021 Change 85 40 $1,254,798 $850,000 $6,900,000
109 58 $1,120,275 $851,000 $7,500,000
Tax Rate: $6.00
-22% -31% 12% 0% -8%
Change
NUMBER OF SALES DAYS ON MARKET
AVERAGE PRICE MEDIAN PRICE HIGHEST PRICE
Kittery 2022 2021 120 20 $665,783 $615,000 $3,000,000
173 29 $637,595 $500,000 $4,300,000
Tax Rate: $13.48
-31% -30% 4% 23% -30%
NUMBER OF SALES DAYS ON MARKET AVERAGE PRICE MEDIAN PRICE HIGHEST PRICE
Ogunquit 2022 2021 51 42 $880,926 $800,000 $2,250,000
86 33 $823,948 $632,000 $3,000,000
Tax Rate: $6.32
Change
-41% 29% 7% 27% -25%
Change
NUMBER OF SALES DAYS ON MARKET
AVERAGE PRICE MEDIAN PRICE HIGHEST PRICE
Wells 2022 2021 382 39 $495,068 $450,000 $3,300,000
488 38 $490,428 $420,000 $4,300,000
Tax Rate: $10.46
-22% 3% 1% 7% -23%
NUMBER OF SALES DAYS ON MARKET AVERAGE PRICE MEDIAN PRICE HIGHEST PRICE
York 2022 2021 248 28 $804,727 $640,000 $5,200,000
355 25 $738,215 $575,000 $5,749,140
Tax Rate: $8.55
Change
-30% 11% 9% 11% -10%
Highest Price in Kennebunk
Number of Sales in Ogunquit
SEACOAST MARKET WATCH • 20 BROWSE ALL MLS LISTINGS AND LEARN MORE ABOUT THE MARKET AT LIVESEACOAST.COM 71%
41%
AVERAGE SALES PRICE $3,340,830 NUMBER OF HOMES SOLD 86 DAYS ON MARKET 37 LUXURY 2022 MEDIAN SALES PRICE $2,620,000 HIGHEST SALES PRICE $25,000,000


T&F Significant Sale: 64 Pleasant Point Drive, Portsmouth NH I $4,950,000 I November 2022 SEACOAST MARKET WATCH • 22 BROWSE ALL MLS LISTINGS AND LEARN MORE ABOUT THE MARKET AT LIVESEACOAST.COM T&F Significant Sale: 805 Central Road, Rye Beach NH I $6,400,000 I May 2022 T&F Significant Sale: 133 Little Harbor Road, New Castle NH I $5,080,000 I November 2022
AVERAGE SALES PRICE $1,489,477 NUMBER OF HOMES SOLD 163 DAYS ON MARKET 25 WATERFRONT 2022 MEDIAN SALES PRICE $820,250 HIGHEST SALES PRICE $25,000,000
SEACOAST MARKET WATCH • 24 BROWSE ALL MLS LISTINGS AND LEARN MORE ABOUT THE MARKET AT LIVESEACOAST.COM T&F Significant Sale: 126 Ocean Boulevard, Seabrook NH I $4,500,000 I November 2022 T&F Significant Sale: 88 Ocean Boulevard, North Hampton NH I $2,200,000 I June 2022 NUMBER OF SALES DAYS ON MARKET AVERAGE PRICE MEDIAN PRICE HIGHEST PRICE Oceanfront 53 21 $2,385,680 $1,500,000 $25,000,000 River-Bay-Lakefront 110 26 $1,057,669 $732,500 $9,750,000 SPOTLIGHT ON 2022 WATERFRONT SALES { { vs.

AVERAGE SALES PRICE $630,849 NUMBER OF HOMES SOLD 396 DAYS ON MARKET 22 HISTORIC 2022 MEDIAN SALES PRICE $479,450 HIGHEST SALES PRICE $3,300,000 & ANTIQUE

T&F Significant Sale: 640 Middle Street, Portsmouth NH I $2,675,000 I September 2022 T&F Significant Sale: 68 Perkins Road, Rye NH I $1,300,000 I December 2022 SEACOAST MARKET WATCH • 26 BROWSE ALL MLS LISTINGS AND LEARN MORE ABOUT THE MARKET AT LIVESEACOAST.COM T&F Significant Sale: 183 Portsmouth Avenue, New Castle NH I $3,000,000 I June 2022


Bryttnie Gillis Sales Associate c 603.294.3004 OUR TEAM Robyne Harrison Sales Associate c 603.918.6093 Tony Jalbert Principal Broker c 603.498.6241 Lynne Joyce Associate Broker c 603.591.8489 Mary Beth Hixon Sales Associate c 603.548.5390 Manuela Kutzer Sales Associate c 603.828.2195 Jenifer Parker Sales Associate c 603.498.0555 Caren Logan Sales Associate c 603.370.0544 Patricia Weathersby Sales Associate c 603.957.1430 Jaynee Whitney Sales Associate c 603.380.5140 Kasey Gossom Marketing Associate o 603.964.8028


Sean Fellows Sales Associate c 603.616.6885 Amy Pender Sales Associate c 603.502.8488 OUR TEAM Ryan Kaplan Associate Broker c 603.953.4012 Brett Mulvey Sales Associate c 603.396.6098 Sharon Parker Sales Associate c 603.828.1705 John Rice Broker Associate c 603.498.4034 Barb Shea Sales Associate c 603.498.2115 Johathan Levy Sales Associate c 617.828.3921 Kathy Corbett Sales Associate c 603.781.6959 Madeline Flagg Sales Associate c 978.995.0922

566 Washington Road, Rye NH 03870 I 603.964.8028 I LiveSeacoast.com