
5 Financial Highlights
PART 1 Management’s Review 6 KIRKBI – A Family-owned Company 8 2018 At a Glance 10 Annual Review
About KIRKBI
KIRKBI Fundamentals
Billund – The Capital of Children
KIRKBI Responsibility
Associated Foundations
Board of Directors and Executive Management
Leadership team
Strategic Activities
LEGO Brand Group
The LEGO Group
Merlin Entertainments plc
LEGO Ventures
Other Strategic Activities
Investment Activities
Long-term Equity Ownership
Real Estate Investments
PART 2 Consolidated Financial Statements
Consolidated Statement of Comprehensive Income
Balance Sheet at 31 December
Statement of Changes in Equity
Cash Flow Statement 1 January – 31 December
PART 3 Notes – KIRKBI Group
PART 4 Parent Company
Management’s Statement
14
16
18
25
26
29
32
34
36
38
42
45
46
41 Renewables Investment Portfolio
50
51
52
54
56
Consolidated Income Statement
57
Contents
88
Contents
99
100
PART 5 Additional Information
Independent Auditor’s Report CONTENTS

| 4 | ANNUAL REPORT 2018 PART 1 FINANCIAL HIGHLIGHTS
FINANCIAL HIGHLIGHTS
KIRKBI Group (m DKK) 2018 2017 2016 2015 2014
Income statement:
Operating profit from strategic activities 12,630 12,342 14,254 14,041 11,020
Operating profit from investment activities (940) 4,000 2,960 3,307 3,373
Total operating profit 11,352 16,002 16,885 16,997 14,101 Profit for the year 8,681 12,679 13,285 13,396 10,818
Balance sheet:
Total assets 103,132 95,456 85,667 75,463 59,851
KIRKBI Group’s share of equity 82,514 76,305 66,407 56,295 45,218
Non-controlling interests 5,553 5,285 5,105 4,460 3,206 Liabilities 15,065 13,866 14,155 14,708 11,427
Cash flow statement:
Cash flows from operating activities 11,191 10,253 12,516 12,076 10,163 Investment in property, plant and equipment (2,394) (2,233) (7,572) (4,473) (6,803) Investment in intangible assets (57) (143) (92) (126) (59)
Employees:
Average number (full-time) 15,523 16,909 17,136 14,241 12,781
Financial ratios (in %): Equity ratio 85.4 % 85.5 % 83.5 % 80.5 % 80.9 % Return on equity 8.4 % 15.0 % 17.8 % 21.9 % 22.1 %
Financial ratios
Financial ratios have been calculated in accordance with the “Guidelines and Financial Ratios”, issued by the Danish Society of Financial Analysts.
Return on equity (ROE): Profit for the year (excl. non-controlling interests) x 100
Average equity (excl. non-controlling interests)
Equity ratio: Equity (incl. non-controlling interests) x 100
Total liabilities and equity
ANNUAL REPORT 2018 | 5 | FINANCIAL HIGHLIGHTS PART 1
2018 KEY FIGURES ASSOCIATED FOUNDATIONS
FAMILY
– A family-owned holding and investment company Our aspiration is to enable the Kirk Kristiansen family to succeed with the LEGO brand mission “to inspire through generations”. 100 % OWNERSHIP 15,523 Full-time employees 8.7 (bn DKK) Profit for the year 11.2 (bn DKK) Cash flows from Operating activities 88.1 (bn DKK) Total equity | 6 | ANNUAL REPORT 2018 PART 1 KIRKBI – A FAMILY OWNED COMPANY KIRKBI provides administrative support to associated foundations:
KIRK KRISTIANSEN
KIRKBI GROUP KIRKBI
Revenue 36.4 bn DKK Profit for the year 8.1 bn DKK Investments 1.5 bn DKK Employees (FTE) 15,050

Revenue 14.0 bn DKK Profit for the year 1.9 bn DKK Investments 2.7 bn DKK
Founded by Ole Kirk Kristiansen in 1932. Based on the LEGO® brick, the company provides unique play experiences for children of all ages.
Europe’s leading and the world’s second-largest visitor attraction operator. Owns the LEGOLAND® parks which were founded by Godtfred Kirk Christiansen in 1968 and the LEGOLAND® Discovery Centres, among other activities.

Strategic activities
RENEWABLES
Royalty 1.4 bn DKK
The LEGO® and LEGOLAND® trademarks. TRADEMARKS LEGO VENTURES


LEGO Ventures explores investment opportunities at the intersection of Play, Learning and Creativity to leverage and develop the original LEGO® Idea and support the LEGO brand mission.
Borkum Riffgrund 1 Ownership 31.5 % Capacity 312 MW
Burbo Bank Extension Ownership 25 % Capacity 258 MW
KIRKBI has invested into two offshore windfarms named Borkum Riffgrund 1 (Germany) and Burbo Bank Extension (UK).
The purpose of renewable investments is to support the LEGO Group’s goal to generate enough renewable energy to meet 100% of its energy consumption.

LONG TERM INVESTMENTS • Long-term Equity • Real Estate • Private Equity • Opportunities LIQUID INVESTMENTS • Bonds and corporate debt • Quoted Equities Investment activities 75 %
29.6 %
THE LEGO GROUP
MERLIN ENTERTAINMENTS PLC
100 % 100 %
2015 2016 2017 2018 50,000 0 10,000 20,000 30,000
50,000
2014 ANNUAL REPORT 2018 | 7 | KIRKBI – A FAMILY OWNED COMPANY PART 1
40,000
60,000
by LEGO Brand Group Other strategic activities
INVESTMENT PORTFOLIO (m DKK) Managed

| 8 | ANNUAL REPORT 2018 PART 1 2018 AT A GLANCE
Kjeld Kirk Kristiansen and Søren Thorup Sørensen
2018 AT A GLANCE
2018 has been a satisfactory year for the KIRKBI Group based on a good result in the LEGO Group and a challenging year in the investment activities impacted by volatility in the financial markets.
The Kirk Kristiansen family’s mission for the LEGO brand is to inspire and develop the builders of tomorrow. The family aims to fulfill the mission, helping all children grow and develop to their full potential through play by dedicated efforts driven by the LEGO branded entities.
KIRKBI is the Kirk Kristiansen family’s private holding and investment company founded to promote a sustainable future for the family ownership of the LEGO brand through generations.
During the year, the establishment of LEGO Brand Group within KIRKBI progressed well and we made important decisions for the development of the LEGO brand and the active and engaged family ownership in the future. We believe the close collaboration creates a solid foundation for a healthy development across all LEGO entities and ultimately enables the Kirk Kristiansen family to succeed with the mission.
In 2018, LEGO Brand Group reached an important milestone as the work around setting the direction for the LEGO brand towards 2032 was completed. The 2032 Vision and Brand Strategy expresses the owner family’s vision, wishes and dreams for the LEGO brand towards 2032 – the year the LEGO brand turns 100 years old.
During 2018, KIRKBI prepared to sign up for UN Global Compact, which was completed in early January 2019. As a signatory, KIRKBI will complete an annual Communication on Progress (COP) submission starting from the financial year 2019, demonstrating its progress in working towards the UN Global Compact’s ten principles. As KIRKBI grows, we wish to increase transparency towards all our stakeholders on how we progress on raising the bar further on responsible business operations.
2018 HIGHLIGHTS
Profit for the year for the KIRKBI Group amounted to DKK 8.7 billion compared to DKK 12.7 billion last year.
In 2018, the LEGO Group returned to growth and delivered satisfactory modest top and bottom-line growth. The LEGO Group increased revenue with 4% to DKK 36.4 billion and earnings with 3% to DKK 8.1 billion. The profitability remained satisfactory and the operational cash flows remained strong at DKK 9.8 billion in 2018 against DKK 10.7 billion in 2017. In 2018, the LEGO Group also celebrated an important and joyable milestone – the 60th anniversary of the LEGO® brick and the company introduced the first elements made from plant-based plastics and pledged to use 100 percent sustainable packaging by 2025.
Within Merlin Entertainments plc, the total number of visitors grew by 1.4% to 67 million and revenue grew by 5.9% in 2018. In the LEGOLAND® parks, revenue increased by 6.4%. The construction of the LEGOLAND park in New York began early 2018 and later Merlin announced the planning of a new LEGOLAND park in Korea targeted opening in 2022.
Within Renewables, the two wind farms Burbo Bank Extension and Borkum Riffgrund 1 delivered a stable financial return, despite a lower wind resource than expected throughout the year. Altogether, the KIRKBI share of the windfarms produced electricity corresponding to the electricity consumption of more than 114,000 households.
The return from the investment portfolio was a net loss of DKK 0.9 billion against a profit of DKK 4.0 billion last year. The investment result was negatively impacted by the volatility within the financial markets – most significantly Quoted Equities and Long-term
Equity were impacted. The performance within Private Equity and Real Estate was strong. The investment portfolio in KIRKBI increased to DKK 58 billion by the end of 2018 from DKK 54 billion at the end of 2017. The investment activities have had a strong start in 2019.
In 2018, KIRKBI increased its holding of shares in Landis+Gyr, Nilfisk and ISS and completed Real Estate investments in Hamburg and London. Furthermore, KIRKBI completed the sale of all our shares in Minimax Viking GmbH.
During the year, the KIRKBI organisation moved into the new office extension in Billund – a 3,600 m2 extension to the existing office, which has been made entirely out of wood. The wooden materials used for this building have a more sustainable CO2 impact on the planet compared to a similar sized building with a concrete construction. The new building meets our need for more space and in addition, the open and friendly atmosphere in the building creates a pleasant working environment with the possibility of mixing work with play, learning and creativity.
We would like to thank all employees for their dedicated contributions and professional support within a broad span of services and disciplines. We look forward to continuing the positive development of KIRKBI in 2019.
Kirk Kristiansen Chairman of the Board
Søren Thorup Sørensen CEO
ANNUAL REPORT 2018 | 9 | 2018 AT A GLANCE PART 1
Kjeld
ANNUAL REVIEW
INCOME STATEMENT
The KIRKBI Group’s profit for the year 2018 amounted to DKK 8,681 million against DKK 12,679 million in 2017. The profit exclusive non-controlling interests for 2018 was DKK 6,655 million compared with DKK 10,720 million for 2017.
KIRKBI’s financial result is mainly influenced by the financial yield from investment activities and the performance within the LEGO Group. The financial markets have been challenging during 2018, especially during the last months with the year. The yield for 2018 was negative with 1.5%. We consider the result acceptable as the general development within the financial markets has been volatile and because KIRKBI invests with a long-term horizon.
The performance within the LEGO Group, with a revenue growth of 4% and an EBIT growth of 3%, is considered satisfactory.
The 2018 financial results for the KIRKBI Group is considered satisfactory and in line with the expectations disclosed in the KIRKBI Annual Report 2017.
It is proposed to distribute dividend in the amount of DKK 200 million.
BALANCE SHEET
At the end of the year, the total assets amounted to DKK 103 billion against DKK 95 billion in 2017. The increase is primarily due to investments within the LEGO Group and investment-related securities. The equity ratio was 85.4% against 85.5% in 2017.
CASH FLOWS
In 2018, cash flows from operating activities were DKK 11,191 million against
DKK 10,253 million in 2017. Cash flows from investing activities were DKK -7,760 million against DKK -7,987 million in 2017.
DEVELOPMENT IN THE KIRKBI GROUP’S ACTIVITIES AND FINANCIAL POSITION
KIRKBI’s profit before tax for the year 2018 amounts to DKK 11,281 million compared to DKK 16,044 million last year. The negative development in profit for the year of DKK 4,763 million, compared to last year, is mainly due to negative development in return from the investment activities of DKK 4,940 million offset by increased earnings from the LEGO Brand Group activities of DKK 297 million.
For the LEGO Group, 2018 was a year of stabilisation and return to growth. Revenue for the full year increased by 4% to DKK 36.4 billion and profit before tax increased by 3% to DKK 10.5 billion. Due to the increased revenue in the LEGO Group, Royalties increased by 4% from DKK 1,346 million in 2017 to DKK 1,400 million in 2018.
Merlin Entertainments plc improved net revenue with 6% to GBP 1,688 million compared to 2017. Profit for the year was GBP 230 million, an increase of 10% compared to last year. KIRKBI’s share of profit from Merlin activities amounts to DKK 600 million compared to DKK 567 million in 2017. Dividend received from Merlin Entertainments plc was in 2018 DKK 188 million.
Within Renewables, the two wind farms Burbo Bank Extension and Borkum Riffgrund I delivered a stable financial return, despite a lower wind resource than expected throughout the year mainly due to the warm weather
| 10 | ANNUAL REPORT 2018 PART 1 ANNUAL REVIEW
Ole Kirk Kristiansen, Founder of the LEGO Group
conditions in Europe during the summer of 2018. Net result from Renewables for 2018 amounted to DKK 389 million against DKK 398 million for 2017. Cash flows from operations of Renewables amounted to DKK 616 million compared to DKK 609 million in 2017.
The investment activities yielded a negative return of DKK 940 million compared to a gain of DKK 4,000 million in 2017. The financial markets were challenged in 2018, which also negatively impacted KIRKBI’s return on investment activities. KIRKBI’s investments in Quoted Equities and Long-term Equity were specifically impacted. On the other hand, KIRKBI’s investments within strong Private Equity and Real Estate performed strong and reduced the negative yield from investment activities to a total negative return of 1.5%.
During the year, the investment portfolio increased by around DKK 4 billion to DKK 58 billion, impacted by cash inflow from the LEGO Group, negative return from the investment portfolio and positive cash flow from Renewables.
PEOPLE RESOURCES
In the KIRKBI Group’s core activities, employees are the single most critical resource. The KIRKBI Group’s results are accomplished thanks to the motivation and commitment of the employees. As part of the overall corporate strategy, employees and management work together to continuously secure job satisfaction and a healthy working environment.
In 2018, the average number of full-time employees in the KIRKBI Group was 15,523 against 16,909 in 2017. These numbers are exclusive of the employees in Merlin
Entertainments plc. 97% of the employees work in the LEGO Group.
The majority of the employees in the LEGO Group and KIRKBI are subject to a Performance Management Programme, which aims to link business objectives with individual employee objectives. This programme includes a tiered bonus scheme.
RISKS
The KIRKBI Group’s risks primarily relate to developments within the global toy markets where the LEGO Group operates, the market for family entertainment and other leisure activities and the financial markets.
RESEARCH AND DEVELOPMENT ACTIVITIES
The Parent Company does not engage in research or development activities. Group enterprises conduct research and development within their respective business areas.
EXPECTATIONS FOR 2019
The investment activities will be impacted by the development in the global economy in 2019 and hence it is difficult to express clear expectations of the results for the year. The objective for the KIRKBI Group is to create satisfactory long-term returns.
The year 2019 has started strong from a financial point of view. The overall result for 2019 for the KIRKBI Group is expected to exceed the result for 2018.
ANNUAL REPORT 2018 | 11 | ANNUAL REVIEW PART 1

| 12 | ANNUAL REPORT 2018 PART 1 ABOUT KIRKBI
ABOUT KIRKBI
CONTENTS
14 KIRKBI Fundamentals
16 Billund – The Capital of Children 18 KIRKBI Responsibility 24 Associated Foundations 26 Board of Directors 28 Leadership Team
In 2018, KIRKBI moved in to the new office extension in Billund – a 3,600 m2 extension to the existing office, which has been made entirely out of wood. The wooden materials used for this building have a lower CO2 impact on the planet compared to a similar sized building with a concrete construction.

ANNUAL REPORT 2018 | 13 | ABOUT KIRKBI PART 1
KIRKBI FUNDAMENTALS
The LEGO brand mission is to inspire and develop the builders of tomorrow. The Kirk Kristiansen family aims to fulfill the mission, helping all children grow and develop to their full potential through creative play, by dedicated efforts driven by the LEGO branded entities.
As the private holding and investment company with the role to promote a sustainable future for the family ownership of the LEGO brand through generations, KIRKBI shares the same mission, promises, spirit and values as the LEGO branded entities.
This shared foundation for the family enterprises is reflected in the LEGO® Idea Paper – a short internal document written by the Kirk Kristiansen family. The LEGO® Idea Paper describes the family’s fundamental belief that “Children are our role models”, the mission, the vision, the LEGO Idea, the values and the promises.
The KIRKBI Fundamentals is the graphic illustration of the LEGO® Idea Paper in a KIRKBI context including the aspiration, which is reflecting KIRKBI’s specific role and purpose as the private holding and investment company: KIRKBI aspires to enable the Kirk Kristiansen family to succeed with the mission through generations and to create a positive impact through responsible ownership and investments.
The KIRKBI Fundamentals serve as the compass in all our business activities.
ACTIVE AND ENGAGED FAMILY OWNERSHIP THROUGH GENERATIONS
Through generations, active and engaged family ownership of the LEGO brand, has been viewed by the Kirk Kristiansen family as not only a task
but also as an obligation to make a true difference in children’s lives. The ownership is rooted in the family heritage, the values and the purpose of enabling children to learn, grow and develop through play, which is also expressed in the name ‘LEg GOdt’ – play well. Ole Kirk Kristiansen, the founder of the LEGO Group, was focused on providing quality play materials for children from the very beginning in the 1930ies. He had a saying: ‘Only the best is good enough’, which he used to explain how children deserve the best. The saying is still used and referred to by all employees as the LEGO spirit across the LEGO branded entities.
Being an active and engaged owner of the LEGO brand today is defined by the Kirk Kristiansen family as having a deep interest and engagement in how the family enterprises develop, how the enterprises engage with children of all ages as well as stakeholders in general, what the culture is like and how the values are lived and not least – caring for employees.
In short, active and engaged ownership is about being guardians of how the Kirk Kristiansen family enterprises do business.
To ensure a continued active and engaged family ownership of the LEGO brand, the Kirk Kristiansen family has carefully prepared for the smooth handover between the third and fourth generation, which is ongoing.
In 2016, Kjeld Kirk Kristiansen and Thomas Kirk Kristiansen took the first steps in the smooth handover as they swapped roles in the Board of Directors in LEGO A/S where Thomas Kirk Kristiansen became deputy chairman and Kjeld Kirk Kristiansen took on the role as board member. On the board of the LEGO
Foundation, Thomas Kirk Kristiansen became chairman and Kjeld Kirk Kristiansen deputy chairman. Kjeld Kirk Kristiansen continues to be the chairman of the board of KIRKBI A/S.
As a part of the transition and the future family ownership, the Kirk Kristiansen family decided that in each generation one person should be taking on the role as the most active owner. The most active owner will, on behalf of the whole family, be close to the LEGO branded entities. The family agreed that Thomas Kirk Kristiansen should assume this role representing the fourth generation.
In 2017, LEGO Brand Group – an entity within KIRKBI – was established to protect, develop and leverage the full potential of the LEGO brand and support the continued family ownership through generations. Read more about LEGO Brand Group on page 32.
Furthermore, the family has agreed that all owners in each generation are engaged and responsible shareholders as well as ambassadors and culture carriers of the family values. All owners are engaged in different ways in the business of the LEGO Group, KIRKBI and the associated foundations – acting as members of the Board or undertaking representative duties.
In addition, the fourth generation of the Kirk Kristiansen family has established a programme for their children in the fifth generation named ‘The LEGO School’. The LEGO School is not a school in the traditional sense. In fact, the purpose of the programme is to support the children in developing their own identity, as individuals and as part of a family community, around being future owners – in a fun, safe and playful environment.
| 14 | ANNUAL REPORT 2018 PART 1 THE KIRKBI FUNDAMENTALS
KIRKBI is the Kirk Kristiansen family’s private holding and investment company founded to promote a sustainable future for the family ownership of the LEGO brand through generations.
KIRKBI FUNDAMENTALS MISSION Inspire and develop the builders of tomorrow ASPIRATION
Enable the Kirk Kristiansen family to succeed with the mission through generations and to create a positive impact through responsible ownership and investments PROMISES People Promise Succeed together Partner Promise Mutual value creation Planet Promise Positive impact SPIRIT Only the best is good enough — always strive to do better
”
As a family and owners of the LEGO® brand and the LEGO® branded entities we fundamentally believe that Children are our role models. Children are curious, creative and imaginative. They embrace discovery and wonder. They have a natural hands-on, minds-on approach to learning. These are precious qualities that must be nurtured and stimulated throughout life. Because, people with a childlike urge to learn are best equipped to thrive in a fast paced and constantly changing world.
The Kirk Kristiansen family in the LEGO® Idea Paper
THE ORIGIN OF THE KIRKBI NAME
The company name KIRKBI reflects the family ownership and heritage as it is a combination of the family name ‘Kirk’ and the city ‘Billund’ in Denmark. In 1932, Ole Kirk Kristiansen started making wooden toys in his workshop in Billund, Denmark, and from 1934, he sold them as LEGO® toys. Today, KIRKBI owns 75% of the LEGO Group. The remaining 25% is owned by the LEGO Foundation.
ANNUAL REPORT 2018 | 15 | THE KIRKBI FUNDAMENTALS PART 1
THE
VALUES Imagination — Creativity — Fun — Learning — Caring — Quality
BILLUND – THE CAPITAL OF CHILDREN
Billund is of great importance to KIRKBI and the LEGO brand. It was in Billund it all began in 1932 when Ole Kirk Kristiansen started making wooden toys in his workshop. The toys were sold as LEGO® toys from 1934. Today, Billund is the backbone for more than 6,000 citizens. Thousands of people work here and commute to Billund every day. And about three million tourists come to the town every year to pay the town’s many attractions a visit –such as the world’s first LEGOLAND® Park or LEGO® House - the home of the brick.
Billund is also where KIRKBI is headquartered and the town is even reflected in the KIRKBI name –a combination of the owner family’s name ‘Kirk’ and ‘Bi’ for Billund.
Because of this special heritage, where the Kirk Kristiansen family across generations has been actively engaged in supporting the development of Billund and making it an even more attractive town to work and live in, KIRKBI joined a visionary plan for the development of the whole town together with Billund Municipality and Realdania in 2015.
The Billund City Vision sets the framework for supporting and strengthening Billund’s unique character as the Capital of Children, where children of all ages learn through play and are creative citizens of the world. The vision is expressed in a 400-pages long publication that provides KIRKBI
and our partners with a framework for urban and cultural planning in a town that is multifaceted despite its small size.
A focal element in the vision is to mould greater cohesion between spaces for citizens, employees and visitors. One way to connect these spaces is to concentrate urban spaces with green and safe environments and through the vision’s “Playline” - a playful walk and bicycle path across the town.
For KIRKBI specifically, the vision provides a framework for how Billund should develop, and subsequently, how KIRKBI can support the development; which includes Real Estate activities in Billund - the Capital of Children.
KIRKBI is currently engaged in several real estate projects in Billund – all of them supporting the City Vision and inherently the Capital of Children. Three of KIRKBI’s current projects are:
• ‘Butikstorvet’, which is a new downtown area with stores, apartments, space for offices, city nature and the Vision’s ‘Playline’ going in between six buildings. Constructed in close collaboration with Billund Municipality, the ambition is to create a more modern and dense midtown where people from near and far can enjoy time together. The construction of Butikstorvet will be finalised in 2020.
• ‘LEGO Campus’, which is the new gathering point for the entire LEGO Group. LEGO Campus will be 54,000 m2 divided into eight connected buildings when the construction is finalised in 2021.
• ‘Kastanjehjørnet’, which is a resindential property of 6,300 m2 housing divided between dementia apartments next to Billund Municipality’s care home, council apartments to the non-profit housing association, Bovia, and apartments that will be administered by KIRKBI. The construction of Kastanjehjørnet in Billund’s midtown will be finalised in 2021.
Butikstorvet’s building site in the centre of Billund. When the shopping area is finalised in 2020, it will entail stores, apartments, space for offices, city nature and the vision’s ‘Playline’ going in between six buildings.
| 16 | ANNUAL REPORT 2018 PART 1 BILLUND – THE CAPITAL OF CHILDREN

ANNUAL REPORT 2018 | 17 | BILLUND – THE CAPITAL OF CHILDREN PART 1
KIRKBI RESPONSIBILITY
With KIRKBI Fundamentals serving as the compass for everything we do, responsibility is at the core of our business. Through the three Promises to people, to partners and to the planet, we aim to create a positive impact through responsible ownership and investments.
KIRKBI’s main objective is to support a sustainable future for the family ownership of the LEGO brand through generations. We are driven by a strong set of values and a purpose of enabling the Kirk Kristiansen family to reach as many children in the world as possible with a meaningful play experience.
To do so, environmental, social and governance matters are at the core of our business. Furthermore, as KIRKBI grows, we wish to increase transparency towards all our stakeholders on how we progress on raising the bar further on responsible business operations. This calls for an externally recognised framework for expressing our expectations for responsibility.
During 2018, we prepared to sign up to the UN Global Compact, the world’s largest corporate sustainability initiative and in January 2019, the sign up was completed. As a signatory, KIRKBI will support the UN Global Compact’s 10 principles in the areas of human rights, labour, environment and anti-corruption, thereby reinforcing the company’s commitment to responsible business practices.
LIVING THE PROMISES Code of Conduct
While the KIRKBI Fundamentals and underlying Promises, both of which align closely with the UN Global Compact’s principles, serve as a compass in all our business activities. In 2018, KIRKBI released a Code of Conduct for employees, which formalises KIRKBI’s policies related to human rights, labour, environment and anti-corruption.
We have provided personalised training to KIRKBI employees throughout 2018. Our expectations to our partners to uphold strong responsibility standards are communicated via our Investment Principles and Supplier Code of Conduct.
Responsible Investment
Below, KIRKBI’s investment process is outlined, including how we integrate responsibility - often referred to as ESG, or environmental, social, and governance –considerations into the investment process and active ownership practices. This applies to all of KIRKBI’s investment activities. A set of guidelines for implementing these principles has been established with the appropriate flexibility and recognition of differences among strategies and managers.
ESG Integration
In collaboration with our external partners, KIRKBI assesses its potential investments and monitors its portfolio for the following:
• involvement with activities on our negative list;
• company ESG performance according to exposure to industry- and companysignificant ESG risks performance according to material industry and company ESG risks and ability to manage those risks relative to industry peers;
• company involvement in notable ESG controversies related to the company’s operations and/or products, possible breaches of international norms and principles such as the UN Global Compact, and performance with respect to these norms and principles.
In 2018, we focused implementation efforts on ESG integration throughout the investment classes. ESG integration is about integrating information about companies’ performance and efforts into the decision-making basis and ownership practices.
Ole Kirk Kristiansen, Founder of the LEGO Group
| 18 | ANNUAL REPORT 2018 PART 1 KIRKBI RESPONSIBILITY
INVESTMENT
Negative screening ESG integration Active ownership
REPONSIBLE
PROCESS IN KIRKBI
DESCRIPTION
People Promise – Succeed together
To enable execution of the business strategy and to build the long-term health of the company – we believe people and values make the difference
FOCUS AREAS 2019
• Strengthen employee engagement and satisfaction reflected in the annual employee engagement survey, PULSE
• Continue to roll out the KIRKBI Code of Conduct and ensure compliance regarding personal data protection across the KIRKBI Group
DESCRIPTION
Partner Promise – Mutual value creation
To build partnerships that enhance mutual value creation, entail openness and trust – partners should feel energised and inspired from their involvement with KIRKBI
FOCUS AREAS 2019
• Continue to strengthen and implement the active ownership model throughout the investment portfolio
DESCRIPTION
Planet Promise – Positive impact
To create a positive impact on the planet through responsible investments and ownership – a commitment to society to keep earning a trusted position
FOCUS AREAS 2019
•
ANNUAL REPORT 2018 | 19 | KIRKBI RESPONSIBILITY PART 1
activities People Promise Partner Promise Planet Promise MISSION Inspire and develop the builders of tomorrow ASPIRATION
the
to succeed with the mission
generations and to create a positive impact through responsible ownership and investments PROMISES People Promise Succeed together Partner Promise Mutual value
Planet Promise Positive impact SPIRIT
the
do better VALUES Imagination — Creativity — Fun — Learning —
Quality
Finalise the approach to sustainability in the real estate portfolio
Enable
Kirk Kristiansen family
through
creation
Only
best is good enough — always strive to
Caring —
DIALOGUE RELATED TO QUOTED EQUITIES PARTNERS
KIRKBI will engage in dialogue with companies in case of controversies or breaches of internationally agreed conventions and norms (e.g. those of UN Global Compact). In collaboration with an external partner, we choose to first communicate with the company to understand what remedies are in place and what types of enhanced controls the company has implemented to prevent further breaches. As necessary, we attempt to influence change in the company’s operations. If these efforts fail, we will divest from the company.
FACTS ABOUT KIRKBI
The number of people in the KIRKBI organisation is 165 people (KIRKBI A/S, KIRKBI AG and KIRKBI Invest).
The number of full-time employees in the KIRKBI Group was 15,523 (97% of the employees work in the LEGO Group).
KIRKBI’s headquarter is in Billund.
KIRKBI also has offices in Copenhagen (Denmark) and in Baar (Switzerland).
ACTIVE OWNERSHIP
Over the years, KIRKBI has been developing and refining our internal guidelines about what we believe is important when engaging with other companies as an active owner. In 2019, we will focus on further implementing these guidelines.
As a responsible long-term oriented owner and investor, we regularly monitor and track financial data as well as key performance indicators on material sustainability-related risks related to each investment. Moreover, to underpin the long-term orientation, we endeavor to engage actively with the companies and investment partners. KIRKBI seeks to contribute positively to the strategic direction and the management of material ESG-related risks in each of the companies and investment partners for the long term. This includes actively supporting the pursuit of new business opportunities and mitigation of material risks within the focus areas of our Promises.
As active owner, KIRKBI engages in a number of ways, including:
• Board representation
• Shareholder communication with board of directors and management
• Voting at the annual general meetings of companies
PEOPLE DEVELOPMENT
In KIRKBI, we have specialised and experienced professionals in such diverse fields as investment and treasury management, board assignments, real estate investments and operations to business administration and controlling, legal advisory, communication and HR.
A diverse group of KIRKBI people is highly needed to pursue the aspiration to enable the Kirk Kristiansen family to succeed with the mission to inspire and develop the builders of tomorrow. Besides, people development is an integral part of our company culture and the People Promise.
With KIRKBI’s People Promise, we want to unleash the full potential of all KIRKBI employees while at the same
time succeeding together. We focus on enabling and developing our people’s competencies and ensuring that the people leaders have the right leadership capabilities in order to continue being strong role models.
In KIRKBI, we do this to enable execution of the business strategy and to build the long-term health of the company. We believe that it is our people, the determination to succeed together as well as our ability to live the KIRKBI Fundamentals that make the difference.
Professional and personal growth
The KIRKBI Human Resource Annual Cycle is a framework, which aims at enabling and maintaining our people’s competencies through a continuous focus on development, while at the same time ensuring satisfied and motivated KIRKBI people who thrive in the workplace and succeed together.
The HR Annual cycle consists of three core HR processes:
• A Performance Management Programme (PMP)
• An Individual Development Plan (IDP)
• An annual employee engagement survey called PULSE
With a focused, measurable and effective Performance Management Programme, we want to meet our most critical business objectives and to increase motivation, inspiration and satisfaction in the daily work.
In this continuous process, all employees focus, prioritise and reach KPI’s that are both critical for success in the individual role, but at the same time linked to team objectives as well as objectives and focus areas for KIRKBI as an organisation.
KIRKBI’s PMP process is linked to an incentive program with the purpose of rewarding and encouraging successful performance.
The PMP process is linked with an Individual Development Plan, which is prepared to support our people’s personal and professional development plan.
| 20 | ANNUAL REPORT 2018 PART 1 KIRKBI RESPONSIBILITY

ANNUAL REPORT 2018 | 21 | KIRKBI RESPONSIBILITY PART 1 KIRKBI 2018 KIRKBI 2017 EEI Benchmark* 0 500 1000 2012 2013 Motivation and satisfaction 2014 2015 2016 0 20 40 60 80 100 PULSE SURVEY 100 as the highest score. Response rate 2018: 95% Men Women KIRKBI organisation People managers 0 20 40 60 80 100 KIRKBI 2017 KIRKBI 2016 EEI* Benchmark 2017, Denmark Motivation and satisfaction Engagement 0 GENDER COMPOSITION IN KIRKBI Number of employees *EEI (Ennova Employee Index) is an international benchmark survey.
In KIRKBI, we believe that focusing on what motivates and energises our people as well as the competencies each person needs in order to reach career goals are crucial to obtain motivation and satisfaction in the daily life.
Once a year, we also measure motivation, satisfaction and engagement across the organisation in the PULSE survey. The responses are used to identify needed actions in teams and at an organisational level. The KIRKBI results are also benchmarked towards Ennova Employee Index (EEI), Denmark. In 2018, the PULSE survey showed that KIRKBI maintain, a high motivation and satisfaction across the organisation with a score of 82 out of 100. This gives us a strong position against the EEI benchmark in Denmark, which has a score of 70 in average.
KIRKBI also uses the E-NPS (Employee Net Promoter Score) as a leading indicator for engagement and motivation. The E-NPS is based on the results for the PULSE question; “I would recommend KIRKBI as an employer to other people.” Here, the KIRKBI score is 69% out of 100%, providing KIRKBI with an indicator that we have loyal, motivated and engaged people. The average score in EEI Denmark is 9%.
But in line with our spirit – we always strive to do better ensuring that KIRKBI is the best and most healthful workplace.
A healthy working life
We want to make sure that KIRKBI has a safe and healthy mental and physical work environment. This includes focussing on our people’s wellbeing and ensuring that work life is well balanced with life after work.
Through KIRKBI’s Working Environment Committee’s, whose objective is to ensure a focus on environmental, safety and health areas and to identify areas of improvement. Along with this committee, and offers like access to fitness facilities and social sports initiatives, health care specialists and healthy food at the canteens, KIRKBI wants to give all employees the best opportunities to take care of their physical and mental health.
In KIRKBI’s PULSE survey – our annual employee engagement survey – we also measure how employees find work-life balance, health and safety in KIRKBI, and we follow up if there are any actions that need to be taken.
People diversity
KIRKBI wants to have a diverse working environment. We believe that a truly diverse organisation represents an opportunity to succeed in the long term. As a result, we attract and retain people with different skills and backgrounds in order to succeed – giving all our current and future people opportunities to develop in
KIRKBI. At any time, we aim at recruiting the best qualified to the job regardless of the person’s individual background and personal characteristics.
The figure on page 21 shows the gender composition for the entire KIRKBI organisation and for people managers.
Women make up more than half of the workforce, and the gender balance is also reflected in the number of people managers. However, the gender balance is not yet reflected in The Board of Directors as there are no female members in the board. KIRKBI and the board are constantly working to ensure the right combination of competencies to support the further development of the KIRKBI Group. This includes a focused effort to increase KIRKBI’s gender diversity at board level. It is the intention to meet the target of hiring at least one female member to the board before the end of 2021.
Thomas Kirk Kristiansen
Representing the fourth generation of the owner family
| 22 | ANNUAL REPORT 2018 PART 1 KIRKBI RESPONSIBILITY
It is at the very heart of our companies to always strive to do better. We want to be the best partner to work with, to be the best workplace for our people, and to be the best company for society.
”
FACTS
ELECTRICITY FOR MORE THAN 114,000 HOUSEHOLDS
During 2018, KIRKBI’s share of the two wind farms, Burbo Bank Extension and Borkum Riffgrund 1, generated clean power corresponding to the electricity consumption of more than 114,000 households – or enough to balance more than 100% of the LEGO Group’s energy use at all LEGO factories, stores and offices.
LEGO GROUP RESPONSIBILITY STORY
KIRKBI’s responsibility policy is to ensure high standards for corporate responsibility in all operations carried out by the company. KIRKBI as a parent has not yet developed specific policies for all areas within coporate responsibility however KIRKBI supports the LEGO Group’s commitment to responsibility.
The LEGO Group works comprehensively with corporate responsibility matters and continuously communicate their progress and how they are working within the areas of human rights, labour standards, environment and anti corruption. Please refer to https://www.lego.com/da-dk/ aboutus/responsibility.
PARTNER IN THE CAPITAL OF CHILDREN
KIRKBI joined a visionary plan for the development of Billund – Capital of Children - together with Billund Municipality and Realdania in 2015. For KIRKBI, the vision provides a framework for how Billund should develop, and subsequently, how KIRKBI should target Real Estate projects in Billund to support the continued development of the Capital of Children.
KIRKBI is currently engaged in several building projects in Billund – all of them supporting the City Vision and the Capital of Children. Read more on page 16.
KIRKBI CODE OF CONDUCT
In 2018, KIRKBI implemented a Code of Conduct for employees. The Code of Conduct serves as a guide to making the right decisions at all times.
The KIRKBI Fundamentals set the bar high, and subsequently we expect all employees and partners working together with us to apply high ethical standards and principles of integrity, honesty and legality in all we do, both professionally and personally.
KIRKBI SIGNS UP TO THE UN GLOBAL COMPACT
During 2018, KIRKBI prepared to sign up to the UN Global Compact, the world’s largest corporate sustainability initiative and in January 2019, the sign up was completed.
KIRKBI’s main objective is to support a sustainable future for the family ownership of the LEGO brand through generations. To do so, environmental, social and governance matters are already today at the core of our business. However, as KIRKBI grows, we wish to increase transparency towards all our stakeholders on how we progress on raising the bar further on responsible business operations. This calls for an externally recognised framework for expressing our expectations for responsibility.
ANNUAL REPORT 2018 | 23 | KIRKBI RESPONSIBILITY PART 1
The LEGO Foundation granted USD 100 million to Sesame Workshop to ensure that young children affected by the Rohingya and Syrian crises have opportunities to learn through play and develop the skills needed for the future.

| 24 | ANNUAL REPORT 2018 PART 1 ASSOCIATED FOUNDATIONS
Photo: Ryan Donnell Sesame Workshop
ASSOCIATED FOUNDATIONS
Learning-through-Play empowers children to become creative, engaged, lifelong learners and develop the holistic skills that serve them, their communities and society throughout a lifetime. The LEGO Foundation is working to change the hearts and minds of those who influence children’s lives, through programmes, research and advocacy, to make sure they embrace the transformative power of play.
As part of the ongoing commitment to giving children better opportunities to reach their full potential, the LEGO Group owner family has entrusted the LEGO Foundation with 25% ownership of the LEGO Group and it is primarily through this ownership the LEGO Foundation funds its activities.
In 2018, the LEGO Foundation announced its first humanitarian grant: USD 100 million to Sesame Workshop to ensure that young children affected by the Rohingya and Syrian crises have opportunities to learn through play and develop the skills needed for the future.
The LEGO Foundation reached more than 2.4 million children around the world in total in 2018, including children in vulnerable situations reached through LEGO Charity product donations. The total LEGO Foundation activities amounted to DKK 532 million in 2018 (2017: DKK 407 milion).
Ole Kirk’s Fond is a charitable foundation and its purpose is to improve the quality of life of children and their families. A caring approach and the right of all children to be children were key motivators for LEGO founder Ole Kirk Kristiansen. Ole Kirk’s Fond was established in his memory and to fulfil the values and the caring philosophy that he represented. Today, Ole Kirk’s Fond has special focus on the social area, although the foundation also supports cultural, church-related, humanitarian and educational purposes.
In 2018, Ole Kirk’s Fond supported many projects with the aim of supporting children and their families with a breathing space in everyday life. The initiative ‘Nature Clubs’ by Save the Children in Denmark is one of those projects. The
establishment of nature clubs around Denmark will give children in marginalised residential areas educational and social experiences in the nearby nature. These children are often socially excluded and do not come out as much as other children do.
Furthermore, Ole Kirk’s Fond joined forces with the Capital Region of Denmark and Rigshospitalet in 2016 to build a new public hospital called ‘BørneRiget’ that sets new standards for the treatment of children, adolescents, pregnant women and their families. In 2018, focus has been to prepare for the construction site, which will be initiated in 2020.
Donations amounted to DKK 133 million in 2018 (2017: DKK 90 million).
ANNUAL REPORT 2018 | 25 | ASSOCIATED FOUNDATIONS PART 1
BOARD OF DIRECTORS AND EXECUTIVE MANAGEMENT
Kjeld Kirk Kristiansen
Chairman of the Board and member since 1974
Majority Shareholder of KIRKBI A/S
President and CEO of the LEGO Group 1979-2004
Chairman of the Board of Koldingvej 2 Billund A/S and Ole Kirk’s Fond. Deputy Chairman of the Board of the LEGO Foundation and Board member in LEGO A/S and CoC Office A/S and four fully owned subsidiaries of KIRKBI A/S

Niels Jacobsen
Deputy Chairman of the Board and member since 2008
CEO of William Demant Invest A/S
Chairman of the Board of Founders A/S, Jeudan A/S, Nissens A/S, Vision RT Ltd., Össur hf and the Thomas B. Thrige Foundation
Deputy Chairman of the Board of William Demant Holding A/S and ABOUT YOU Holding GmbH
Member of the Board of Boston Holding A/S and Sennheiser Communications A/S
Jeppe Christiansen
Member of the Board since 2008
CEO of Maj Invest Holding A/S
Chairman of the Board of Haldor Topsøe A/S


Deputy Chairman of the Board of Maj Bank A/S, Novo Nordisk A/S and Symphogen A/S
Member of the Board of Novo Holdings A/S
Member of the executive management of Maj Invest Equity A/S, Det Kgl. Vajsenhus and Emlika ApS
| 26 | ANNUAL REPORT 2018 PART 1 BOARD OF DIRECTORS AND EXECUTIVE MANAGEMENT
Member of the Board since 2001
Chairman of the Board of Danske Spil A/S, The Loevenholm Foundation, Nature Energy Biogas A/S, Velliv fmba and The Green Museum
Member of the Board of DLR Kredit A/S, Velliv Pension & Livsforsikring A/S, Fællesfonden and Askov High School
Member of the Board of Representatives of The Danish Central Bank, Hedeselskabet, Velliv and Sydbank A/S
 Thomas Kirk Kristiansen

Member of the Board since 2007
Shareholder of KIRKBI A/S and representing the fourth generation of the owner family
Chairman of the Board of the LEGO Foundation and Great Northern A/S
Deputy Chairman of LEGO Brand Group, LEGO A/S and Board member in four fully owned subsidiaries of KIRKBI A/S
Executive Management member of Kirk og Kirk Holding ApS and management roles in 4 subsidiaries
ANNUAL REPORT 2018 | 27 | BOARD OF DIRECTORS AND EXECUTIVE MANAGEMENT PART 1
Peter Gæmelke
THE LEADERSHIP TEAM INCLUDES FIVE MEMBERS. FROM THE LEFT:

Kurt Carstensen
Chief Financial Officer
Sidsel Marie Kristensen Head of Legal
Steen Pedersen
Head of Global Real Estate
Søren Thorup Sørensen Chief Executive Officer
Thomas Lau Schleicher Chief Investment Officer
| 28 | ANNUAL REPORT 2018 PART 1 LEADERSHIP TEAM
LEADERSHIP TEAM
Kurt Carstensen Chief Financial Officer
Born: 1961
Education: MSc in Finance and Accounting, University of Southern Denmark, 1990. State Authorised Public Accountant
Career and positions 1992-1997 Deloitte, Partner 1997-2004 LEGO System A/S, Vice President 2005-2006 Alstom Power FlowSystems, CFO
2006-2008 Louis Poulsen Lightning A/S, CFO 2009-2011 GPV International A/S, CFO 2011- KIRKBI A/S, CFO
Other management positions
Chairman of the Board of Kvist Industries A/S. Member of the Board in Isabellafonden (and five fully owned subsidiaries), Søstrene Grenes Holding ApS (and two fully owned subsidiaries), Dansk Skorstensteknik A/S, Great Northern A/S, CoC Office A/S and nine fully-owned subsidiaries of KIRKBI A/S
Sidsel Marie Kristensen Head of Legal
Born: 1975
Education: Master of Law, Aarhus University, 2000. Master in International and European Business Law, University of Leuven, 2007
Career and positions 2000-2015 Bech-Bruun (2000-2013) Lawyer (2014-2015) Partner 2016- KIRKBI A/S, Head of Legal
Other management positions
Member of the board of directors of Koldingvej 2, Billund A/S and 14 fullyowned subsidiaries of KIRKBI A/S.
Steen Pedersen
Head of Global Real Estate
Born: 1960
Education: BSc in Civil Engineering, Technical University of Denmark, 1986. Executive MBA, Scandinavian International Management Institute, 2003. Executive education at INSEAD, Wharton and London Business School
Career and positions
1986-1993 ABB Energy and Industry, Project Manager and Manager 1993-2010 NNE Pharmaplan. (1993-1997) Manager 2010-2013 Alvent A/S. (2010-2011) Director. (2011-2013) CEO & Co-owner 2013- KIRKBI A/S, Head of Global Real Estate
Other management positions
Member of the Board of eight fullyowned subsidiaries of KIRKBI A/S
Thomas Lau Schleicher Chief Investment Officer
Born: 1973
Education: MSc in Finance and Accounting, Aarhus School of Business, 1998
Career and positions
1998-2000 Handelsbanken, Associate 2000-2001 Alfred Berg Bank, Associate 2001-2010 EQT Partners, Director 2010- KIRKBI A/S, CIO
Other management positions
Member of the Board of Välinge Group AB, Boston Holding A/S and KIRKBI Burbo Extension Holding (UK) Limited, a fully-owned subsidiary of KIRKBI A/S.
Søren Thorup Sørensen Chief Executive Officer
Born: 1965
Education: MSc in Accounting and Audit from Copenhagen Business School. State Authorised Public Accountant
Career and positions
1987-2006 KPMG, Partner 2006-2009 A. P. Møller-Mærsk, CFO 2010- KIRKBI A/S, CEO
Other management positions
Member of the Board of LEGO A/S, Falck A/S, Merlin Entertainments plc, Ole Kirk’s Foundation, Koldingvej 2, Billund A/S, Boston Holding A/S (chairman) and five fully-owned subsidiaries of KIRKBI A/S
ANNUAL REPORT 2018 | 29 | LEADERSHIP TEAM PART 1

| 30 | ANNUAL REPORT 2018 PART 1 BUSINESS AREAS
BUSINESS AREAS
CONTENTS
Strategic Activities
LEGO Brand Group
The LEGO Group
Merlin Entertainments plc
Other Strategic Activities
Renewables Investment Portfolio
Investment Activities
Long-term Equity Investments
Real Estate Investments

32
34
36
38 LEGO Ventures
ANNUAL REPORT 2018 | 31 | BUSINESS AREAS PART 1
41
42
45
47
LEGO BRAND GROUP
The purpose of LEGO Brand Group is to protect, develop and leverage the full potential of the LEGO® brand and to ensure active and engaged family ownership of the LEGO branded entities through generations.
The LEGO brand, driven by the LEGO Group, has developed rapidly. Over the past decades, the LEGO Group has expanded its global presence and the LEGO brand has become not only a well-known but a highly trusted and strong brand across global markets.
In addition, the LEGO brand is a part of a larger ecosystem of brands due to partnerships and licensed agreements, which makes the brand more exposed than ever and more and more strategic opportunities arise.
In light of the development of the LEGO brand, the LEGO Brand Group works to ensure that the future of the LEGO brand is managed with care and that the LEGO brand remains true to the Kirk Kristiansen family’s overall mission to inspire and develop the builders of tomorrow.
LEGO Brand Group exercises the owner-governance of the LEGO brand primarily through the boards of the relevant entities.
The 2032 LEGO brand Strategy
In 2018, KIRKBI, LEGO Brand Group and the Kirk Kristiansen family made important decisions about the future of the LEGO brand. During the year, LEGO Brand Group took stock at where the brand is today and finalised a strategy process that explored the brand through four lenses:
• The owner’s vision and mentality
• Brand observations
• Insights and trends
• External stimulus
From these four lenses, six distinct potential ways of radically stretching the brand were identified and explored. In developing
these distinct ”Brand Directions”, it became clear that especially the idea around ‘The Playful Learning Brand’ held deep truth: The underlying data indicated that play, and LEGO® Play, is more relevant than ever, that creative skills and creative expression are highly sought after at all ages – however difficult to attain in some markets and geographies, and that there is a deep societal need to re-think and re-invigorate how to go about learning and education.
So, while beginning with distinct insights, trends and opportunities, one clear red thread and conclusion was ultimately found: The LEGO® Idea Paper, an internal document which describes the original LEGO® Idea, with its play, creativity and learning proposition is unique and more relevant than ever. Fully delivering on this core idea represents an opportunity to make a difference for children and families across the world, today and in the future, which the Kirk Kristiansen family hold firmly in their hearts.
Based on the brand strategy process, the owner’s vision for the LEGO brand in 2032, is to be:
A global force for establishing and innovating Learning-through-Play
Global, because the Kirk Kristiansen family wants to reach every child in the world. A force, because the family wants to make a true difference in children’s lives, which requires a push and leadership. Establishing, because the family recognises that the journey has only just begun, and the importance of Learningthrough-Play is not yet fully established. Innovating, because the LEGO brand and society as such constantly learn about new ways of learning-through-play and finally,
The LEGO Brand Group is managed in a partnership between Jørgen Vig Knudstorp (Executive Chairman) and Thomas Kirk Kristiansen (Deputy Chairman) together with a small team.
Learning-through-Play, which is the Kirk Kristiansen family’s philosophy reflecting their strong belief that the best way for children to grow and develop is through play.
With such bold ambitions – to reach all children in the world – the vision almost has an endless time horizon. The year 2032 is chosen because it marks the 100-year anniversary of the LEGO Group, but in reality, the vision expresses a task, which will not finish in this generation or the next.
The LEGO branded entities are very separately driven entities with individual strategies and expertise. On a few things, however, the Kirk Kristiansen family believes there should be alignment and synergy across the separately run entities.
The 2032 LEGO Brand Strategy is rooted in the shared mission and the vision, showing what specifically requires shared and aligned activities for the brand across the separately run entities and what the entities must succeed with together.
There are at least six different ways to characterise this LEGO brand alignment – reflecting: What is it actually we mean when we say that our mission is to “Inspire and develop the builders of tomorrow”? How will all stakeholders perceive the LEGO brand in 2032?
These are the six brand characteristics for the 2032 LEGO brand:
| 32 | ANNUAL REPORT 2018 PART 1 LEGO BRAND GROUP
DELIVERING ESSENTIAL LIFE SKILLS FOR THE 21ST CENTURY
The LEGO® brand represents a set of skills that are critical to successfully navigate and thrive in an uncertain, fast paced and ever changing world: creativity, curiosity, critical thinking, collaboration and engagement
A UNIFIED ECOSYSTEM OF TOUCHPOINTS
The LEGO® brand offers immersive and fully integrated experiences across all touchpoints. This allows fans to pursue their passion points in an unbroken and frictionless fashion wherever and whenever they engage with the brand
PERSONALISING PLAY
The LEGO® brand engages all individuals with a childlike curiosity based on our ability to personalise and adapt all interactions to skill and affinity levels
COMMITMENT TO SUSTAINABILITY
The LEGO® brand is in a leading position in terms of running a zero-impact operation. This cuts across energy consumption, waste management, sustainable materials and circular use of products

DIGITAL PLAY IS A NEW CORNERSTONE – SAFE & ROOTED IN THE BRICK
The LEGO® brand provides a safe, meaningful refuge for children in the digital landscape where children can actively engage in shared creativity and creation with offset in the LEGO® brick
DEEP SOCIAL ENGAGEMENT FOR FAMILIES AND CHILDREN
The LEGO® brand brings people together to play across cultural, geographical and generational boundaries and works to ensure children’s access to learn and develop through play
ANNUAL REPORT 2018 | 33 | LEGO BRAND GROUP PART 1
IN 2032 THE LEGO® BRAND WILL BE KNOWN FOR…
THE LEGO GROUP
ABOUT THE LEGO GROUP
Based on the world-famous LEGO® brick and the philosophy of Learning-throughPlay, the LEGO Group provides unique play experiences for children of all ages.
LEGO bricks are part of the LEGO System in Play, which essentially means that the bricks can easily be combined in innumerable ways – and just as easily be dismantled. The combination of a structured system, logic and endless possibilities encourages the child to unlimited creativity.
Through creative play, the LEGO Group aims to inspire and develop the builders of tomorrow and nurture the skills to help future generations thrive and develop – skills such as creativity, problem solving, self-awareness and empathy – all necessary for children to build the world of tomorrow.
The LEGO Group was founded by the Kirk Kristiansen family in 1932 and has ever since then been headquartered in Billund, Denmark. Production facilities are located in Denmark, the Czech Republic, Hungary, China and Mexico, and the company has main offices in Enfield, USA, London, UK, Shanghai, China, and Singapore.
The LEGO Group is owned 75% by KIRKBI A/S, and the remaining 25% is owned by the LEGO Foundation through Koldingvej 2, Billund A/S.
HIGHLIGHTS FOR 2018
In 2018, the LEGO Group celebrated the 60th anniversary of the LEGO brick. While physical play remains the core for the LEGO Group, the company will continue to invest in innovative, fun and safe ways to integrate the brick with possibilities of digital play. The company also introduced the first elements made from plant-based plastics and pledged to use 100 percent sustainable packaging by 2025.
2018 was also a defining year for the toy industry. Disruption in retail channels and increasing digitalisation reshaped the landscape.
The LEGO Group stabilised its business during 2018 and increased revenue by 4% to DKK 36.4 billion. Excluding the impact of foreign currency exchange, revenue for the full year increased 7% compared with 2017.
All established market groups delivered single-digit revenue growth in 2018, while China achieved double-digit revenue growth.
The LEGO Group’s profit before tax amounted to DKK 10.5 billion in 2018 against DKK 10.2 billion the year before, an increase of 3%.
Cash flow for the year continues to remain strong, delivering an operating cash flow of DKK 9.8 billion against DKK 10.7 billion in 2017.
Investments of DKK 1.5 billion were made in expanding the LEGO Group’s production facilities to meet future demand for LEGO products. In 2019, the LEGO Group expects that revenue will grow low single-digits.
CEO
Niels B. Christiansen, President and Chief Executive Officer
EXECUTIVE LEADERSHIP TEAM
Niels B. Christiansen, President and Chief Executive Officer
Marjorie Lao, Chief Finanical Officer
Julia Goldin, Chief Marketing Officer
Loren I. Shuster, Chief People Officer
Carsten Rasmussen, Chief Operations Officer
Ulrik Gernow, Chief Business Transformation Officer
Claus Flyger Pejstrup, Senior Vice President
Skip Kodak, Senior Vice President
Victor Saeijs, Senior Vice President
BOARD OF DIRECTORS
Jørgen Vig Knudstorp, Executive Chairman
Thomas Kirk Kristiansen, Deputy Chairman Eva Berneke
Kjeld Kirk Kristiansen
Jan Thorsgaard Nielsen
Kåre Schultz
Søren Thorup Sørensen
Ole Kirk Kristiansen, Founder of the LEGO Group
| 34 | ANNUAL REPORT 2018 PART 1 THE LEGO GROUP
FINANCIAL HIGHLIGHTS

ANNUAL REPORT 2018 | 35 | THE LEGO GROUP PART 1
(m DKK) 2018 2017 Revenue 36,391
Operating profit
Profit for the year
Equity 21,753
Cash flow from operating activities
Investments
Average number of employees
5 YEARS’ PERFORMANCE (m DKK) Revenue 2014 2015 2016 2017 2018 Operating profit (EBIT) 0 10,000 20,000 30,000 40,000
34,995
10,774 10,359
8,076 7,806
20,714
9,847 10,691
(1,502) (1,529)
(FTE) 15,050 16,480
LEGO® plants from plants. In 2018, the LEGO Group introduced the first elements made from plant-based plastics and pledged to use 100% sustainable packaging by 2025.
Photo: The LEGO Group
MERLIN ENTERTAINMENTS PLC
ABOUT MERLIN ENTERTAINMENTS PLC
Merlin Entertainments plc is Europe’s leading and the world’s second-largest visitor attraction operator. At the end of December 2018, Merlin operated more than 120 attractions, 18 hotels and 6 holiday villages in 25 countries across four continents.
The aim for Merlin Entertainments is to create a high growth, high return, family entertainment company based on strong brands and a global portfolio that is naturally balanced against the impact of external factors. Merlin Entertainments delivers memorable experiences to 67 million visitors worldwide.
Merlin Entertainments operates through three operating groups: LEGOLAND® Parks, Resort Theme Parks and Midway Attractions, using a number of international brands including SEA LIFE, Madame Tussauds, the Dungeons, LEGOLAND Discovery Centres and The Eye.
Midway Attractions are predominantly indoor attractions located in city centres or resorts providing visits of shorter duration. Resort Theme Parks are standalone national brands generally aimed at families, teenagers and young adults.
The eight LEGOLAND resorts across Europe, USA and Asia offer a unique LEGO® themed experience for families with children often including highly themed accommodation and based on interactivity, imagination and family fun. Also, in the 20 LEGOLAND Discovery Centres across Europe, USA and Asia, families with young children are offered an indoor, interactive and immersive experience.
Merlin Entertainments plc is a listed company on the London Stock Exchange.
KIRKBI is a significant shareholder of Merlin Entertainments plc with a 29.6% interest.
HIGHLIGHTS FOR 2018
Merlin Entertainments saw a year of steady progress in 2018, reflecting a number of important strategic developments and continued organic growth.
Total number of visitors grew by 1.4% to 67 million and revenue grew organic by 5.2% in 2018 (52 weeks basis). Profit for the year increased by 10% to GBP 230 million due to incremental revenue, reduced finance costs and lower taxation offset by increased depreciation.
The strategy to expand the LEGOLAND parks footprint continued. Construction of the LEGOLAND New York resort began, LEGOLAND park number nine, with a planned opening in 2020. Furthermore, an agreement was reached with the local province for the funding of LEGOLAND Korea with planned opening in 2022.
The LEGOLAND parks revenue increased by 6.4%, driven by the opening of 644 new accommodation rooms at LEGOLAND Germany, LEGOLAND Japan and LEGOLAND California. Midway attractions saw revenue growth of 1.1% driven by continued roll out of new attractions and Resort Theme Parks grew with 9.1% due to successful new product offerings.
The number of LEGOLAND Discovery Centres increased during the year by two new Centres to a total number of 20 LEGOLAND Discovery Centres. The new openings were in Birmingham (UK) and Columbus (US).
BOARD OF DIRECTORS
Sir John Sunderland, Chairman
Nick Varney, CEO
Anne-Francoise Nesmes, CFO
Yun (Rachel) Chiang
Andrew Fisher (Joined in July 2018)
Andrew Fisher
Charles Gurassa
Fru Hazlitt
Ken Hydon (Retired in April 2018)
Trudy Rautio Søren Thorup Sørensen
LEGOLAND® Billund is the very first LEGOLAND park in the world. In 2018, the park turned 50 years and celebrated its 50 years anniversary with a party as well as a new rollercoaster and an upgrade of the park.
| 36 | ANNUAL REPORT 2018 PART 1 MERLIN ENTERTAINMENTS PLC
HIGHLIGHTS

ANNUAL REPORT 2018 | 37 | MERLIN ENTERTAINMENTS PLC PART 1
(m GBP) 2018 2017 Revenue 1,688 1,594 Underlying EBITDA 490 474 Profit for the year 230 209 Equity 1,739 1,563 Cash flow from operating activities 464 413 Visitors (millions) 67 66 Ownership of Merlin Entertainments plc 29.6 % 29.7 % KIRKBI’s share of profit for the year (m DKK) 567 522 Revenue EBITDA 0 500 1000 1500 2000 2014 2015 2016 2017 2018 5 YEARS’ PERFORMANCE (m GBP)
FINANCIAL
Photo: Merlin Entertainments plc

| 38 | ANNUAL REPORT 2018 PART 1 LEGO VENTURES
Photo: LEGO Group
LEGO VENTURES
LEGO Ventures explores investment opportunities at the intersection of Play, Learning and Creativity to leverage and develop the original LEGO® Idea and support the LEGO brand mission ‘to inspire and develop the builders of tomorrow’.
During 2018 LEGO Brand Group, KIRKBI and the Kirk Kristiansen family made important decisions about the future direction for the LEGO brand. Following a brand strategy process (read more at page 32), one clear red thread and conclusion was ultimately found: The LEGO® Idea, with its play, creativity and learning proposition is unique and more relevant than ever. Fully delivering on this core idea represents an opportunity to make a difference for children and families across the world, today and in the future.
During 2018, LEGO Ventures was established as a natural next step following the establishment of LEGO Brand Group. LEGO Ventures is founded on the belief that the LEGO Idea can be used for far more than we can presently imagine and the purpose of LEGO Ventures is to explore investment opportunities in the intersection of play, learning and creativity – opportunities, which leverage and develop the LEGO Idea and support the LEGO brand mission ‘to inspire and develop the builders of tomorrow’.
Investment approach
LEGO Ventures focuses on investment opportunities within four key spaces:
• Education Technology – Bringing playfulness into every classroom
• Life skills for the 21st Century – Prepping the heroes of tomorrow
• New Play Spaces - Rethinking play experiences for modern day realities
• Creative Making - Unleashing every child’s creative super powers
The LEGO Venture investments are managed by a dedicated in-house team.
2018 Highlights
In 2018, LEGO Ventures completed its first investments in an innovative additive manufacturing company, U.S.-based Evolve Additive Solutions, which has created multiple applications for 3D printing in manufacturing. Additive manufacturing has been used by the LEGO Group for many years to create more agile, cost-efficient production options. Evolve’s technology allows high-quality parts to be printed using materials similar to those
in the current portfolio as well as explore sustainable alternatives.
LEGO Ventures also acquired a stake in Swedish-based Peppy Pals, one of the first companies to create playful digital experiences designed to equip, strengthen and nurture children’s social and emotional skills.
In addition, LEGO Ventures completed an investment in a Silicon Valley based venture firm, with the primary aim being to gain access to emerging technologies.
LEGO Ventures explores opportunities at the intersection of play, learning and creativity to leverage and develop the original LEGO® Idea.
LEARNING CREATIVITY
ANNUAL REPORT 2018 | 39 | LEGO VENTURES PART 1
LEGO VENTURES
PLAY

| 40 | ANNUAL REPORT 2018 PART 1 RENEWABLES
RENEWABLES
Renewables is a strategic activity for the KIRKBI Group. Through investments in Renewables, KIRKBI supports the LEGO Group’s commitment to balance global consumption of energy with renewable energy, while at the same time delivering attractive long-term returns.
ABOUT RENEWABLES
KIRKBI’s Renewables strategy targets direct minority investments in solar, onshore wind and offshore wind assets. The geographic focus is on Northern Europe and North America.
The KIRKBI Strategic Activities within Renewables currently consist of two offshore wind farms - Borkum Riffgrund 1 and Burbo Bank Extension.
In 2012, KIRKBI and William Demant Invest invested jointly in Borkum Riffgrund 1, with KIRKBI owning 31.5%. Ørsted has retained 50% ownership and has handled the construction and operations of the wind farm.
In 2016, KIRKBI and PKA invested jointly into Burbo Bank Extension with 25% ownership each and Ørsted retained 50% ownership and has handled the construction and operations of the wind farm.
KIRKBI is represented in the Board of Directors supporting the strategic development of the renewable assets.
HIGHLIGHTS FOR 2018
During 2018, the two wind farms Burbo Bank Extension and Borkum Riffgrund I delivered a stable financial return, despite a lower than expected wind resource throughout the year. Altogether, the KIRKBI share of the windfarms produced electricity corresponding to the electricity consumption of more than 114,000 households.
Late April, the process of divesting the offshore transmission assets (‘OFTO assets’) of Burbo Bank Extension was completed.
Burbo Bank Extension’s transmission assets have been built and operated by Ørsted until the divestment.
It has been the plan from the very beginning of our partnership to divest the transmission assets of the wind farm. The reason for this is that an investor in the UK renewables market is not legally allowed to own both the wind farm – the generation part - and the transmission assets.
ABOUT BURBO BANK EXTENSION
Burbo Bank Extension is located approximately 7 kilometres off the coast of Liverpool in the UK. The wind farm consists of
32 MHI Vestas 8 MW turbines with a total capacity of 258 MW and is capable of providing green energy to 230,000 UK households.
The wind farm was officially opened in May 2017.
ABOUT BORKUM RIFFGRUND 1 Borkum Riffgrund 1 is located in Germany, approximately 54 kilometres from shore and 37 kilometres from the island Borkum in the North Sea. The wind farm consists of 78 Siemens 4 MW turbines with a total capacity of 312 MW and is capable of providing green energy to 320,000 German households.
The wind farm was officially opened in October 2015.
LOCATION
Liverpool Hamburg Burbo Bank Extension
Borkum Riffgrund 1 London
FINANCIAL HIGHLIGHTS (m DKK)
2018 2017
Profit for the year 389 398 Cash flow from operation 616 609 Carrying amount 4,975 5,175
ANNUAL REPORT 2018 | 41 | RENEWABLES PART 1
INVESTMENT ACTIVITIES
The purpose of KIRKBI’s investment portfolio is to deliver long-term growth of capital through attractive risk-adjusted returns of our investments - ultimately, building a sound financial foundation to support the Mission and the KIRKBI Fundamentals.
PORTFOLIO OBJECTIVES
The investment portfolio is divided into long-term investments and financial investments, with the purpose of securing diversification as well as sufficient financial flexibility at all times. Based on a belief in value creation through long-term focus as well as a long-term illiquidity premium, we expect long-term equity investments to be a growing part of the total portfolio.
The investment portfolio is actively managed by a dedicated team within KIRKBI who delivers on the objectives through a set of guidelines, defining our investment approach to how we invest. Through investments and ownership, KIRKBI is:
• An ambitious and active business owner of the companies we invest in
• Long-term focused and value-driven
• Making investments and driving active ownership that live up to our responsibility approach
• Working with partners with high integrity and aiming to engage in long-term relationships with them, whenever partnerships contribute to mutual value creation
• Focusing on transparent investment structures in order to be comfortable with the underlying risk and return factors
RESPONSIBLE INVESTMENTS AND RESPONSIBLE OWNERSHIP
KIRKBI aspires to enable the Kirk Kristiansen family to succeed with the mission of inspiring and developing the builders of tomorrow through generations and to create a positive impact through responsible ownership and investments.
As such, environmental, social and governance factors are a fundamental part of assessing the attractiveness and performance of an investment. Not only in the due diligence phase but also as part of the ongoing ownership and monitoring of our businesses and investments as KIRKBI will exercise our rights and encourage companies to improve the management of material risks in order to protect our value and enhance long-term returns.
In addition to the assessment of ESG-factors, we exclude investments in certain industries such as tobacco, armament, gambling and adult entertainment. The investments are regularly screened for their compliance with international conventions and norms.
Read more about the Promises on page 18.
HIGHLIGHTS FOR 2018
In 2018, the consolidated investment activities yielded a negative return of DKK 0.9 billion and the investment portfolio ended at DKK 58.3 billion.
The portfolio return is affected by the turbulence and volatility in the financial markets where 2018 proved to be the year that became more treacherous as the global cycle matured and concerns about trade wars, Brexit, government and corporate debt levels causing declining company valuations within Long-term Equity and Quoted Equities.
Within Long-term Equity, the negative returns are mainly attributable to declining market valuations of Nilfisk A/S, Landis+Gyr and ISS A/S. Overall, the companies
deliver strong operations and cash flows and thus continue to represent attractive investments for KIRKBI. During 2018, KIRKBI completed the sale of all shares in Minimax Viking GmbH leaving KIRKBI a return of more than two times the initial investment.
In 2018, KIRKBI acquired one new investment property located in London (United Kingdom). The property is a former warehouse converted into modern offices of 4,100 m2 located in the King’s Cross area of London, which is let to a single tenant on a long-term lease contract. Furthermore, in line with the current investment strategy, KIRKBI exited the Czech market in 2018 by divesting the portfolio’s three Czech properties. In addition, KIRKBI completed significant asset management improvements in a Munich property (acquired in 2016) and signed an agreement to invest into a new property in Hamburg (closed in February 2019).
Within the Private Equity portfolio, an underlying strong year both driven by the preferred buyout funds and co-investments was fuelled by a strengthening of the USD. During 2018, we made one new commitment to a fund and made one new co-investment with our partners.
During 2018, KIRKBI decided to expand its focus within Renewables to include investments within both strategic assets and the investment portfolio. We believe that Renewables is an attractive and growing market, which we believe contributes to both KIRKBI’s financial ambitions as well as the Planet Promise and we wish to further explore investments within this area.
| 42 | ANNUAL REPORT 2018 PART 1 INVESTMENT ACTIVITIES
ACROSS THE PORTFOLIO, KIRKBI’S INVESTMENT OBJECTIVES ARE TO:
• Obtain attractive risk-adjusted returns and capital preservation for the long run
• Securing financial flexibility and liquidity for the Kirk Kristiansen family, the LEGO Group and other strategic assets
• Ensuring high environmental, social and governmental standards in KIRKBI investments
INVESTMENT PORTFOLIO AT YEAR-END (m DKK)
ALLOCATION OF INVESTMENT PORTFOLIO YEAR-END 2018
Long-term investments
Financial Investments
Long-term Equity
Real Estate
Private Equity
Oppotunities
Financial Investments
Developed Markets Emerging Markets Core Fixed Income Corporate Debt Other
50,000
40,000
30,000
20,000
10,000
60,000 2014 2015 2016 2017 2018
0,000
Investment portfolio
5 YEARS’ PERFORMANCE (m DKK)
5,000
4,000
3,000
2,000
1,000
0.000
(1.000)
2015 2014 2016 2017 2018
Operating profit from investment portfolio
FINANCIAL HIGHLIGHTS (m DKK) 2018 2017
Operating profit from investment activities (940) 4,000
ANNUAL REPORT 2018 | 43 | INVESTMENT ACTIVITIES PART 1
LONG-TERM EQUITY OWNERSHIP
It is a priority for the KIRKBI Group to grow the long-term equity ownership with an aim of acquiring significant minority stakes of high-quality companies with a long-term potential for growth and value creation.
ABOUT KIRKBI’S LONG-TERM EQUITY OWNERSHIP
KIRKBI’s investment strategy is focused on active ownership of significant minority stakes in high quality companies with a long-term potential for value creation. KIRKBI has a strategy of being represented on the boards of the companies we are co-owners of within Long-term Equity in order to be a strong owner and support the companies in relation to their long-term growth and ongoing development.
HOW WE ENGAGE AS ACTIVE OWNERS
Our primary focus areas as active owners of long-term equity ownership stakes are grouped into four categories:
1. Strategy
The company’s robustness and positioning for long-term growth
2. Financial discipline
The company’s efficiency around capital allocation and progress on selected KPIs
3. Governance
Ensuring that the right people and competencies are present on the board and management team as well as ensuring the company’s systems and procedures are at all times appropriate and supportive for the company’s long term development
4. Sustainability
Focusing on the company’s continuous improvements to ensure sustainable growth via continuous progress within environmental, social and governance areas.
HIGHLIGHTS FOR 2018
KIRKBI’s long-term equity portfolio amounts to DKK 11.5 billion end of 2018. During 2018, KIRKBI has increased its ownership position in both Landis+Gyr, Nilfisk A/S and ISS A/S and has completed the sale of all shares in Minimax Viking GmbH.
KIRKBI’S PORTFOLIO OF LONG-TERM EQUITY INVESTMENTS
Falck A/S
Falck’s activities are directed at preventing accidents and disease; providing assistance in situations of emergency, accidents and need. Falck has more than 32,000 employees and business activities in 31 countries. During 2018, Falck made significant progress on the turn-around strategy initiated in 2017, which means the company has improved profitability and cash collection and has divested non-core activities. Furthermore, Falck engaged in significant contracts within ambulance services in the US, UK and Europe.
In January 2019, Falck received a ruling for violating the Danish competition rules. Falck refrained from appealing the ruling to the Danish Competition Appeals Board and to the Danish court system. The case showed that what happened in parts of Falck in 2014/2015 was completely unacceptable and far from what KIRKBI expects from the companies, we are co-owners of. Falck is in a different place today and the new management as well as all employees work hard to complete the turnaround of the company and restore confidence in Falck.
KIRKBI owns 27.8% of Falck A/S.
ISS A/S
The ISS Group is one of the world’s leading Facility Services companies. ISS offers a wide range of services such as: Cleaning, Catering, Security, Property and Support Services as well as Facility Management. ISS has more than 488,000 employees and activities in more than 70 countries. During 2018, ISS announced a strategy update to strengthen the company’s global position and to increase organic growth.
KIRKBI owns 14.0 % of ISS A/S. (31.12.2018)
Nilfisk A/S
Nilfisk is a global market leader for professional cleaning equipment with sales in more than 100 countries and 16 production sites. Nilfisk offers an extensive portfolio of high quality products through the brands Nilfisk® and Viper.
KIRKBI owns 16.5% of Nilfisk. (31.12.2018)
Landis+Gyr
Landis+Gyr is the leading global provider of integrated energy management solutions for the utility sector. Offering one of the broadest portfolios of products and services to address complex industry challenges, the company delivers comprehensive solutions for the foundation of a smarter grid, including smart metering, distribution network sensing and automation tools, load control, analytics and energy storage. Landis+Gyr operates in over 30 countries across five continents. The company employs app. 6,000 people with the mission of helping the world manage energy better.
KIRKBI owns 15% of Landis+Gyr. (31.12.2018)
| 44 | ANNUAL REPORT 2018 PART 1 LONG-TERM EQUITY OWNERSHIP
Välinge
Välinge is a R&D and IP company with particular strength in wood-based technologies and the flooring and furniture industries. Founded in 1993, Välinge pioneered the concept of floating click floors, reducing the time and effort needed for floor installation as well as easing the environmental burden of glue used for installations in the past. The present technology base covers fields related to floor locking, furniture, surface materials and treatments, production processes and tools, digital printing and ink, and thermoplastic core materials.
KIRKBI owns 48.3% of Välinge. (31.12.2018)

ANNUAL REPORT 2018 | 45 | LONG-TERM EQUITY OWNERSHIP PART 1
Photo: Välinge
REAL ESTATE INVESTMENTS
The focus for the KIRKBI Group’s real estate investments is to maintain and increase the real estate portfolio with sound and high-quality properties with a long-term value potential.
ABOUT KIRKBI’S REAL ESTATE INVESTMENTS
In KIRKBI, we believe in value creation through a long-term focus, and thus, a growing real estate footprint is a strategic choice.
The focus for the KIRKBI Group in terms of real estate is to maintain and increase the real estate portfolio with sound and high-quality properties as well as looking at redevelopment opportunities with a long-term value potential, primarily within the office and retail sectors.
KIRKBI PRIMARILY INVESTS IN FIVE STRATEGIC LOCATIONS
KIRKBI’s current real estate strategy identifies five strategic locations for the future real estate investments:
• Copenhagen
• London
• Munich
• Hamburg
• The German speaking part of Switzerland
All real estate investments are evaluated based on their long-term potential, where both the return component and the environmental impact are of high importance.
KIRKBI’s focus on assessing and potentially improving the environmental footprint of the properties supports the Planet Promise to create a positive impact.
KIRKBI currently has a portfolio of 25 real estate investments located in Copenhagen and Billund (Denmark), London (Great Britain), Baar, Olten, Cham, Baden and Rapperswil (Switzerland), Munich and Hamburg (Germany). The total size of the portfolio by the end of 2018 measured more than 270,000 m2 of space.
HIGHLIGHTS FOR 2018
In 2018, KIRKBI acquired one new investment property located in London (United Kingdom). The property is a former warehouse converted into modern offices of 4,100 m2 located in the King’s Cross area of London, which is let to a single tenant on a long-term lease contract. In addition, KIRKBI signed an agreement to invest into a new property in Hamburg (closed February 2019).
In line with the current investment strategy, KIRKBI exited the Czech market in 2018 by divesting the portfolio’s three Czech properties – two properties in Prague and one in Kladno.
DID YOU KNOW?
The team behind KIRKBI Real Estate covers a dual portfolio – a core investment portfolio and a portfolio supporting the total KIRKBI Group’s activities in and around Billund. The properties outside the core investment portfolio typically cover buildings and building projects that support the vision of Billund as the Capital of Children as well as the Billund City Vision in terms of turning Billund into an even more attractive town to work and live in.
For example, KIRKBI is the builder and project manager on the construction of ‘LEGO Campus’, the new gathering point for the entire LEGO Group. LEGO Campus is placed in Billund, the Capital of Children, and it will be 54,000 m2 divided into eight connected buildings when completed in 2021. Read more about the Billund City Vision, Billund’s unique character as the Capital of Children and KIRKBI’s other real estate projects in Billund on page 16.
| 46 | ANNUAL REPORT 2018 PART 1 REAL ESTATE INVESTMENTS

ANNUAL REPORT 2018 | 47 | REAL ESTATE INVESTMENTS PART 1
Photo: C.F. Møller Architects

| 48 | ANNUAL REPORT 2018 PART 2 CONSOLIDATED FINANCIAL STATEMENTS
CONSOLIDATED FINANCIAL STATEMENTS
CONTENTS
PART 2 Consolidated financial statements
Consolidated income statement
Consolidated statement of comprehensive income
Balance sheet at 31 December
Statement of changes in equity

Cash flow statement 1 January – 31 December
PART 3 Notes – KIRKBI Group
PART 4 Parent Company
PART 5 Additional information
Management’s statement
Independent auditor’s report
50
51
52
54
55
57 Contents
88 Contents
ANNUAL REPORT 2018 | 49 | CONSOLIDATED FINANCIAL STATEMENTS PART 2
99
100
CONSOLIDATED INCOME STATEMENT
(m DKK)
Notes 2018 2017
LEGO Group 1) 2.3 10,510 10,201 Royalties 1) 1,400 1,346 Merlin activities 2.4 600 567 Trademark and administration costs 2.3 (269) (170) Operating profit from LEGO Brand Group activities 2.1, 2.2 12,241 11,944
Renewables 3.1, 3.2 389 398 Operating profit from strategic activities 12,630 12,342
Operating profit from investment activities 4.1, 4.2 (940) 4,000 Administration costs 2.3 (338) (340)
Total operating profit 11,352 16,002
Financial items (71) 42 Profit before tax 11,281 16,044
Tax on profit for the year 6.1 (2,600) (3,365) Profit for the year 8,681 12,679
Appropriation to Parent company shareholders 6,655 10,720 Non-controlling interests 9.4 2,026 1,959 8,681 12,679
1) Operating profit from the LEGO Group and royalties include royalty from the LEGO Group of DKK 1,314 million (2017 DKK 1,258 million)
| 50 | ANNUAL REPORT 2018 PART 2 CONSOLIDATED INCOME STATEMENT
CONSOLIDATED STATEMENT OF COMPREHENSIVE INCOME
(m DKK)
Notes 2018 2017
Profit for the year 8,681 12,679
OTHER COMPREHENSIVE INCOME
Items that may be reclassified to the income statement:
Exchange differences, foreign subsidiaries and associates (66) (592)
Net gain/(loss) on cash flow hedges (43) 153
Net gain/(loss) on cash flow hedges associates 2 9
Tax on entries directly in other comprehensive income 19 (31)
Items that will not be reclassified to the income statement:
Remeasurements of defined benefit plans 19 (3)
Other equity movements in associates (2) 5
Other comprehensive income for the year (71) (459)
Total comprehensive income 8,610 12,220
Appropriation to
Parent company shareholders 6,592 10,294
Non-controlling interests 9.4 2,018 1,926 8,610 12,220
ANNUAL REPORT 2018 | 51 | CONSOLIDATED STATEMENT OF COMPREHENSIVE INCOME PART 2
BALANCE SHEET AT 31 DECEMBER
ASSETS (m DKK)
Non-current assets
Notes 2018 2017
Goodwill, trademarks, patents and other intangible rights 7.3 1,955 1,963
Software 147 192 Development projects 93 71 Intangible assets 7.2 2,195 2,226
Property 7,183 7,010 Plant and equipment 8,111 8,711 Other fixtures, fittings, tools and equipment 1,937 2,090
Fixed assets under construction 3,243 1,972 Property, plant and equipment 7.4 20,474 19,783
Investment real estate 4.3 7,537 7,267 Investments in associates 2.4 4,454 4,090 Receivables from associates 658 598 Finance leases 2.5 1,372 1,298 Other investments 109 102 Prepayments 142 146
Deferred tax assets 6.2 630 582
Other non-current assets 14,902 14,083
Total non-current assets 37,571 36,092
Current assets
Inventories 5.1 2,716 2,493
Trade receivables 5.2 6,929 6,520 Other receivables 2,431 2,135
Assets held for sale - 489
Prepayments 253 148
Current tax receivables 633 164
Securities 4.4 49,983 45,648 Cash 2,616 1,767
Total current assets 65,561 59,364
TOTAL ASSETS 103,132 95,456
| 52 | ANNUAL REPORT 2018 PART 2 BALANCE SHEET AT 31 DECEMBER
EQUITY AND LIABILITIES (m DKK)
EQUITY
Notes 2018 2017
Share capital 9.3 200 200 Retained earnings 82,314 76,105 KIRKBI Group’s share of equity 82,514 76,305
Non-controlling interests 9.4 5,553 5,285 Total equity 88,067 81,590
LIABILITIES
Non-current liabilities Borrowings 1,932 2,418 Deferred tax liabilities 6.2 979 978 Pension obligations 9.5 161 184 Provisions 5.4 338 298 Other long-term liabilities 5.3 232 178
Total non-current liabilities 3,642 4,056
Current liabilities Borrowings 1,904 1,360 Trade payables 3,497 3,014 Current tax liabilities 336 375 Provisions 5.4 58 226 Other short-term liabilities 5.3 5,628 4,835
Total current liabilities 11,423 9,810
Total liabilities 15,065 13,866
TOTAL EQUITY AND LIABILITIES 103,132 95,456
ANNUAL REPORT 2018 | 53 | BALANCE SHEET AT 31 DECEMBER PART 2
STATEMENT OF CHANGES IN EQUITY
(m DKK)
Share capital
Retained comprehensive income
KIRKBI Group’s share of equity
Noncontrolling interests Total equity
Balance at 1 January 2018 200 76,105 76,305 5,285 81,590
Profit for the year – 6,655 6,655 2,026 8,681 Other comprehensive income for the year – (63) (63) (8) (71) Total comprehensive income for the year – 6,592 6,592 2,018 8,610
Acquisition of non-controlling interests – – – – –Equity-settled share-based transactions in associates – 17 17 – 17 Dividend – (400) (400) (1,750) (2,150)
Balance at 31 December 2018 200 82,314 82,514 5,553 88,067
Balance at 1 January 2017 200 66,207 66,407 5,105 71,512
Profit for the year – 10,720 10,720 1,959 12,679 Other comprehensive income for the year – (426) (426) (33) (459) Total comprehensive income for the year – 10,294 10,294 1,926 12,220
Acquisition of non-controlling interests – – – 6 6 Equity-settled share-based transactions in associates – 4 4 – 4 Dividend – (400) (400) (1,752) (2,152)
Balance at 31 December 2017 200 76,105 76,305 5,285 81,590
| 54 | ANNUAL REPORT 2018 PART 2 STATEMENT OF CHANGES IN EQUITY
CASH FLOW STATEMENT 1 JANUARY – 31 DECEMBER
(m DKK)
Notes 2018 2017
Profit before tax 11,281 16,044
Income tax paid (3,155) (2,701)
Reversals of items with no effect on cash flows 5.5 1,789 (2,406)
Changes in working capital 5.6 1,276 (684)
Cash flows from operating activities 11,191 10,253
Acquisition of securities, net (5,309) (5,611)
Acquisition of intangible assets (57) (143)
Sale of property, plant and equipment 424 48
Acquisition of property, plant and equipment (2,818) (2,281)
Cash flows from investing activities (7,760) (7,987)
Dividend paid to shareholders (400) (400)
Dividend paid to non-controlling interests (1,750) (1,752)
New borrowings 316 579
Repayments of borrowings (748) (540)
Cash flows from financing activities (2,582) (2,113)
Net cash flows for the year 849 153
Cash and cash equivalents at 1 January 1,767 1,614
Cash and cash equivalents at 31 December 2,616 1,767
Accounting policies
The consolidated cash flow statement shows cash flows for the year broken down by operating, investing and financing activities, changes for the period in cash and bank overdrafts and cash and bank overdrafts at the beginning of the year.
Cash flows from operating activities are calculated indirectly as the profit for the year adjusted for non-cash items, income taxes paid and changes in working capital.
Cash flows from investing activities comprise payments relating to acquisitions and disposals of
securities, intangible assets, property, plant and equipment, fixtures and fittings as well as fixed asset investments.
Cash flows from financing activities comprise proceeds from borrowings, repayment of interest-bearing debt and dividend paid to shareholders and non-controlling interests.
Cash and cash equivalents comprise cash and bank overdrafts etc. that can readily be converted into cash reduced by short-term bank debt.
ANNUAL REPORT 2018 | 55 | CASH FLOW STATEMENT 1 JANUARY – 31 DECEMBER PART 2

| 56 | ANNUAL REPORT 2018 PART 3 THE KIRKBI GROUP
THE KIRKBI GROUP
CONTENTS
PART 3 Notes – The KIRKBI Group
Section 1 – Basis for preparation 58 1.1 Significant accounting estimates and judgements 58 1.2 Basis of reporting
Section 2 – LEGO Brand Group activities 60 2.1 Definition of LEGO Brand Group activities 60 2.2 Revenue 61 2.3 Expenses by nature 61 2.4 Investment in associates 62 2.5 Finance leases
Section 3 – Renewables 63 3.1 Definition of Renewables 63 3.2 Joint arrangements
Section 4 – Investment activities 64 4.1 Definition of investment activities 64 4.2 Operating profit from investment activities 65 4.3 Investment real estate 66 4.4 Securities
Section 5 – Working capital 68 5.1 Inventories 68 5.2 Trade receivables 69 5.3 Other liabilities 70 5.4 Provisions
70 5.5 Reversals of items with no effect on cash flows 70 5.6 Changes in working capital
Section 6 – Taxes 71 6.1 Income tax expense 72 6.2 Deferred tax
Section 7 – Intangible assets and property, plant and equipment 73 7.1 Depreciation and amortisation 74 7.2 Intangible assets 75 7.3 Impairment test 75 7.4 Property, plant and equipment
Section 8 – Risk management
77 8.1 Contingent assets, liabilities and other obligations 77 8.2 Financial risks 78 8.3 Derivative financial instruments 79 8.4 Financial assets and liabilities
Section 9 – Other notes 80 9.1 Employee expenses 81 9.2 Auditors fee 81 9.3 Share capital 82 9.4 Non-controlling interests 82 9.5 Pension obligations 83 9.6 Related party transactions 83 9.7 Post balance sheet events 84 9.8 Group structure
PART 4 Parent Company 87 Contents
PART 5 Additional information 97 Contents
ANNUAL REPORT 2018 | 57 | THE KIRKBI GROUP PART 3
SECTION 1 – BASIS FOR PREPARATION
1.1. SIGNIFICANT ACCOUNTING ESTIMATES AND JUDGEMENTS
When preparing the annual report, it is necessary that management makes a number of accounting estimates and judgements that affect the reported amounts of assets and liabilities and the reported amounts of revenues and expenses.
Estimates and judgements used in the determination of reported results are continuously evaluated.
Management bases the judgements on historical experience and other assumptions that management assesses are reasonable under the given circumstances. Actual results may differ from these estimates under different assumptions or conditions.
The following accounting estimates and judgements are those which management assesses to be material for the annual report.
Investment in associates
The KIRKBI Group’s investment in entities in which it has significant influence, is accounted for using either the equity method or fair value through profit and loss depending on the classification of each single entity.
Entities, in which the KIRKBI Group has significant influence and which are considered a strategic activity are accounted for using the equity method. Based on this judgement for instance Merlin Entertainments plc is accounted for using the equity method.
Entities, in which the KIRKBI Group has significant influence, which are defined as an investment activity (Long-term equity) are accounted for using fair value through the income statement and accounted for in accordance with IFRS 9, which goes for the investments in Falck A/S and Välinge Group AB.
Please refer to the KIRKBI Group Structure for a complete overview of which companies are accounted for using the equity method and which
1.2. BASIS OF REPORTING
The consolidated financial statements of the KIRKBI Group have been prepared in accordance with International Financial Reporting Standards (IFRS) as adopted by the EU and additional Danish disclosure requirements.
EFFECTS OF NEW AND AMENDED ACCOUNTING STANDARDS
All amended standards and interpretations issued by IASB and endorsed by the EU effective as of 1 January 2018 have been adopted by the KIRKBI
companies are accounted for using fair value through the income statement.
It is management’s assessment that the assumptions are reasonable.
Unquoted Long-term Equity
Valuation of unquoted Long-term equity investments is based on estimates and assumptions as regards the fair value of each individual company. The fair value is estimated using a valuation model based on relevant multiples of a set of comparable companies, pro-forma adjusted operating income and adjusted net interest bearing debt. The valuation is performed by internal portfolio managers.
The most subjective parameter in the valuation model is the multiples from comparable companies. If the multiples were reduced by 1.0x point, it would have a negative effect on profit before tax of around DKK 355 million, which is described in note 4.4.
It is management’s assessment that the assumptions and estimates are reasonable.
Real Estate investments
Within other non-current assets the valuation of Investment real estate requires estimates and judgements on future cash flows, yields and market values for similar properties. The most subjective parameter is the yield used in the calculation. If the yield in the calculations increases by 1% point, the impact on profit before tax would be negative with around DKK 1,364 million. Please refer to note 4.3 for a description of the impact on each geografical area. It is management’s assessment that the estimates are reasonable.
Group. From 1 January 2018, the KIRKBI Group has adopted the below standards and interpretation with no significant impact on recognition and measurement:
* IFRS 9 Financial instruments
* IFRS 15 Revenue from contracts with customers
* IFRIC 22 Foreign currenty transactions
PART 3 NOTES – KIRKBI GROUP | 58 | ANNUAL REPORT 2018
IFRS 9 Financial instruments
The KIRKBI Group has adopted IFRS 9 Financial instruments using 1 January 2018 as the date of initial application. The adoption of IFRS 9 has had an insignificant impact on the Consolidated Financial Statements.
IFRS 15 Revenue from contracts with customers
The KIRKBI Group has adopted IFRS 15 Revenue from contracts with customers using the modified retrospective approach with 1 January 2018 as the date of initial application. The adoption of IFRS 15 has had an insignificant impact on the Consolidated Financial Statements.
IFRS 16 Leases
The KIRKBI Group has not yet applied IFRS 16, Leases which will be effective from 1 January 2019.
Management has in all material respect concluded analysis of the impending changes resulting from the new standards. The key findings are explained below.
Management has performed an initial investigation of the impact on the Consolidated Financial Statements upon adoption of IFRS 16. Based on the contractual obligations at 31 December 2018, an increase in total assets and total liabilities 2 billion is expected at 1 January 2019. The adaption of IFRS 16 is not expected to have a significant impact on the Income Statement.
CONSOLIDATION PRACTICE
Subsidiaries are fully consolidated from the date on which control is transferred to the KIRKBI Group. They are de-consolidated from the date on which control ceases.
Associates are all entities over which the KIRKBI Group has significant influence, but which it does not control, and are generally represented by a shareholding of between 20% and 50% of the voting rights. Associates classified as strategic investments are accounted for using the equity method of accounting and are initially recognised at cost. Assoicates classified as investments are valuated using fair value through profit and loss (IFRS 9).
The KIRKBI Group’s share in joint operations is recognised in the consolidated balance sheet through recognition of the KIRKBI Group’s own relative share of assets, liabilities, income and expenses.
Intercompany transactions, balances and unrealised gains on transactions between group companies are eliminated. Unrealised losses are also eliminated unless the transaction provides evidence of impairment of the asset transferred. Subsidiaries’ accounting policies have been changed where necessary to ensure consistency with the policies adopted by the KIRKBI Group.
Non-controlling interests include third-party shareholders’ share of equity and the results for the year in subsidiaries which are not 100% owned.
The part of the subsidiaries’ results that can be attributed to non-controlling interests forms part of the profit or loss for the year. Non-controlling interests’ share of equity is stated as a separate item in equity.
Amounts and qualitative information that are considered unimportant for the accounting user are omitted.
FOREIGN CURRENCY TRANSLATION
Functional and presentation currency
Items included in the financial statements of each of the KIRKBI Group’s entities are measured using the currency of the primary economic environment in which the entity operates. The consolidated financial statements are presented in Danish kroner (DKK), which is the functional and presentation currency of the Parent Company.
Transactions and balances
Foreign currency transactions are translated into the functional currency using the exchange rates prevailing at the dates of the transactions. Foreign exchange gains and losses resulting from the settlement of such transactions and from the translation at balance sheet date exchange rates of monetary assets and liabilities denominated in foreign currencies are recognised in the income statement, except when deferred in equity as reserve for exchange rate adjustments.
Group companies
The results and financial position of subsidiaries that have a functional currency different from the presentation currency are translated into the presentation currency as follows:
• Assets and liabilities for each subsidiary are translated into DKK at the closing rate at the balance sheet date.
• Income and expenses for each subsidiary are translated at average exchange rates.
• Differences deriving from translation of the foreign subsidiaries’ opening equity to the exchange rates prevailing at the balance sheet date, and differences owing to the translation of the income statements of the foreign subsidiaries from average exchange rates to balance sheet date exchange rates are recognised in other comprehensive income.
NOTES – KIRKBI GROUP PART 3 ANNUAL REPORT 2018 | 59 |
SECTION 2 – OPERATING PROFIT FROM LEGO BRAND GROUP ACTIVITIES
2.1. DEFINITION OF LEGO BRAND GROUP ACTIVITIES
LEGO Brand Group activities are defined as activities around the LEGO® brand, which inlude ownership of the LEGO Group, trademark royalties, LEGO Ventures
Accounting policies
Net profit before tax from LEGO A/S, a company in which the KIRKBI Group has significant influence, is fully consolidated into the Operating profit from the LEGO Group.
Merlin Entertainments plc, in which KIRKBI owns 29.6%, is accounted for using the equity
activities and ownership of and assets leased to Merlin Entertainments plc as owners of the LEGOLAND® parks and LEGOLAND Discovery Centres.
method. Changes to the carrying amount of the investment are charged into operating profit from Merlin activities. Assets owned by the KIRKBI Group and leased to Merlin Entertainments plc are included in operating profit from Merlin activities.
2.2. REVENUE
(m DKK) 2018 2017
Sale of play materials 35,882 34,383 License income 509 612 Trademark royalties 1,400 1,346 Total revenue from LEGO Brand Group activities 37,791 36,341
Sale of goods and services 423 409 Revenue from Renewables 806 770 Rental income 529 502 Total revenue for the KIRKBI Group 39,549 38,022
Accounting policies
Revenues from the sale of goods are recognised when control over the goods has been transferred to the buyer. This condition is usually met by the time the products are delivered to the customers.
Revenues are measured as the transaction price agreed with the customer excluding value added tax and after deduction of provision for returned products, rebates and trade discounts relating to the sale.
Provisions and accruals for rebates to customers are made in the period in which the related sales
are recorded. Historical data are readily available and reliable and are used for estimating the amount of the reduction in sales.
Licence fees are recognised on an accruals basis in accordance with the relevant agreements. Revenue are measured at the fair value of the consideration received or receivable.
Revenue from rental income is accrued to the financial year it covers.
PART 3 NOTES – KIRKBI GROUP | 60 | ANNUAL REPORT 2018
2.3. EXPENSES BY NATURE
(m DKK) 2018 2017
Raw materials and consumables 5,401 5,283 Employee expenses 6,482 6,676 Depreciation and amortisation 1,329 1,490
License and royalty expenses 2,689 2,583
Other external expenses 9,716 8,604
Trademark and administration costs 269 170
Total operating expenses from LEGO Brand Group activities 25,886 24,806
Administration costs 338 340
Total operating expenses from KIRKBI Group 26,224 25.146
Research and development costs charged during the year 822 550
2.4. INVESTMENTS IN ASSOCIATES
Investments in associates defined as strategic activities include the ownership of Merlin Entertainments plc. The KIRKBI Group has during 2018 sold its shares in KABOOKI A/S
(m DKK) 2018 2017
Cost at 1 January 2,573 2,573 Disposals (4) –Cost at 31 December 2,569 2,573
Value adjustment at 1 January 1,517 1,321 Exchange adjustment to year-end rate (55) (127) Dilution (10) (21)
Share of profit 567 522
Share of comprehensive income 54 10 Dividend (188) (188) Value adjustment at 31 December 1,885 1,517
Carrying amount at 31 December 4,454 4,090
General information on associates
Company name Merlin Entertainments plc
Country UK
Ownership / Votes 29.6 %
Functional currency GBP
Merlin Entertainments plc is listed on the London Stock Exchange. The investment has a carrying amount at 31 December 2018 of DKK 4,454 million
(2017 DKK 4,087 million) and a market value of DKK 7,955 million (2017 DKK 9,223 million).
NOTES – KIRKBI GROUP PART 3 ANNUAL REPORT 2018 | 61 |
Financial information of associates
(m DKK)
2018 2017
Revenue 13,960 13,393 Profit for the year 1,902 1,756
KIRKBI Group’s share of profit for the year 567 522
Total assets 31,154 30,728 Total equity 14,382 13,112
KIRKBI Group´s share of equity 4,264 3,900 Goodwill 190 190
Carrying amount of associates 4,454 4,090
Accounting policies
The KIRKBI Group’s investment in entities in which the group has significant influence is allocated to either strategic activities or investment activities. Please refer to section 1.1 for a description of significant accounting estimates and judgements.
Merlin Entertainments plc, which is allocated to the strategic activities are accounted for using the equity method. Under the equity method, investments in associates are initially recognised at cost. The carrying amount of the investment is adjusted to recognise changes in the share of the net assets of the associate since the acquisition date.
At each reporting date, the KIRKBI Group determines whether there is objective evidence that the investment in associate is impaired. If there is such evidence, the KIRKBI Group calculates the amount of impairment as the difference between the recoverable amount of the associate and its carrying value and then recognises the loss in the income statement.
The carrying amount of associated companies allocated to strategic activities is classified in the balance sheet as Other non-current assets.
2.5. FINANCE LEASES
(m DKK)
2018 2017
Repayment within 1 year 40 38
Repayment between 1 and 5 years 158 150
Repayment after 5 years 1,712 1,658
Gross investment in finance leasing: 1,910 1,846 Hereof unearned future finance income (538) (548)
Net Investment in finance lease 1,372 1,298
Repayment within 1 year 20 20
Repayment between 1 and 5 years 82 76
Repayment after 5 years 1,270 1,202
Net investment in finance lease 1,372 1,298
Accounting policies
KIRKBI’s leasing operations comprise solely of finance lease on property. A finance lease is reported as receivable from the lessee in the balance sheet at an amount equal to the net investment in the lease. The lease payment
excluding cost of services is recorded as repayment of principal and interest income. The income allocation is based on a pattern reflection a constant periodic return on the net investment outstanding in respect of the finance lease.
PART 3 NOTES – KIRKBI GROUP | 62 | ANNUAL REPORT 2018
SECTION 3 – RENEWABLES
3.1. DEFINITION OF RENEWABLES
KIRKBI has invested into renewable energy to support the LEGO Group’s commitment towards balancing their global consumption of energy with renewable energy, while at the same time delievering a long-
Accounting policies
Investments in the offshore windfarms Borkum Riffgrund 1 and Burbo Extention, both classified
3.2. JOINT ARRANGEMENTS
term return. KIRKBI has invested into two offshore windfarms, Borkum Riffgrund 1 and Burbo Bank Extension, in order to balance the consumption of energy in the LEGO Group.
as joint operations, are pro-rata consolidated into operating profit from strategic activities.
Profit from joint arrangements, pro-rata consolidated into the income statement as operating profit from strategic activities, covering: (m DKK) 2018 2017
Borkum Riffgrund 1 295 315 Burbo Bank Extension 94 83 Operating profit from joint arrangements 389 398
The operating profit from joint arrangements can be split into:
(m DKK) 2018 2017
Revenue 806 770 Operation costs (182) (146) Depreciation (227) (211) Financial items – (15) Special items (8) –Operating profit from joint arrangements 389 398
Non-current assets from joint arrangements: Property, plant and equipment 4,975 5,175
Accounting policies
The offshore windfarms Borkum Riffgrund 1 offshore Windpark A/S GmbH & Co. OHG and Burbo Extension Ltd. are companies whose legal form confers separation between the parties to the joint arrangement and the companies themselves. Furthermore, there are no contractual arrangements or any other facts and curcumstances that indicate that the parties of the respective joint arrangements have rights to the assets and obligations for the liabilities of the joint arrangement. However, there is a contractual arrangement that
secures the parties with control over the output from the joint arrangement. Accordingly, Borkum Riffgrund 1 offshore Windpark A/S GmbH & Co. OHG and Burbo Extension Ltd. are classified as joint operations in the KIRKBI Group, and consolidated on a pro rata basis.
Cost comprises acquisition price and estimated costs for decommisioning. Depreciation is calculated using the straight-line method to allocate the cost of each asset until decommisioning.
NOTES – KIRKBI GROUP PART 3 ANNUAL REPORT 2018 | 63 |
SECTION 4 –
OPERATING PROFIT FROM INVESTMENT ACTIVITIES
4.1. DEFINITION OF INVESTMENT ACTIVITIES
The KIRKBI Group invests in mortage bonds, corporate debt, quoted equities, private equity, real estate and larger equity investments. These investments are managed by KIRKBI’s portfolio managers with
Accounting policies
The investment portfolio has been designated as financial assets at fair value through profit and loss as the portfolio is managed and evaluated on a fair value basis in accordance with the KIRKBI Group´s investment strategy. Securities are measured at fair value, which equals listed prices or internationally accepted valuation models for private equity. Realised and unrealised gains and losses (including unrealised foreign exchange rate gains and losses) are recognised in the income statement. Transactions are recognised at the trade date.
The KIRKBI Group’s investment in entities in which the group has significant influence is allocated to
the purpose of creating long-term value for the KIRKBI Group. KIRKBI’s investment portfolio amounts at year-end 2018 to DKK 58.3 billion (2017 DKK 53.6 billion).
either strategic activities or investment activities. Please refer to section 1.1 for a description of significant accounting estimates and judgements.
The entities Falck A/S and Välinge Group AB, both associated companies, are allocated to KIRKBI’s investment portfolio and thereby managed and evaluated on a fair value basis in accordance with the KIRKBI Group’s investment strategy. The investment portfolio are designated at fair value through the income statement and accounted for in accordance with IAS 28.
4.2. OPERATING PROFIT FROM INVESTMENT ACTIVITIES
Operating profit from investment avtivities consists of: (m DKK) 2018 2017
Net gain or loss on financial assets at fair value through profit and loss (2,642) 1,540 Realised net gain or loss on financial assets 1,256 2,159 Net income from Investment real estate (note 4.3) 446 301 (940) 4,000
The investment portfolio consists of the following items from KIRKBI’s balance sheet Investment real estate (note 4.3) 7,537 7,267 Receivables from associates 658 598 Securities (note 4.4) 49,983 45,648 Other receivables 84 59 58,262 53,572
PART 3 NOTES – KIRKBI GROUP | 64 | ANNUAL REPORT 2018
4.3. INVESTMENT REAL ESTATE
(m DKK) 2018 2017
Net income:
Rental income 366 374 Direct expenses (114) (85) Net result from operation 252 289
Fair value adjustments: Gain on disposals 50 –
Fair value adjustment for the year, net 63 213 Exchange adjustment to real estate for the year, net 81 (201) Fair value adjustments: 194 12
Net income from Investment real estate 446 301
Fair value:
Fair value at 1 January 7,267 6,371
Exchange adjustment to year-end rate 81 (201)
Additions, new real estates 397 826
Additions, improvement of existing real estate 93 58 Disposals (364) –
Fair value adjustment for the year, net 63 213 Fair value at 31 December 7,537 7,267
Investment properties are stated at fair value, using the following yields based on location: Yield 2018 Yield 2017
Effect of 1% point increase in yield (mDKK)
5.75 - 9.00 % 5.75 - 9.00 % (11) Copenhagen, Denmark 4.00 - 5.25 % 4.00 - 5.25 % (256)
Billund, Denmark
London, UK
4.50 - 5.25 % 4.50 - 4.75 % (311) Prague and Kladno, Czech Republic n/a 6.00 - 8.75 % –
Baar, Switzerland 4.25 - 5.00 % 4.50 - 5.00 % (387) Hamburg, Germany 5.25 % 6.00 % (28) Munich, Germany 3.75 - 4.25 % 4.00 - 4.50 % (371) (1,364)
NOTES – KIRKBI GROUP PART 3 ANNUAL REPORT 2018 | 65 |
Accounting policies
Investment real estate is measured initially at cost, including transaction costs. Subsequent to initial recognition, investment properties are stated at the expected fair values from a net cash transaction at the balance sheet date.
Fair value is determined by management using approved valuation methods based on the capital value calculated on expected cash flows. If current market prices for comparable properties are available, these will be incorporated as part of the fair value valuation.
Gains or losses arising from changes in the fair values of investment properties are included in the income statement in the period in which they arise.
Valuation method:
The fair value is assessed by the KIRKBI Group’s real estate team at year-end on the basis of a return-based model. Valuations rely substantially on non-observable input and are based on cash flow estimates and on the required rate of return (yield) calculated for each property that reflects the price at which the property can be exchanged between
knowledgeable, willing parties under current market conditions. The cash flow estimates are determined on the basis of the market rent for each property. The required rate of return (yield) on a property is dertermined on the basis of its location, type, possible uses, layout and condition as well as on the terms of lease agreements, rent adjustment and the credit quality of lessees.
The return-based model used is:
4.4. SECURITIES
Securities consists of mortage bonds, corporate debt, quoted equities, private equity and investments in associated companies. Associated companies classified as investment activities and included in Securities are listed in note 9.8. Securities can be purchased and sold in established markets.
All securities and investments recognised under Securities are classified as “financial assets at fair value through profit or loss” are reported at fair value by level of the following fair value measurement hierarchy for:
(m DKK)
Liquid bonds
* Quoted prices (unadjusted) in active markets for identical assets (level 1)
* Inputs other than quoted prices included within level 1 that are observable for the assets either directly or indirectly (level 2)
* Inputs for the asset or liability that are not based on observable market data (level 3)
Specification of Securities into fair value measurement, currency allocation in DKK/EUR and % of investments rated:
Rental income + vacant rents - operating costs such as taxes, insurances and utilities - maintenance - administration = Net cash flow / Yield = Capitalised fair value - vacant rents + Deposits +/- corrections for known circumstances = Fair value 2018 Carrying amount
Level 1 100 % 100 % AAA 8,759 6,502
Corporate debt etc. Level 1 94 % 45 % inv. Grade 4,493 4,922
Quoted equities and long-term equity Level 1 50 % n/a 23,403 22,476
Private and unquoted long-term equity Level 3 26 % n/a 13,328 11,748
Carrying amount at 31 December 49,983 45,648
For descriptions of credit risk, and foreign exchange risk please refer to note 8.2, where risks from a group perspective are considered low.
Reconciliation of fair value of level 3 financial instruments
The KIRKBI Group carries unquoted equity as financial assets at fair value through profit and loss classified as level 3 within the fair value hierarchy.
PART 3 NOTES – KIRKBI GROUP | 66 | ANNUAL REPORT 2018
Fair value measurement hierarchy % of investment in DKK or EUR % of investments rated 2018 2017
Private and unquoted long-term equity (m DKK)
2018 2017
1 January 11,748 9,652
Total gains and losses recognised in profit and loss 1,800 1,158 Purchases 4,739 2,639 Sales (4,959) (1,701)
Carrying amount 31 December 13,328 11,748
Financial instruments, which are priced using non-observable input, include private placement in private equity funds and private placement in unquoted equities (Long-term Equity).
For Private Equity, valuation is based on IPEV (International Private Equity and Venture Capital Valuation Guidelines) valuations guidelines, which set out the principles for determining the price for which independent parties would trade the shares. The fair value would not vary significantly if one or more inputs were changed.
For unquoted equities (Long-term equity), valuation is based on a valuation model using input such as relevant multiples of a set of comparable companies, pro-forma adjusted operating income and adjusted net interest bearing debt.
Investments in unquoted Long-term equity are stated at fair value using a valuation model based on the following inputs:
2018 2017
Pro-forma adjusted operating income Individual Individual Multiples for comparable companies 13.9x - 16.7x 11.8x - 14.4x Adjusted net interest bearing debt Individual Individual
The most significant input for the valuation model is the multiples for comparable companies. If this multiple decreased by 1.0x, the fair value would be reduced by around DKK 355 million.
(m DKK)
For financial information about associates accounted for using fair value through profit and loss please see below;
Currency Share capital Profit for the year Equity KIRKBI ownership
Falck A/S DKK 67 (915) 1,876 27.7 % Väling Group AB (2017 financial information) SEK 0.147 43 2,388 48.3 %
Accounting policies
Securities are measured at fair value, which equals listed prices or internationally accepted valuation models for private equity. Realised and unrealised gains and losses (including unrealised foreign exchange rate gains and losses) are recognised in the income statement as operating profit from investment activities. Transactions are recognised at the trade date.
The entities Falck A/S and Välinge Group AB, both associated companies, are allocated to KIRKBI’s investment portfolio and thereby managed and evaluated on a fair value basis in accordance with the KIRKBI Group’s investment strategy. Securities are designated at fair value through profit or loss and accounted for in accordance with IAS 28.
NOTES – KIRKBI GROUP PART 3 ANNUAL REPORT 2018 | 67 |
SECTION 5 – WORKING CAPITAL
5.1. INVENTORIES
(m DKK)
2018 2017
Raw materials and components 163 90 Work in progress 1,139 1,063 Finished goods 1,414 1,340 2,716 2,493
The cost of inventory recognised as an expense in operating profit from the LEGO Group including write-down of inventories to net realisable value (expense)
Accounting policies
Inventories are measured at the lower of cost and net realisable value. Cost is determined using the first-in, first-out (FIFO) method.
The cost of raw materials, consumables and purchased goods comprises the invoice price plus delivery expenses. The cost of finished goods and
5.2. TRADE RECEIVABLES
(m DKK)
7,441 7,099 5 (11)
work in progress comprises the purchase price of materials and direct labour costs plus indirect production costs. Indirect production costs include indirect materials and wages, maintenance and depreciation of plant and machinery, factory buildings and other equipment as well as expenses for factory administration and management.
2018 2017
Trade receivables (gross) 7,762 7,106
Provisions for bad debts:
Balance at the beginning of the year (586) (373) Exchange adjustment to year-end rate (9) 26 Change in provisions for the year (247) (249) Realised losses for the year 9 10 Balance at the end of the year (833) (586)
Trade receivables (net) 6,929 6,520
All trade receivables fall due within one year. The nominal value is considered equal to the fair value of receivables falling due within one year from the balance sheet date.
The age distribution of gross trade receivables is as follows:
(m DKK)
2018 2017
Not overdue 6,844 6,654 0 - 60 days overdue 523 151 61 - 120 days overdue 34 233 121 - 180 days overdue 8 –More than 180 days overdue 353 68 7,762 7,106
PART 3 NOTES – KIRKBI GROUP | 68 | ANNUAL REPORT 2018
The KIRKBI Group has no single significant trade debtor, nor are the trade receivables concentrated in specific countries. The Group has fixed procedures
Accounting policies
Trade receivables are initially recognised at fair value and subsequently measured at amortised
5.3. OTHER LIABILITIES
for determining the Group’s granting of credit. The Group’s risk relating to trade receivables is considered to be moderate.
cost less provisions for bad debt. Provisions for bad debt are made on the basis of an individual assessment of the risk relating to each receivable.
(m DKK) 2018 2017
Liabilities related to wages and other charges
1,802 1,445 Other current liabilities 4,058 3,568 5,860 5,013
Specified as follows: Non-current 232 178 Current 5,628 4,835 5,860 5,013
Financial obligations
The fair value of obligations regarding assets under finance leases corresponds to the carrying amount. The fair value is estimated to equal the present
value of expected future cash flows at a market interest rate for similar leases.
(m DKK) 2018 2017
Obligations regarding finance leases are as follows: 0-1 year 7 8 1-5 years 4 10 > 5 years – –11 18
Reconciliation of carrying amount: Carrying amount of the liability 10 16 Interest expenses not yet accrued 1 2 11 18
Accounting policies
Other liabilities are measured at amortised cost unless specifically stated otherwise.
Borrowings are initially recognised at fair value, net of transaction expenses incurred. Borrowings are subsequently measured at amortised cost. Any differences between the proceeds and the
redemption value are recognised in the income statement over the period of the borrowings using the effective interest method.
Borrowings are classified as current liabilities unless the KIRKBI Group has an unconditional right to defer settlement of the liability for at least 12 months after the balance sheet date.
NOTES – KIRKBI GROUP PART 3 ANNUAL REPORT 2018 | 69 |
5.4. PROVISIONS
(m DKK)
2018 2017
Restructuring 1 194
Decommisioning windfarms 213 211
Other 182 119 Provisions at 31 December 396 524
Specified as follows:
Non-current 338 298 Current 58 226 396 524
Provision for decommisioning of windfarms relates to obligation to restore the areas with expected cash outflows more than 20 years from now.
Other provisions consist of various types of provisions, primarily provisions for asset retirement
Accounting policies
Provisions are recognised when the KIRKBI Group identifies legal or constructive obligations as a result of past events and it is probable that it will lead to an outflow of resources that can be reliably estimated. In this connection, the KIRKBI Group makes the estimate based upon an evaluation of the individual, most likely outcome of the cases. In cases where a reliable estimate cannot be made, these are disclosed as contingent liabilities.
regarding leased premises and employee related provisions comprising retirement packages and severance.
Further provisions for restructuring expenses are only recognised when the decision is made and announced before the balance sheet date. Provisions are not made for future operating losses. Provisions are measured at the present value of the estimated obligation at the balance sheet date.
5.5. REVERSALS OF ITEMS WITH NO EFFECT ON CASH FLOWS
(m DKK) 2018 2017
Depreciation, amortisation and impairment 1,649 1,647 Revaluation of securities etc. 725 (3,818) Net movements in provisions (151) 109 Net income from associates (434) (344) 1,789 (2,406)
5.6. CHANGES IN WORKING CAPITAL
(m DKK)
2018 2017
Inventories (223) 610
Trade and other receivables (321) (543)
Trade and other payables 1,820 (751) 1,276 (684)
PART 3 NOTES – KIRKBI GROUP | 70 | ANNUAL REPORT 2018
SECTION 6 – TAXES
6.1. INCOME TAX EXPENSE
(m DKK)
2018 2017
Current tax on profit for the year 2,522 3,176 Deferred tax on profit for the year 54 39
Effect of change in tax rate 3 82 Other 54 38
Prior year adjustments (33) 30 2,600 3,365
Income tax expenses are specified as follows: Calculated 22% (22%) tax on profit for the year before income tax 2,482 3,530
Tax effect of Higher/(lower) tax rate in subsidiaries 15 (17) Non-taxable income (773) (308) Non-deductible expenses 789 51
Effect of change in tax rate 3 82 Adjustment of tax relating to previous years (33) 30 Other 117 (3) 2,600 3,365
Effective tax rate 23.0 % 21.0 %
Accounting policies
The tax expenses for the period comprise current and deferred tax. Tax is recognised in the income statement, except to the extent that it relates to
items recognised in other comprehensive income. In this case, tax is also recognised in other comprehensive income.
NOTES – KIRKBI GROUP PART 3 ANNUAL REPORT 2018 | 71 |
6.2. DEFERRED TAX
(m DKK)
2018 2017
Deferred tax, net at 1 January (396) (180) Exchange adjustment to year-end rate 11 (39) Income statement charge 30 (60) Charged to other comprehensive income 10 (28) Effect of change in tax rate (3) (82) Other (1) (7) Deferred tax, net at 31 December (349) (396)
Classified as:
Deferred tax assets 630 582 Deferred tax liabilities (979) (978) (349) (396)
(m DKK)
2018
Deferred tax asset Deferred tax liability Deferred tax net
Non-current assets 105 (1,013) (908) Receivables 88 (1) 87 Inventories 248 (127) 121 Provisions 199 (1) 198 Other liabilities 172 (26) 146 Offset (189) 189 –Tax loss carry-forwards 7 – 7 630 (979) (349)
2017
Non-current assets 50 (952) (902) Receivables 85 (1) 84 Inventories 229 (128) 101 Provisions 187 - 187 Other liabilities 137 (21) 116 Offset (124) 124Tax loss carry-forwards 18 - 18 582 (978) (396)
Tax loss carry-forwards
Tax assets relating to tax loss carry-forwards are capitalised based on an assessment of whether they can be utilised in the future. DKK 7 million of the KIRKBI Group’s
Accounting policies
Deferred tax on temporary differences arising between the tax bases of assets and liabilities and their carrying amounts is provided in full in the consolidated financial statements, using the liability method.
Deferred tax reflects the effect of any temporary differences. To the extent calculated deferred tax is positive, this is recognised in the balance sheet
capitalised tax losses expires after 5 year (DKK 18 million in 2017 expires after 5 years).
as a deferred tax asset at the expected realisable value. Deferred tax assets are recognised only to the extent that it is probable that future taxable profits will be available against which the temporary differences can be utilised.
Any changes in deferred tax due to changes in tax rates are recognised in the income statement.
PART 3 NOTES – KIRKBI GROUP | 72 | ANNUAL REPORT 2018
SECTION 7 – INTANGIBLE ASSETS AND PROPERTY, PLANT AND EQUIPMENT
7.1. DEPRECIATION AND AMORTISATION
(m DKK) 2018 2017
Trademarks, patents and other intangible rights 11 13
Software 76 82
Property 261 383 Plant and equipment 1,083 1,102 Other fixtures, fittings, tools and equipment 282 274 1,713 1,854
In 2018, the KIRKBI Group did not recognise impairment losses on intangible assets (2017 DKK 0 million). On prop-
Accounting policies
Depreciation is calculated using the straight-line method to allocate the cost of each asset to its residual value over its estimated useful life as follows:
Buildings 25-50 years
Installations 10-20 years
Plant and machinery 2-25 years
Other fixtures, fittings, tools 3-10 years and equipment
erty, plant and equipment the KIRKBI Group recognised impairment losses of DKK 25 million (2017 DKK 146 million).
The residual values and useful lives of the assets are reviewed and adjusted, if appropriate, at each balance sheet date.
Gains and losses on disposals are determined by comparing the proceeds with the carrying amount and are recognised in the income statement.
NOTES – KIRKBI GROUP PART 3 ANNUAL REPORT 2018 | 73 |
7.2. INTANGIBLE ASSETS
2018 (m DKK)
Goodwill, trademarks, patents and other intangible rights Software Development projects Total
Cost at 1 January 2,164 516 71 2,751
Exchange adjustment to year-end rate 10 – – 10 Additions 3 – 54 57 Disposals – (70) – (70) Transfers – 32 (32) –Cost at 31 December 2,177 478 93 2,748
Amortisation and impairment losses at 1 January (201) (324) – (525) Exchange adjustment to year-end rate (10) (1) – (11) Amortisation for the year (11) (76) – (87) Disposals 70 – 70 Depreciation and impairment losses at 31 December (222) (331) – (553)
Carrying amount at 31 December 1,955 147 93 2,195
2017 (m DKK)
Goodwill, trademarks, patents and other intangible rights Software Development projects Total
Cost at 1 January 2,082 517 39 2,638
Exchange adjustment to year-end rate (26) (3) (1) (30) Additions 108 2 33 143 Transfers – – – –Cost at 31 December 2,164 516 71 2,751
Amortisation and impairment losses at 1 January (209) (247) – (456) Exchange adjustment to year-end rate 21 5 – 26 Amortisation for the year (13) (82) – (95) Amortisation and impairment losses at 31 December (201) (324) – (525)
Carrying amount at 31 December 1,963 192 71 2,226
Accounting policies
Goodwill, trademarks, patents and other intangible rights
Goodwill and trademarks are initially recognised in the balance sheet at cost and are not amortised.
Acquired patents and other intangible rights are capitalised on the basis of the costs incurred. These costs are amortised over the shorter of their estimated useful lives and the contractual duration.
The carrying amount of goodwill, trademarks, patents and other intangible rights is allocated to the cash generating assets at the acquisition date and is tested for impairment at that level.
Software and development projects
Research expenses are charged to the income statement as incurred. Software and development projects that are clearly defined and identifiable
and which are expected to generate future economic profit are recognised as intangible non-current assets at historical cost less accumulated amortisation and any impairment loss. Amortisation is provided on a straight-line basis over the expected useful life which is normally 5–10 years. Other development costs are recognised in the income statement. An annual impairment test of the intangible fixed assets under construction is performed.
Borrowing costs related to financing development projects that take a substantial period of time to complete and whose commencement date is on or after 1 January 2009 are included in the cost price.
Licences, patents and other rights
Acquired licences, patents and other rights are capitalised on the basis of the costs incurred. These costs are amortised over the shorter of their estimated useful lives and the contractual duration.
PART 3 NOTES – KIRKBI GROUP | 74 | ANNUAL REPORT 2018
7.3. IMPAIRMENT TEST
Impairment test of trademarks
Annual impairment test is carried out of the carrying amount of trademarks with indefinite useful lives. The impairment test in 2018 did not give rise to recognising any impairment losses.
The carrying amount of trademarks at 31 December is related to the cash-generating operational units and breaks down as follows:
Accounting policies
Assets that are subject to depreciation and amortisation are tested for impairment whenever events or changes in circumstances indicate that the carrying amount may not be recoverable. Intangible assets under development and intangible assets which are not subject to amortisation are tested for impairment at each reporting date.
7.4. PROPERTY, PLANT AND EQUIPMENT
(m DKK) 2018 2017
LEGO Group 1,831 1,831
The recoverable amount is based on the value in use, which is calculated by means of the realised net cash flows from trademark royalties for the current year using a discount rate (WACC) of 8% (2017 8%).
An impairment loss is recognised for the amount by which the carrying amount of the asset exceeds its recoverable amount. The recoverable amount is the higher of the fair value of an asset less expenses to sell and the value in use. For purposes of assessing impairment, assets are grouped at the lowest levels for which there are separately identifiable cash flows (cash generating units).
2018 (m DKK) Real estate Plant and equipment
Other fixtures, fittings, tools and equipment
Fixed assets under construction Total
Cost at 1 January 8,676 13,936 3,513 1,979 28,104 Exchange adjustment to year-end rate 14 (49) 33 72 70 Additions 157 403 101 1,667 2,328 Disposals (55) (177) (65) – (297) Transfers 318 127 30 (475) –
Cost at 31 December 9,110 14,240 3,612 3,243 30,205
Depreciation and impairment losses at 1 January (1,666) (5,225) (1,423) (7) (8,321)
Exchange adjustment to year-end rate (9) 13 (26) – (22) Depreciation for the year (236) (1,083) (282) – (1,601) Impairment losses for the year (25) – – – (25) Disposals 9 166 56 7 238
Depreciation and impairment losses at 31 December (1,927) (6,129) (1,675) – (9,731)
Carrying amount at 31 December 2018 7,183 8,111 1,937 3,243 20,474
Including assets held under finance leases 6 – – – 6
Proterty, plant and equipment in general
An obligation related to the purchase of property, plant and equipment of DKK 2,287 million exists at 31 December 2018 (DKK 3,293 million at 31 December 2017).
NOTES – KIRKBI GROUP PART 3 ANNUAL REPORT 2018 | 75 |
2017 (m DKK)
Real estate
Plant and equipment
Other fixtures, fittings, tools and equipment
Fixed assets under construction Total
Cost at 1 January 8,425 11,219 2,858 5,232 27,734
Exchange adjustment to year-end rate (138) 36 (123) (202) (427)
Additions 300 475 262 2,153 3,190
Disposals (7) (194) (41) (10) (252) Corrections 60 (381) (36) 3 (354) Transfers 36 2,781 593 (3,410) –
Transfers to current assets – – – (1,787) (1,787)
Cost at 31 December 8,676 13,936 3,513 1,979 28,104
Depreciation and impairment losses at 1 January (1,368) (4,562) (1,223) – (7,153) Exchange adjustment to year-end rate 17 (38) 60 – 39 Depreciation for the year (237) (1,102) (274) – (1,613)
Disposals (139) – – (7) (146) Corrections 44 314 (4) – 354 Transfers 17 (4) (13) – –Disposals – 167 31 – 198
Depreciation and impairment losses at 31 December (1,666) (5,225) (1,423) (7) (8,321)
Carrying amount at 31 December 2017 7,010 8,711 2,090 1,972 19,783
Including assets held under finance leases 9 – – – 9
Accounting policies Cost
Land and buildings comprise mainly factories, warehouses and offices. Property, plant and equipment are measured at cost, less subsequent depreciation and impairment losses, except for land, which is measured at cost less impairment losses.
Cost comprises acquisition price and expenses directly related to the acquisition until the time when the asset is ready for use. The cost of self-constructed assets comprises direct expenses for wage consumption and materials. Borrowing costs related to financing self constructed assets that take a substantial period of time to complete and whose commencement date is on or after 1 January 2009 are included in the cost price.
Leases
Leases of assets where the KIRKBI Group has substantially all risks and rewards of ownership are capitalised as finance leases under property, plant and equipment and depreciated over the estimated useful lives of the assets, according to the periods listed under the section Property, plant and equipment. The corresponding finance lease liabilities are recognised in liabilities.
Operating lease expenses are recognised in the income statement on a straight-line basis over the term of the lease.
PART 3 NOTES – KIRKBI GROUP | 76 | ANNUAL REPORT 2018
SECTION 8 – RISK MANAGEMENT
8.1. CONTINGENT LIABILITIES AND OTHER OBLIGATIONS
Contingent liabilities and other obligations (m DKK)
2018 2017
Remaining obligations in investment projects 8,810 11,543 Guarantees 636 757 Operating lease obligations 2,260 2,048 Other obligations 1,508 442 13,214 14,790
The KIRKBI Group leases various offices, warehouses and plants and machinery under non-cancellable operating leases. The leases have varying terms, clauses and rights.
The KIRKBI Group also leases plants and machinery under cancellable operating leases. The KIRKBI Group is required to give various notices of termination of these agreements.
Lease expenses for the year charged to the income statement amount to: 848 858
Future minimum lease payments under non-cancellable operating leases are specified as follows: 2018 2017
0-1 year 571 526 1-5 years 1,122 1,111 > 5 years 567 411 2,260 2,048
Security has been given in land, buildings and installations at a net carrying amount of DKK 2,866 million (DKK 2,435 million in 2017) for the mortgage loans.
The KIRKBI Group has utilised tax losses in non-Danish jurisdictions in the Danish joint taxation until 31 December
8.2. FINANCIAL RISKS
The financial risks of the KIRKBI Group are managed centrally from the Parent Company as well as decentralised by the operating companies. The overall risk management guidelines have been approved by the Board of Directors and include the KIRKBI Group’s treasury and investment policy related to securities. The KIRKBI Group’s risk management guidelines are established to identify and analyse the risk faced by the KIRKBI Group, to set the appropriate risk limits and controls to monitor the risks and ensure adherence to limits.
The overall purpose of the investment portfolio is to create economical value in accordance with the KIRKBI values, i.e to
• Protect the investment portfolio in the long run
• Support the LEGO Group and other strategic assets through delivering a stable growth of capital with an attractive risk-adjusted return
2004. The deferred tax of this amounts to DKK 90 million, of which DKK 0 million has been recognised as a provision for deferred tax. The amount of DKK 90 million is not expected to be recaptured.
• Avoid negative spill-over effects on the LEGO brand, the LEGOLAND brand and reputation
• Ensure high ethical standard in investments and engagements
Therefore, the investment policy includes, among other items, guidelines and ranges for which investments are considered to be eligible investments and which investment parameters are to be applied such as limits on issuer, duration, credit rating, country, or economic sector.
The guidelines are reviewed regularly to reflect changes in market conditions, the KIRKBI Group’s activities and financial position. A separate and independent risk management function reviews managers’ compliance with the mandates and the adequacy of the mandates to risks and exposures facing the KIRKBI Group.
NOTES – KIRKBI GROUP PART 3 ANNUAL REPORT 2018 | 77 |
Investment approach and asset allocation
The KIRKBI Group’s activities consist of holdings in the strategic assets, the LEGO Group, Merlin Entertainments plc and renewables as well as investments within the areas of real estate, long-term equity, private equity, quoted equities and fixed income.
The overall purpose implies a portfolio strategy based on firm and conservative investment principles and beliefs learned and built over time. Combined with the financial strength of KIRKBI and continued success of the LEGO Group, it allows KIRKBI to have a relatively aggressive asset allocation focused on long-term ownership of equities. However, the clear long-term focused investment beliefs and the focus on the portfolio consequences provide the foundation for a sustained long-term investment strategy.
Financial risk management
For the KIRKBI Group, the concept of risk is divided into two sub-concepts:
• Short-term risk of temporary loss of capital – i.e. quotation risk
• Long-term risk of permanent loss of capital – i.e. capital loss risk
As a long-term investor, the most important risk to avoid is the permanent loss of capital. However, as the financial investments function as a liquid buffer to cover obligations and non-financial risks, the financial investment portfolio is subject to short-term quotation risk.
Credit risk
Financial instruments are entered into with counterparts with investment grade level ratings.
Similarly, the KIRKBI Group only engages with insurance companies with investment grade ratings.
For banks and financial institutions, only independently rated parties with an acceptable long-term rating are accepted. Credit risk regarding trade receivables is disclosed in note 5.2. The credit risks of the KIRKBI Group are considered to be moderate.
Foreign exchange risk
The foreign exchange risk for the KIRKBI Group is mostly related to net inflows in the LEGO Group and investments denomited in foreign currencies.
The LEGO Group’s foreign exchange risk is managed centrally in LEGO System A/S based on a foreign exchange policy approved by the Board of Directors. Forward contracts and options are used to hedge purchases and sales in foreign currencies for the LEGO Group. These forward contracts are mainly classified as hedges and meet the accounting requirements for hedging of future cash flows.
The foreign exchange risks of the investments are managed centrally from the Parent Company. The overall risk management guidelines have been approved by the Board of Directors and include the KIRKBI Group’s treasury and investment policy.
The most significant exchange risks are in the currencies of USD and CHF. A negative 10% change in the USD currency would effect the income statement of the KIRKBI Group by DKK 1,200 million and reduce equity by DKK 1,000 million. A negative 10% change in the CHF currency would effect the income statement by DKK 400 million and would also reduce equity by DKK 400 million.
Interest rate risk
The KIRKBI Group’s interest rate risk relates mainly to the portfolio of core fixed income and corporate debt instruments. With the current interest rate levels and the composition of the portfolio, an increase of 1% in the interest rate would negatively effect the income statement with DKK 200 million. The KIRKBI Group’s interest rate risk is considered low.
Liquidity risk
Liquidity is managed centrally and is continuously assessed. It is ensured that, at any given time, sufficient financial resources are available. Based on cash and the liquid investment portfolio of bonds and quoted equities, the liquidity risk is considered insignificant.
8.3. DERIVATIVE FINANCIAL INSTRUMENTS
Total hedging activities
The derivatives used by the KIRKBI Group mainly relate to the LEGO Group. The LEGO Group uses a number of derivatives to hedge currency exposure. The hedging activities are categorised into hedging of forecast transactions (cash flow hedges), and hedges of assets and liabilities (fair value hedges).
The changes in fair value of the financial instruments qualifying for hedge accounting are recognised directly under other comprehensive income until the hedged items affect the income statement.
The changes in fair value of the financial instruments not qualifying for hedge accounting are recognised
directly in the income statement. This includes the time value of options.
All changes in fair value of hedging of assets and liabilities (fair value hedging) are recognised directly in the income statement.
Hedging of forecast transactions
The main hedging of forecast transactions relates to USD where the LEGO Group is hedging for a period up to 12 months. For 2018, a total of DKK 2.7 billion (2017 DKK 0.5 billion) has been recognised as forecast transactions in USD qualifying for hedge accounting. The fair value adjustment for USD directly in the income statement is below DKK 100 million and is not
PART 3 NOTES – KIRKBI GROUP | 78 | ANNUAL REPORT 2018
considered material to the consolidated KIRKBI Group income statement.
Hedging of balance sheet items
The main hedging of balance items relates to USD where the LEGO Group is hedging for a period up to 2 months. For 2018, a total of DKK 0.7 billion (2017 DKK 0.2 billion) has been recognised as hedging of balance sheet items in USD. The fair value adjustment for USD
Accounting policies
Derivative financial instruments are initially recognised in the balance sheet at fair value and are subsequently measured at fair value. Derivative financial instruments are recognised in other receivables and other current liabilities.
Changes to the fair value of derivative financial instruments which meet the criteria for hedging the fair value of a recognised asset or a recognised liability are recognised in the income statement together with any changes in the fair value of the hedged asset or liability attributable to the hedged risk.
The effective portion of changes to the fair value of derivative financial instruments which meet the
directly in the equity of the consolidated KIRKBI Group is below DKK 100 million and is not considered material.
Cash flow hedges for which hedge accounting is not applied
Cash flow hedges for which hedge accounting is not applied are insignificant in the consolidated KIRKBI Group figures.
criteria for hedging future cash flows are recognised in other comprehensive income. Income and expenses relating to these hedge transactions are transferred from equity when the hedged item affects the income statement. The amount is recognised in financial income or expenses.
In case of settlement of a derivative designated as a cash flow hedge, the accumulated fair value adjustment remains in equity until the hedged transaction occurs. If the hedged transaction is no longer expected to take place, any accumulated fair value adjustments are transferred from equity to the income statement under financial income or expenses.
8.4. FINANCIAL ASSETS AND LIABILITIES
(m DKK)
Financial assets:
2018 2017
Fair value through profit or loss Amortised cost
Fair value through profit or loss Amortised cost
Investment real estate 7,537 7,267 –Receivable from associates 658 598 –
Finance leases 1,372 – 1,298 Other investments 109 – 102 Trade and other receivables 9,360 – 8,655 Securities 49,983 45,648 –Cash 2,616 1,767
Total financial assets 58,178 13,457 53,513 11,822
Financial assets measured at fair value through profit or loss by level:
Level 1 – Fair value based on listed prices in active markets 37,313 34,498
Level 2 – Fair value based on valuation techniques with observable market data – –
Level 3 – Fair value with significant input from data not obervable in the market 20,865 19,015 58,178 53,513
Financial liabilities:
Borrowings (current and non-current) 3,836 3,778
Trade payables 3,497 3,014 Other liabilities (current and non-current) 5,860 5,013
Total financial liabilities 13,193 11,805
NOTES – KIRKBI GROUP PART 3 ANNUAL REPORT 2018 | 79 |
Accounting policies
The KIRKBI Groups investment activities (please see section 4) are meassured at fair value through profit and loss, which equals listed prices (level 1) or
internationally accepted valuation models (level 3). All other recognised financial assets and liabilities are measured at amortised cost.
SECTION 9 – OTHER NOTES
9.1. EMPLOYEE EXPENSES
(m DKK) 2018 2017
Wages and salaries 6,190 6,176 Termination benefit and restructuring (16) 232 Pension costs, defined contribution plans 255 224 Other expenses and social security costs 453 478 6,882 7,110
Average number of full-time employees 15,523 16,909
Executive Management and Board of Directors: Salaries and other remuneration 21 21 Short-term incentive plans 3 2 Long-term incentive plans – 14 24 37
Since the Executive Management only consists of one member, the remuneration of the Executive Management and the Board of Directors is disclosed collectively with reference to § 98b (3) of the Danish Financial Statements.
Accounting policies
Wages, salaries, social security contributions, paid annual leave and sick leave, bonuses and non-monetary employee benefits are accrued in the year in which the associated services are rendered by the
Incentive plans comprise a short-term incentive plan based on yearly performance and a long-term incentive plan related to long-term goals regarding value creation.
employees of the KIRKBI Group. Where the KIRKBI Group provides long-term employee benefits, the costs are accumulated to match the rendering of the services by the employees concerned.
PART 3 NOTES – KIRKBI GROUP | 80 | ANNUAL REPORT 2018
9.2. AUDITORS’ FEE
(m DKK) 2018 2017
Fee to Deloitte:
Statutory audit of the financial statements 3 3 Other assurance engagements – –Tax assistance 1 2 Other services 4 2 8 7
Fee to PwC:
Statutory audit of the financial statements 10 10 Other assurance engagements 1 1 Tax assistance 14 13 Other services 16 13 41 37
Total auditors´ fees 49 44
9.3. SHARE CAPITAL
The share capital consists of: (m DKK)
1 A-shares of DKK 1,000 or multiples thereof 199 B-shares of DKK 1,000 or multiples thereof 200 Total shares at 31 December 2018
Accounting policies
Dividends are recognised as a liability in the period in which they are adopted at the Annual General Meeting.
Each ordinary A share of DKK 1,000 gives 1,000 votes, while each ordinary B share of DKK 1,000 gives 1 vote.
Dividend has been distributed at DKK 2.00 per share (2017 DKK 2.00).
Within the last 5 years, there have been no changes in the share capital.
NOTES – KIRKBI GROUP PART 3 ANNUAL REPORT 2018 | 81 |
9.4. NON-CONTROLLING INTERESTS
Information about the KIRKBI Group’s subsidiaries which have non-controlling interests.
Non-controlling part
Koldingvej 2, Billund A/S Other Subsidiary LEGO A/S Other
(m DKK) 2018 2017 2018 2017
Statement of comprehensive income in subsidiary
Revenue 36,391 34,995 371 373 Net profit (loss) for the year allocated to the parent company shareholders 8,076 7,806 53 65 Total comprehensive income allocated to the parent company shareholders 8,039 7,675 53 65
Balance sheet in subsidiary
Non-current assets 12,754 12,553 1,327 1,270 Current assets 18,731 17,358 118 125 Total Liabilities (9,732) (9,197) (168) (172) Equity 21,753 20,714 1,277 1,223
Cash flow in subsidiary Cash flow from operating activities 9,847 10,691 55 65 Cash flow from investing activities (1,492) (1,523) (35) –Dividend to shareholders (7,000) (7,000) – –
Ownership interest of non-controlling interests 25 % 25 % 6-49 % 6-49 %
Consolidation into the KIRKBI Group Total (m DKK) 2018 2017 2018 2017 2018 2017
Carrying amount 1 January 5,179 5,010 106 95 5,285 5,105
Share of net profit allocated to the non-controlling interests 2,018 1,952 8 7 2,026 1,959 Non-controlling interests of net profit 2,018 1,952 8 7 2,026 1,959
Share of comprehensive income allocated to non-controlling interest (8) (33) – – (8) (33) Non-controlling interests of total comprehensive income 2,010 1,919 8 7 2,018 1,926
Other adjustments:
Aquisition of non-controlling interests – – – 6 – 6 Dividend paid (1,750) (1,750) – (2) (1,750) (1,752)
Carrying amount 31 December 5,439 5,179 114 106 5,553 5,285
9.5. PENSION OBLIGATIONS
Defined contribution plans: In defined contribution plans, the KIRKBI Group recognises in the income statement the premium payments (e.g. a fixed amount or a fixed percentage
of the salary) to the independent insurance companies responsible for the pension obligations. Once the pension contributions for defined contribution plans have been paid, the KIRKBI Group has no further
PART 3 NOTES – KIRKBI GROUP | 82 | ANNUAL REPORT 2018
pension obligations towards current or past employees. The pension plans in the Danish companies and some of the non-Danish companies are defined contribution plans. In the KIRKBI Group, DKK 201 million (DKK 216 million in 2017) has been recognised in the income statement as costs relating to defined contribution plans.
Defined benefit plans: In defined benefit plans, the KIRKBI Group is obliged to pay a certain pension benefit. The defined benefit plans include employees in Germany and in the UK.
Accounting policies
Costs regarding defined contribution plans are recognised in the income statement in the periods in which the related employee services are delivered.
Net obligations in respect of defined benefit pension plans are calculated separately for each plan by estimating the amount of future benefits that employees have earned in return for their service in the current and prior periods; that benefit is discounted to determine its present value, and the fair value of any plan assets is deducted.
Discount rates are based on the market yield of high quality corporate bonds in the country concerned approximating to the terms of the KIRKBI Group’s pension obligations. The calculations are performed
In the KIRKBI Group, a net obligation of DKK 161 million (DKK 184 million in 2017) has been recognised relating to the KIRKBI Group’s obligations towards current or past employees concerning defined benefit plans. The obligation is calculated after deduction of the plan assets. In the KIRKBI Group, DKK 20 million (DKK 1 million in 2017) was recognised in the income statement and DKK 28 million (DKK 3 million in 2017) has been recognised in other comprehensive income. All defined benefit plans relate to the LEGO Group and no new employees will be included in the defined benefit plans.
by a qualified actuary using the Projected Unit Credit Method. When the benefits of a plan are increased, the portion of the increased benefit relating to past service by employees is recognised as an expense in the income statement over the vesting period. To the extent that the benefits are vested, the expense is recognised in the income statement immediately.
Actual gains and losses are recognised in other comprehensive income in the period in which they occur.
Net pension assets are recognised to the extent that the KIRKBI Group is able to derive future economic benefits in the way of refunds from the plan or reductions of future contributions.
9.6. RELATED PARTY TRANSACTIONS
KIRKBI A/S’ related parties comprise Kjeld Kirk Kristiansen, Sofie Kirk Kristiansen, Thomas Kirk Kristiansen, Agnete Kirk Thinggaard and the Board of Directors and the Executive Management of KIRKBI A/S. Related parties also comprise subsidiaries and associates. Related parties further comprise companies where the mentioned shareholders have significant influence.
Kjeld Kirk Kristiansen, Sofie Kirk Kristiansen, Thomas Kirk Kristiansen and Agnete Kirk Thinggaard have as shareholders significant influence in KIRKBI A/S.
In the financial year, a limited number of transactions related to services took place between the owners of KIRKBI A/S and the KIRKBI Group. These services were paid on normal market terms and the total fee paid to KIRKBI A/S amounts to DKK 24 million (2017 DKK 16 million). Interests paid to owners of KIRKBI A/S amounted in the financial year to DKK 18 million (DKK 23 million in 2017).
9.7. POST BALANCE SHEET EVENTS
During the period from 31 December 2018 and until adoption at the annual report, no events have
Transactions related to sales of products and services between associates and the KIRKBI Group amounted to DKK 697 million (DKK 685 million in 2017), which was paid on normal market terms.
There were no transactions with the Board of Directors or the Executive Management besides transactions related to the employment except for the circumstances described above.
For information about remuneration to the Board of Directors and the Executive Management, see note 9.1.
Loans, receivables and commitments related to associates are specified in the KIRKBI Group’s balance sheet.
occurred that could have significant effect on the annual report for 2018.
NOTES – KIRKBI GROUP PART 3 ANNUAL REPORT 2018 | 83 |
9.8. GROUP STRUCTURE
Ownership is 100% unless stated otherwise
KIRKBI A/S
LEGO A/S, 75 % (Denmark)
Denmark
LEGO System A/S
LEGO Security Billund ApS
Europe
LEGO Park Holding UK Ltd.
– LEGO Lifestyle International Ltd. (UK)
LEGO Company Limited (UK)
LEGO Belgium n.v.
LEGO Netherland B.V.
LEGO Sverige AB
LEGO Norge A/S
Oy Suomen LEGO Ab (Finland)
LEGO GmbH (Germany)
LEGO Handelsgesells. GmbH (Austria)
LEGO S.A.S. (France)
LEGO S.p.A. (Italy)
LEGO brand Retail S.A.S (France)
LEGO S.A. (Spain)
LEGO Lda. (Portugal)
LEGO Production s.r.o. (Czech Republic)
LEGO Trading s.r.o. (Czech Republic)
LEGO Schweiz AG
LEGO Hungária Kft.
LEGO Manufacturing Kft. (Hungary)
LEGO Polska Sp. z.o.o.
LEGO Romania S.R.L.
LEGO Ukraine LLC
LEGO Ltd. (Russia)
LLD Share verwaltungs GmbH (Germany)
LEGO Turkey Oyuncak Tiearet Anonim Sirketi
Americas
LEGO do Brasil Comercio e Distribuicâo de Brinquedos Ltda LEGO Canada Inc.
LEGO Mexico S.A. de C.V
Administración de Servicios LEGO, S. de R.L. de C.V. (Mexico)
LEGO Operaciones de Mexico S.A. de C.V. (Mexico)
LEGO Real Estate, S.A. de C.V. (Mexico)
LEGO System Inc. (US)
– LEGO brand Retail Inc. (US)
Asia,Africa and Australia
LEGO Hong Kong Limited
LEGO Australia Pty. Ltd.
LEGO New Zealand Ltd.
LEGO Korea Co. Ltd.
LEGO South Africa (Pty.) Ltd.
LEGO Japan Ltd.
LEGO Company Ltd. (Hong Kong)
LEGO Singapore Pte. Ltd.
LEGO Trading CO Ltd. (Beijing)
LEGO India Private Limited
LEGO Trading Sdn. Bhd (Malaysia)
LEGO Toy Manufacturing Co., Ltd. (Jiaxing)
LEGO Toy Co., Ltd. (Shanghai)
LEGO Trading Co., Ltd. (Taiwan)
LEGO Commerce (Shenzhen) Co. Ltd.
LEGO Middle East FZ-LLC (Utd.Arab Emir.)
PART 3 NOTES – KIRKBI GROUP | 84 | ANNUAL REPORT 2018
KIRKBI Invest A/S, 100% (Denmark)
KIRKBI Invest A/S (Denmark)
Denmark LEGO Juris A/S
KIRKBI Anlæg A/S
KIRKBI Real Estate Investment A/S
Neue Flora Invest A/S
K & C Holding A/S
– Blue Hors ApS
– Schelenborg Gods ApS
– Privathospital Mølholm P/S, 91%
– HCM A/S, 51%
Europe
KIRKBI Estates Ltd. (UK)
KIRKBI Real Estate Investment GmbH (Germany)
Einsteinstrasse GmbH, 90% (Germany)
Elsenheimerstrasse GmbH (Germany)
Maxor 4 GmbH, 94% (Germany)
KIRKBI AG (Switzerland)
KIRKBI Real Estate AG, 100% (Switzerland)
Europe
KIRK AG (Switzerland)
Hotel Valbella Inn AG (Switzerland)
Asia
LLJ Investco KK (Japan)
Associates (accounted for using the equity method)
Merlin Entertainments plc, 29.6% (UK)
Founders A/S, 33.3% (Denmark)
Associates (accounted for using fair value through profit and loss)
Falck A/S, 27.8% (Denmark)
Välinge Group AB, 48.3% (Sweden)
Evolve Additive Solutions, Inc., 27.8% (US)
Peppy Pals AB, 25.3% (Sweden)
Joint Operations (accounted for using pro-rata consolidation)
Boston Holding A/S, 63% (Denmark)
– Borkum Riffgrund I Offshore Windpark A/S Gmbh & Co. OHG, 50% (Germany)
KIRKBI Burbo Extension Holding Ltd. (UK)
– Burbo Extension Holding Ltd., 25% (UK)
– Burbo Extension Ltd., 25% (UK)
NOTES – KIRKBI GROUP PART 3 ANNUAL REPORT 2018 | 85 |

PART 4 PARENT COMPANY | 86 | ANNUAL REPORT 2018
PARENT COMPANY

CONTENTS
PART 4 Parent Company
88 Income statement and statement of comprehensive income 1 January – 31 December 88 Balance Sheet at 31 December 90 Statement of changes in Equity 90 Cash flow statement 1 January – 31 December 91 01 Significant accounting policies 91 02 Employee expenses 91 03 Financial income 91 04 Financial expenses 92 05 Tax on profit for the year 92 06 Property, plant and equipment 93 07 Investments in subsidiaries 93 08 Non-current liabilities 93 09 Deferred tax 93 10 Contingent liabilities and other obligations 94 11 Related party transactions
PART 5 Additional information 99 Management’s statement 100 Independent auditor’s report
PARENT COMPANY PART 4 ANNUAL REPORT 2018 | 87 |
INCOME STATEMENT & COMPREHENSIVE INCOME
1 JANUARY – 31 DECEMBER
(m DKK)
Note 2018 2017
Dividend from investments in subsidiaries 5,250 5,250 Other net income 17 18 Administration costs 2 (307) (268) Operating profit 4,960 5,000
Financial income 3 – 20 Financial expenses 4 (13) (6) Profit before tax 4,947 5,014
Tax on profit for the year 5 48 75 Profit for the year 4,995 5,089
Statement of comprehensive income Profit for the year 4,995 5,089 Other comprehensive income after tax 1 3 4,996 5,092
Proposed distribution Dividend 200 200 Transferred to retained comprehensive income 4,796 4,892 4,996 5,092
BALANCE SHEET AT 31 DECEMBER
(m DKK) Note 2018 2017
ASSETS
Non-current assets Property 499 522 Other fixtures, fittings, tools and equipment 15 13 Fixed assets under construction 913 374 Property, plant and equipment 6 1,427 909
Investments in subsidiaries 7 36,342 36,342 Other investments 13 –Deferred tax assets 9 1 –Other non-current assets 36,356 36,342
Total non-current assets 37,783 37,251
Current assets
Receivables from subsidiaries 9,801 5,435
Current tax receivables 438 688 Other receivables 41 33 Cash 3 5
Total current assets 10,283 6,161
TOTAL ASSETS 48,066 43,412
PART 4 PARENT COMPANY | 88 | ANNUAL REPORT 2018
BALANCE SHEET AT 31 DECEMBER
(m DKK)
EQUITY AND LIABILITIES EQUITY
Note 2018 2017
Share capital 200 200
Retained comprehensive income 47,001 42,405 Proposed dividend 200 200
Total equity 47,401 42,805
LIABILITIES
Non-current liabilities
Borrowings 8 154 164 Deferred tax liabilities 9 – 2 Other long-term liabilities 8 93 97 Total non-current liabilities 247 263
Current liabilities
Borrowings 8 10 10
Payables to subsidiaries 193 152 Trade payables 73 87 Other short-term liabilities 142 95 Total current liabilities 418 344
Total liabilities 665 607
TOTAL EQUITY AND LIABILITIES 48,066 43,412
Contingent liabilities and other obligations 10
PARENT COMPANY PART 4 ANNUAL REPORT 2018 | 89 |
STATEMENT OF CHANGES IN EQUITY
(m DKK)
2018
Share capital
Retained comprehensive income Proposed dividend Total
Equity at 1 January 200 42,405 200 42,805
Profit for the year – 4,795 200 4,995 Other comprehensive income for the year – 1 – 1 Total comprehensive income for the year – 4,796 200 4,996
Dividend – (200) (200) (400) Equity at 31 December 200 47,001 200 47,401
2017
Equity at 1 January 200 37,713 200 38,113
Profit for the year – 4,889 200 5,089 Other comprehensive income for the year – 3 – 3
Total comprehensive income for the year – 4,892 200 5,092
Dividend – (200) (200) (400) Equity at 31 December 200 42,405 200 42,805
CASH FLOW STATEMENT 1 JANUARY – 31 DECEMBER
(m DKK)
Note 2018 2017
Operating profit 4,960 5,000 Interest received – 20
Interest paid (16) (6)
Income tax (paid)/received 298 (127) Reversals of items with no effect on cash flows 27 67
Changes in working capital (4,307) (4,198) Cash flows from operating activities 962 756
Purchases of property, plant and equipment (541) (346) Proceeds from sale of property, plant and equipment – 2
Other investments (13) –
Cash flows from investing activities (554) (344)
Dividend paid to shareholders (400) (400) Repayments of borrowings (10) (9)
Cash flows from financing activities (410) (409)
Net cash flows (2) 3
Cash at 1 January 5 2
Cash at 31 December 3 5
PART 4 PARENT COMPANY | 90 | ANNUAL REPORT 2018
NOTE 1. SIGNIFICANT ACCOUNTING POLICIES
The annual report of the Parent Company KIRKBI A/S has been prepared in accordance with International Financial Reporting Standards (IFRS) as adopted by the EU and additional requirements of the Danish Financial Statements Act. for reporting class C enterprises (Large).
The accounting policies for the Parent Company and for the KIRKBI Group are identical except for the following:
Dividend from investments in subsidiaries Dividend from investments in subsidiaries is recognised in the income statement of the parent company in the year the dividends are declared. If the dividend
NOTE 2. EMPLOYEE EXPENSES
distributed exceeds the comprehensive income of the subsidiaries in the period the dividend is declared, an impairment test is performed.
Investments in subsidiaries Investments in subsidiaries are measured at acquisition cost. The acquisition cost includes the fair value of the purchase consideration plus direct purchase costs.
If there is an indication of impairment, impairment testing is carried out as described in the accounting policies for the consolidated financial statements. Where the carrying value exceeds the recoverable amount, it is written down to the recoverable amount.
(m DKK) 2018 2017
Wages and salaries 190 226 Pension costs 4 3 Other staff costs and social security costs 1 1 195 230
Including fee to Executive Management and Board of Directors 23 36
Number of employees 122 98
Since the Executive Management only consists of one member, the remuneration of the Executive Management and the Board of Directors is disclosed collectively with reference to § 98b (3) of the Danish Financial Statements Act.
NOTE 3. FINANCIAL INCOME
Incentive plans comprise a short-term incentive plan based on yearly performance and a long-term incentive plan related to long-term goals regarding value creation.
(m DKK) 2018 2017
Other interest and exchange gains – 20 – 20
NOTE 4. FINANCIAL EXPENSES
(m DKK) 2018 2017
Interest to subsidiaries – 1 Other interest and exchange losses 13 5 13 6
PARENT COMPANY PART 4 ANNUAL REPORT 2018 | 91 |
NOTE 5. TAX ON PROFIT FOR THE YEAR
(m DKK)
2018 2017
Current tax on profit for the year (53) (48) Changes in deferred tax (3) –Adjustment of tax relating to previous years, current tax 8 (27) (48) (75)
Income tax expenses are specified as follows:
Calculated 22% (22%) tax on profit for the year before income tax 1,089 1,103 Non-taxable income (1,150) (1,155) Non-deductable costs 5 4 Adjustment of tax relating to previous years 8 (27) (48) (75)
NOTE 6. PROPERTY, PLANT AND EQUIPMENT
2018 (m DKK) Property
Other fixtures, fittings, tools and equipment Fixed asset under construction Total
Cost at 1 January 614 15 374 1,003 Additions – 2 539 541 Disposals – – – –Transfer – – – –Cost at 31 December 614 17 913 1,544
Depreciation and impairment losses at 1 January 92 2 – 94 Depreciation for the year 23 – – 23 Disposals – – – –Depreciation and impairment losses at 31 December 115 2 – 117
Carrying amount at 31 December 499 15 913 1,427
2017 (m DKK) Property
Other fixtures, fittings, tools and equipment Fixed asset under construction Total
Cost at 1 January 554 11 140 705 Additions 60 4 282 346 Disposals (48) – – (48) Transfer 48 – (48) –Cost at 31 December 614 15 374 1,003
Depreciation and impairment losses at 1 January 118 2 – 120 Depreciation for the year 20 – – 20 Disposals (46) – – (46) Depreciation and impairment losses at 31 December 92 2 – 94
Carrying amount at 31 December 522 13 374 909
PART 4 PARENT COMPANY | 92 | ANNUAL REPORT 2018
NOTE 7. INVESTMENTS IN SUBSIDIARIES
(m DKK)
2018 2017
Cost at 1 January 36,342 17,442 Additions (Conversion of receivable from subsidiaries) – 18,900 Cost at 31 December 36,342 36,342
Subsidiaries
Domicile Currency Nominal capital Ownership/Votes %
LEGO A/S Denmark DKK 20,000,000 75 %
KIRKBI Invest A/S Denmark DKK 126,000,000 100 % KIRKBI Real Estate AG Switzerland CHF 67,000,000 100 %
NOTE 8. NON-CURRENT LIABILITIES
(m DKK)
Total debt Due within 1 year Due between 2 and 5 years
Borrowings 164 10 42 Other long-term liabilities 93 – 93 257 10 135
NOTE 9. DEFERRED TAX
(m DKK) 2018 2017
Deferred tax, net at 1 January (2) (2) Change in deferred tax 3 –Provision for deferred tax, net at 31 December 1 (2)
Classified as: Deferred tax assets 1 –Deferred tax liabilities – (2) 1 (2)
NOTE 10. CONTINGENT LIABILITIES AND OTHER OBLIGATIONS
(m DKK) 2018 2017
Remaining obligations in investment projects 874 1,319 Guarantees for group enterprises´ balances with credit institutions 1,778 932 Liabilities operational lease contracts 8 7
Total 2,660 2,258
Security has been given in land, buildings and installations at a net carrying amount of DKK 165 million (DKK 173 million in 2017) for the company’s mortgage loans.
The Parent Company is the KIRKBI Group’s administration company in relation to the Danish tax authorities in as far as national, joint taxation is concerned.
PARENT COMPANY PART 4 ANNUAL REPORT 2018 | 93 |
NOTE 11. RELATED PARTY TRANSACTIONS
KIRKBI A/S´ related parties comprise Kjeld Kirk Kristiansen, Sofie Kirk Kristiansen, Thomas Kirk Kristiansen, Agnete Kirk Thinggaard and the Board of Directors and the Executive Management of KIRKBI A/S. Related parties also comprise subsidiaries and associates and Boards of Directors and Executive Management in these companies. Related parties further comprise companies where the mentioned shareholders have significant influence.
Kjeld Kirk Kristiansen, Sofie Kirk Kristiansen, Thomas Kirk Kristiansen and Agnete Kirk Thinggaard have as shareholders significant influence in KIRKBI A/S.
In the financial year a limited number of transactions related to services took place between the owners
(m DKK)
of KIRKBI A/S and KIRKBI A/S. These services have been paid on normal market conditions and the total fee paid to KIRKBI A/S does not exceed DKK 6 million (2017 DKK 1 million).
There were no transactions in the financial year with the Board of Directors or the Executive Management besides transactions related to employment, except from the circumstances described above.
For information of remuneration to the Board of Directors and the Executive Management, see note 2.
Transactions with subsidiaries and associates have included the following:
2018 2017
Rental income 41 42 Sale of services 89 66
Financial expenses – (1) Rental expenses (7) (3) Purchase of services (36) (33)
Loans, receivables and commitments related to subsidiaries and associates are specified in the balance sheet.
PART 4 PARENT COMPANY | 94 | ANNUAL REPORT 2018

PARENT COMPANY PART 4 ANNUAL REPORT 2018 | 95 |

| 96 | ANNUAL REPORT 2018 PART 5 ADDITIONAL INFORMATION
ADDITIONAL INFORMATION
CONTENTS

PART 5 Additional information 97 Management’s statement 98 Independent auditor’s report ANNUAL REPORT 2018 | 97 | ADDITIONAL INFORMATION PART 5
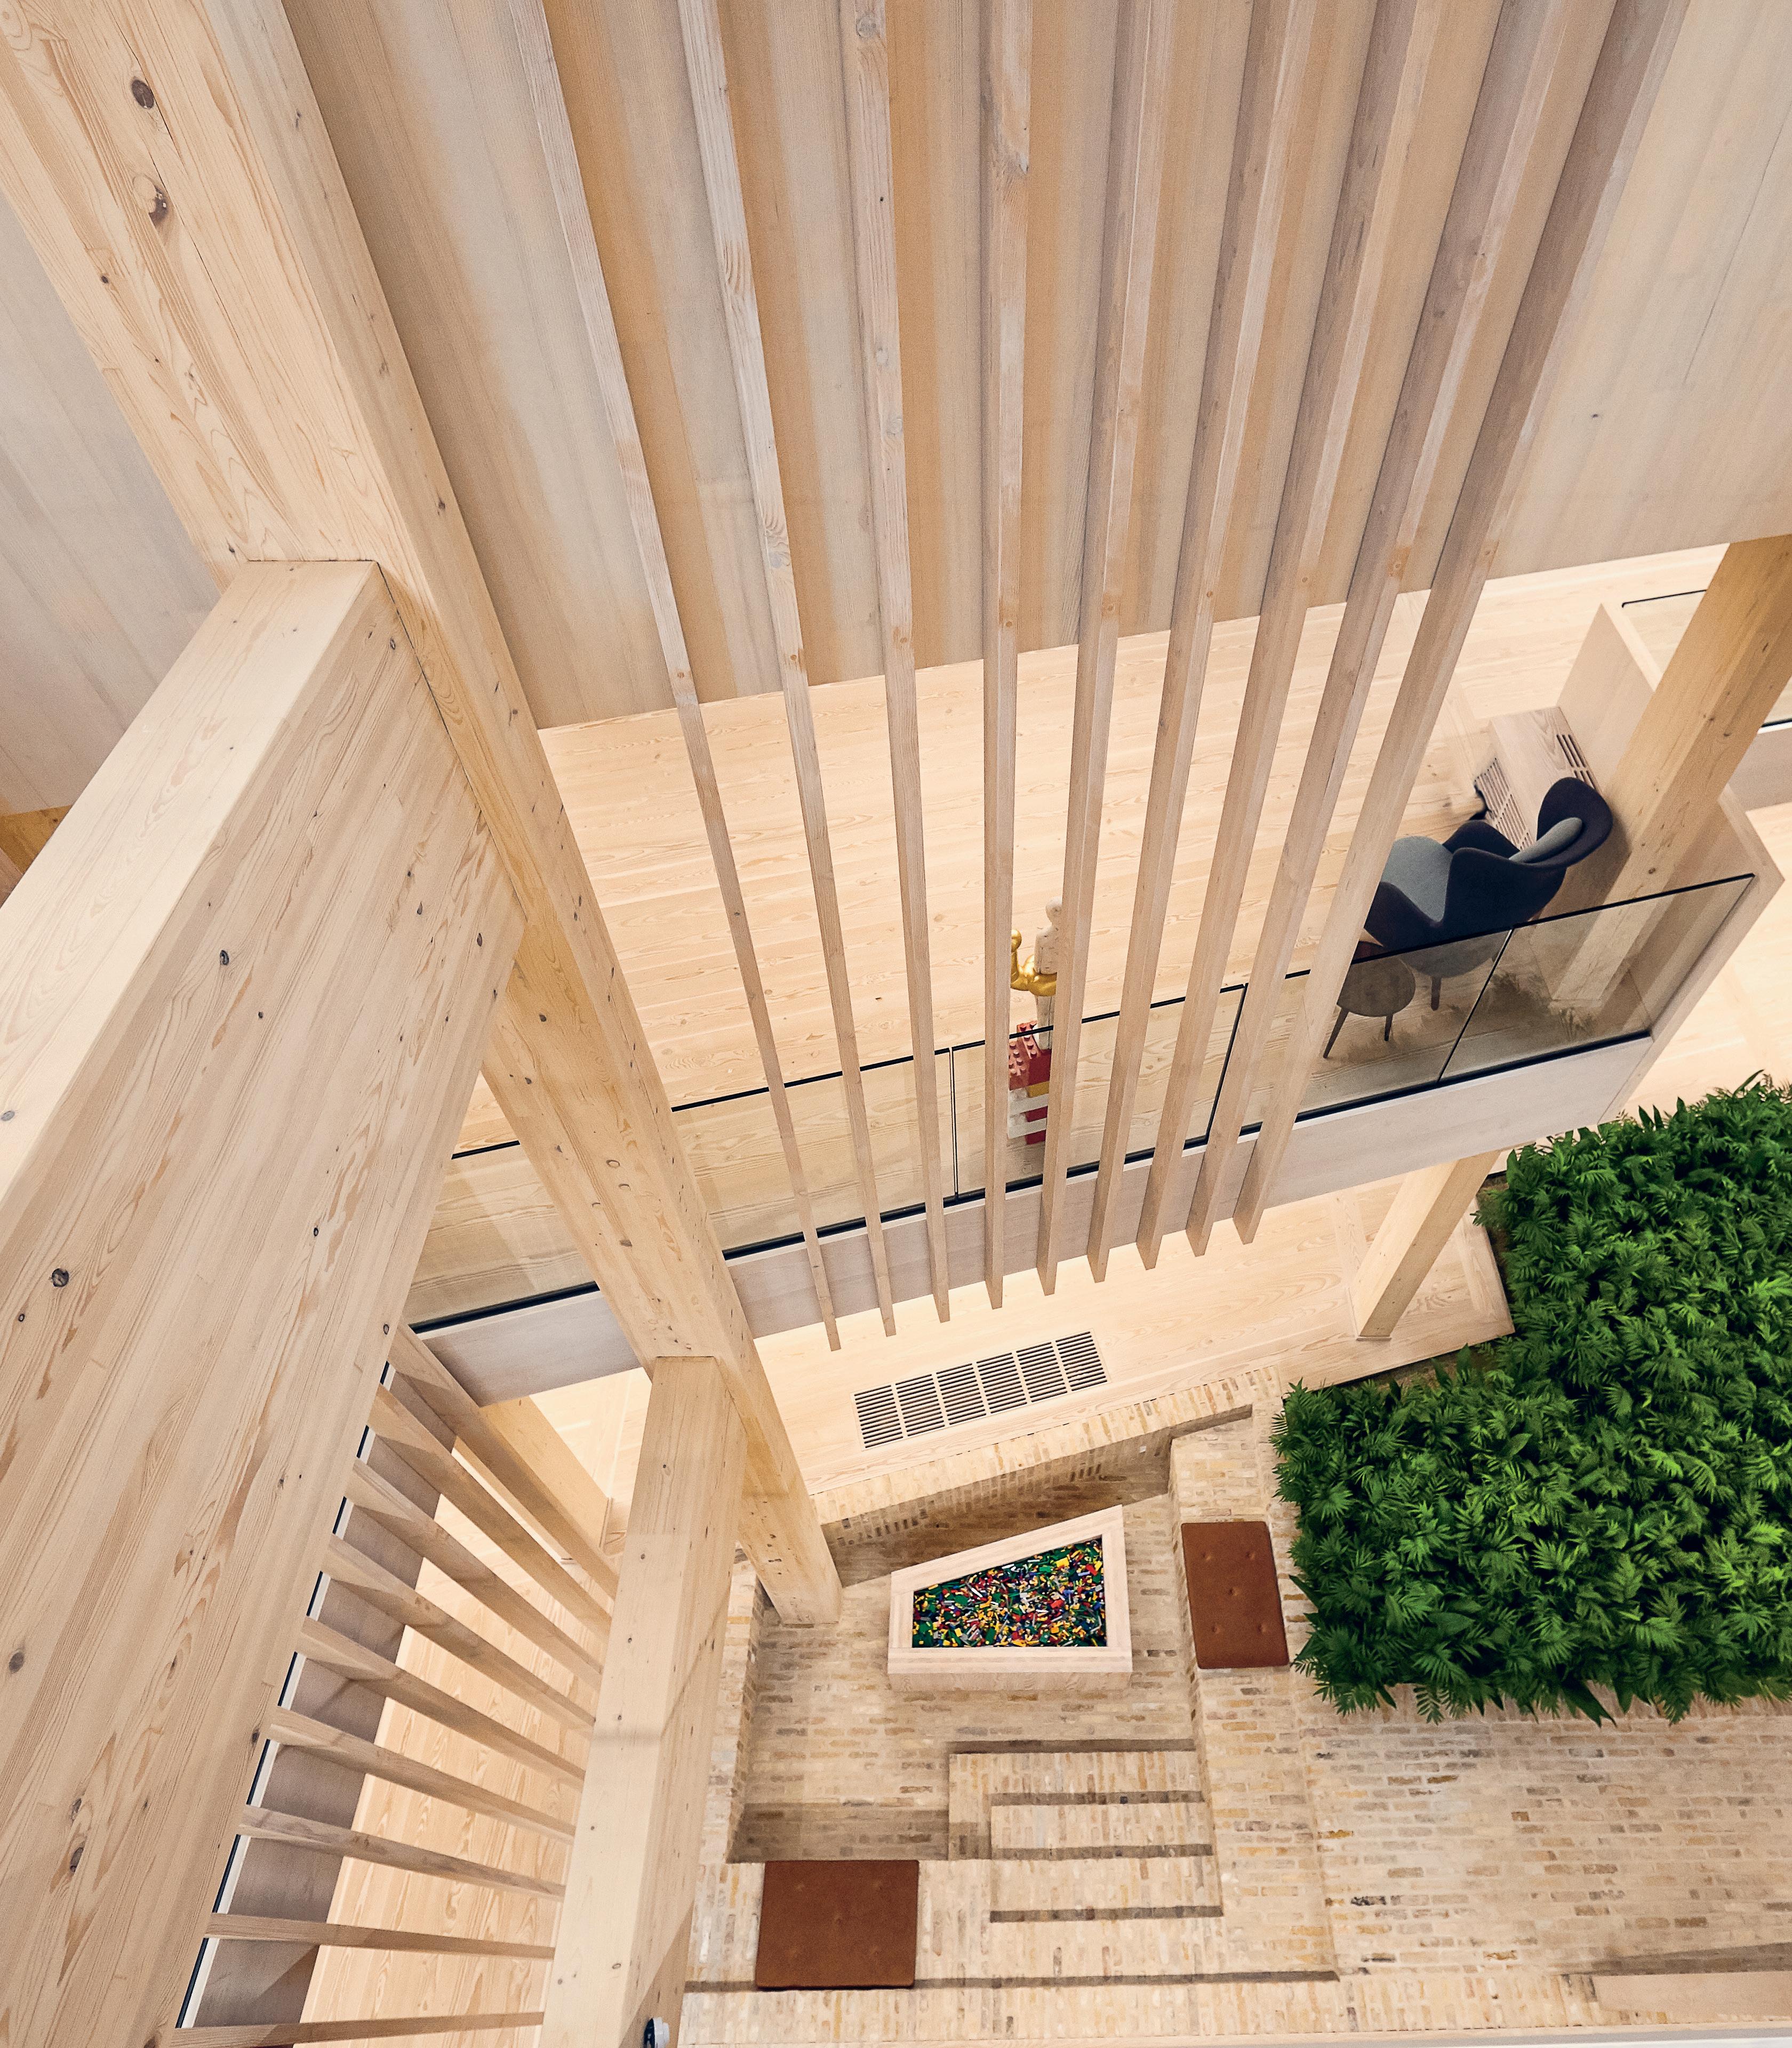
| 98 | ANNUAL REPORT 2018 PART 5 MANAGEMENT’S STATEMENT
MANAGEMENT’s STATEMENT
Today, the Board of Directors and Executive Management have discussed and approved the annual report of KIRKBI A/S for the financial year 1 January – 31 December 2018.
The annual report is prepared in accordance with International Financial Reporting Standards (IFRS) as adopted by the EU and additional disclosure requirements in the Danish Financial Statements Act.
In our opinion, the consolidated financial statements and the Parent Company financial statements give a true and fair view of the Group’s and the Parent Company’s financial position at 31 December 2018 and of the results of the Group’s and the Parent Company’s cash flows for the financial year 1 January – 31 December 2018 in accordance with International Financial Reporting Standards (IFRS) as adopted by the EU and additional disclosure requirements in the Danish Financial Statements Act.
In our opinion, the management’s review includes a fair review of the development in the Group’s and the Parent Company’s operations and economic conditions, the results for the year and the financial position of the Group and the Parent Company, as well as a review of the most significant risks and elements of uncertainty facing the Parent Company and the Group, in accordance with International Financial Reporting Standards (IFRS) as adopted by the EU and additional disclosure requirements in the Danish Financial Statements Act.
We recommend the adoption of the annual report at the annual general meeting of shareholders.
Billund, 5 March 2019
EXECUTIVE MANAGEMENT
Søren Thorup Sørensen, CEO
BOARD OF DIRECTORS
Kjeld Kirk Kristiansen, Chairman
Niels Jacobsen, Deputy Chairman
Jeppe Fonager Christiansen
Peter Gæmelke
Thomas Kirk Kristiansen
ANNUAL REPORT 2018 | 99 | MANAGEMENT’S STATEMENT PART 5
INDEPENDENT AUDITOR’s REPORT
To the shareholders of KIRKBI A/S OPINION
We have audited the consolidated financial statements and the parent financial statements of KIRKBI A/S for the financial year 01.01.2018 – 31.12.2018, which comprise the income statement, statement of comprehensive income, balance sheet, statement of changes in equity, cash flow statement and notes, including a summary of significant accounting policies, for the Group as well as the Parent. The consolidated financial statements and the parent financial statements are prepared in accordance with International Financial Reporting Standards as adopted by the EU and additional requirements of the Danish Financial Statements Act.
In our opinion, the consolidated financial statements and the parent financial statements give a true and fair view of the Group’s and the Parent’s financial position at 31.12.2018, and of the results of their operations and cash flows for the financial year 01.01.2018 – 31.12.2018 in accordance with International Financial Reporting Standards as adopted by the EU and additional requirements of the Danish Financial Statements Act.
Basis for opinion
We conducted our audit in accordance with International Standards on Auditing (ISAs) and the additional requirements applicable in Denmark. Our responsibilities under those standards and requirements are further described in the Auditor’s responsibilities for the audit of the consolidated financial statements and the parent financial statements section of this auditor’s report. We are independent of the Group in accordance with the International Ethics Standards Board of Accountants’ Code of Ethics for Professional Accountants (IESBA Code) and the additional requirements applicable in Denmark, and we have fulfilled our other ethical responsibilities in accordance
with these requirements. We believe that the audit evidence we have obtained is sufficient and appropriate to provide a basis for our opinion.
STATEMENT ON THE MANAGEMENT’S REVIEW
Management is responsible for the management’s review. Our opinion on the consolidated financial statements and the parent financial statements does not cover the management’s review, and we do not express any form of assurance conclusion thereon.
In connection with our audit of the consolidated financial statements and the parent financial statements, our responsibility is to read the management’s review and, in doing so, consider whether the management’s review is materially inconsistent with the consolidated financial statements and the parent financial statements or our knowledge obtained in the audit or otherwise appears to be materially misstated.
Moreover, it is our responsibility to consider whether the management’s review provides the information required under the Danish Financial Statements Act.
Based on the work we have performed, we conclude that the management’s review is in accordance with the consolidated financial statements and the parent financial statements and has been prepared in accordance with the requirements of the Danish Financial Statements Act. We did not identify any material misstatement of the management’s review.
Management’s responsibilities for the consolidated financial statements and the parent financial statements Management is responsible for the preparation of consolidated financial statements and parent financial statements that give a true and fair view in
accordance with International Financial Reporting Standards as adopted by the EU and additional requirements of the Danish Financial Statements Act, and for such internal control as Management determines is necessary to enable the preparation of consolidated financial statements and parent financial statements that are free from material misstatement, whether due to fraud or error.
In preparing the consolidated financial statements and the parent financial statements, Management is responsible for assessing the Group’s and the Parent’s ability to continue as a going concern, for disclosing, as applicable, matters related to going concern, and for using the going concern basis of accounting in preparing the consolidated financial statements and the parent financial statements unless Management either intends to liquidate the Group or the Entity or to cease operations, or has no realistic alternative but to do so.
Auditor’s responsibilities for the audit of the consolidated financial statements and the parent financial statements
Our objectives are to obtain reasonable assurance about whether the consolidated financial statements and the parent financial statements as a whole are free from material misstatement, whether due to fraud or error, and to issue an auditor’s report that includes our opinion. Reasonable assurance is a high level of assurance, but is not a guarantee that an audit conducted in accordance with ISAs and the additional requirements applicable in Denmark will always detect a material misstatement when it exists. Misstatements can arise from fraud or error and are considered material if, individually or in the aggregate, they could reasonably be expected to influence the economic decisions of users taken on the basis of these consolidated financial statements and these parent financial statements.
| 100 | ANNUAL REPORT 2018 PART 5 INDEPENDENT AUDITOR’S REPORT
As part of an audit conducted in accordance with ISAs and the additional requirements applicable in Denmark, we exercise professional judgement and maintain professional scepticism throughout the audit. We also:
• Identify and assess the risks of material misstatement of the consolidated financial statements and the parent financial statements, whether due to fraud or error, design and perform audit procedures responsive to those risks, and obtain audit evidence that is sufficient and appropriate to provide a basis for our opinion. The risk of not detecting a material misstatement resulting from fraud is higher than for one resulting from error, as fraud may involve collusion, forgery, intentional omissions, misrepresentations, or the override of internal control.
• Obtain an understanding of internal control relevant to the audit in order to design audit procedures that are appropriate in the circumstances, but not for the purpose of expressing an opinion on the effectiveness of the Group’s and the Parent’s internal control.
• Evaluate the appropriateness of accounting policies used and the reasonableness of accounting estimates and related disclosures made by Management.
• Conclude on the appropriateness of Management’s use of the going concern basis of accounting in preparing the consolidated financial statements and the parent financial statements, and, based on the audit evidence obtained, whether a material uncertainty exists related to events or conditions that may cast significant doubt on the Group’s and the Parent’s ability to continue as a going concern. If we conclude that a material uncertainty exists, we are required to draw attention in our auditor’s
report to the related disclosures in the consolidated financial statements and the parent financial statements or, if such disclosures are inadequate, to modify our opinion. Our conclusions are based on the audit evidence obtained up to the date of our auditor’s report. However, future events or conditions may cause the Group and the Entity to cease to continue as a going concern.
• Evaluate the overall presentation, structure and content of the consolidated financial statements and the parent financial statements, including the disclosures in the notes, and whether the consolidated financial statements and the parent financial statements represent the underlying transactions and events in a manner that gives a true and fair view.
• Obtain sufficient appropriate audit evidence regarding the financial information of the entities or business activities within the Group to express an opinion on the consolidated financial statements. We are responsible for the direction, supervision and performance of the group audit. We remain solely responsible for our audit opinion.
We communicate with those charged with governance regarding, among other matters, the planned scope and timing of the audit and significant audit findings, including any significant deficiencies in internal control that we identify during our audit.
Aarhus, 5 March 2019
Deloitte Statsautoriseret Revisionspartnerselskab Business Registration No 33 96 35 56
Thomas Rosquist Andersen
State-Authorised Public Accountant MNE-no. mne31482
Nikolaj Thomsen
State-Authorised Public Accountant MNE-no. mne33276
ANNUAL REPORT 2018 | 101 | INDEPENDENT AUDITOR’S REPORT PART 5
© 2019 The
Group © 2019 KIRKBI A/S
LEGO
