Director’s Welcome


At CESTA, we are proud to support work that is collaborative, multidisciplinary, and transgenerational, and nowhere do these characteristics shine through more than in our Undergraduate Research Internship Program.
This program advances humanities research across many disciplines, pushing at the intersection between humanistic research and technology to create new knowledge in collaborations between students, faculty, graduate mentors and other researchers. During the pandemic, we continued, resiliently, this work in remote form, but there is no understating the joy, thrill, and enormous benefit of being able to work with one another in person again, as we did starting last winter and full-time this past summer.
In the summer, an unprecedented degree of flexibility was required of everyone as we adjusted to ongoing changes, from the full campus blackout in June to the occasional but sudden need for hybrid schedules. Yet the days spent collaborating together on project work, the weekly group lunches with lectures and discussions, and the various social activities, were all transformative, especially for those students experiencing this for the first time.
The design of this year’s Anthology, with its theme of transition, captures this renewed sense of energy.
This was a transitional time in many ways: Alix Keener (our digital scholarship coordinator) and I welcomed our new Center Manager, Jonathan Clark, in June and our new Associate Director, Dr. Will Fenton, in August. This meant that our program leaned all the more on the amazing work of our graduate mentors, Annie Lamar, Merve Tekgürler, Victoria Zurita and Radhika Koul, as well as on our ACLS Emerging Voices postdoc, Dr. Eric Harvey, and our program and research manager, Dr. Mae Velloso-Lyons (who also project-managed this Anthology).
As always, we are deeply grateful to our allies and friends all across campus, particularly to our partner the Stanford Humanities Center, and to our sponsors (VPUE, VPDoR, and the H&S Dean’s Office). Such generosity made it possible for us to reconstitute our community in the CESTA workspace in Wallenberg Hall, and to do the research presented in the pages of this student-designed Anthology.
ii | Center For Spatial and Textual Analysis
Giovanna Ceserani, CESTA Faculty Director
Notes from the Mentor Team

I’ve had the honor of working as CESTA’s graduate technical mentor for the past two years. In that time, I’ve watched students discover new passions, cultivate new technical skills, and work on projects from start to finish. Our interns consistently impress me with their willingness to learn and their desire to understand the impact of our research. This summer, interns met with different DH scholars at weekly Wednesday lunches, where topics ranged from making DH labor visible to game design as a pedagogical tool. Our interns brought new ideas, talents, and perspectives to their work at CESTA every day.
Annie Lamar, Senior Graduate Technical Mentor, PhD Candidate in Classics
2022 was my second summer as a graduate mentor, and I was excited to return to Wallenberg Hall after two years of being primarily remote. It was no easy transition! Our first week was spent in the dark, with a three-day-long power outage! Yet every time I walked into the office, I was thrilled to see familiar faces filling up the desks and tables. Being back in-person allowed us to build connections and friendships across projects, departments, and academic career stages. I met amazing young people with a curiosity and an eagerness that inspired me in my own work. Their energy and enthusiasm carried the program forward. My gratitude goes out to everyone who made my first in-person CESTA summer a fascinating adventure.
Merve Tekgürler, Senior Graduate Mentor, PhD Candidate in HistoryWorking on CESTA’s internship program this summer has opened new research paths for me and made me admire the intelligence, maturity, and resourcefulness of our undergraduates. It was a true pleasure to mentor them as they found their place inside their research teams, learned new skills, mastered new tools, and took their projects further than their faculty leaders expected. This truly wonderful group of students will shine through their kindness and brilliance wherever they go. Working with the other mentors taught me a great deal about digital humanities research, mentorship, and pedagogy (Annie’s stickers, unicorn eggs, and rubber chickens are unforgettable!). Thank you all!
Zurita, Graduate Mentor, PhD Candidate in Comparative Literature
This summer was my first as a graduate mentor. In retrospect, I can say without hesitation that this is one of Stanford’s truly multidisciplinary programs. CESTA’s internships foster so many projects that bring the humanities “out in the world” in tangible ways, in fields ranging from legal history to cultural preservation. As someone committed to the public humanities, the program gave me a lot of hope. The faculty were entrepreneurial and driven: each project was a reflection, in some way, of the causes closest to their hearts. The undergraduate interns brought so much joie de vivre and the raw desire to learn and contribute. It was a genuine pleasure to see these projects come to life.
Koul, Graduate Mentor, PhD Candidate in Comparative Literature Radhikacesta.stanford.edu | iii
Victoria
Contents
Table of
...........................................................14
..........................................17
................................................................18
..............................21
..............................................................23
.........24
AND
MILLENNIA
SICILIAN
........................................................................26
..............................................27
...................................................................................i Notes
..................................................................ii Behind
Design.....................................................................................1 Introducing CESTA’s 2022 Research Interns............................................3 iv | Center For Spatial and Textual Analysis
............................................29
..........................................30
.....................................32
...............................................................................33
......................................10
............................................................11
MASSIVELY MULTIPLAYER HUMANITIES.................................................13 Project Lead: Tom Mullaney Connecting Students to Archives
by Charlotte Zhu and Feiyang Kuang COMMUNITY MUSEUMS IN SOUTH AFRICA
Project Lead: Grant Parker Bringing Local History Online
by Julia Gendy EARLY CAPE MAPS..................................................................................20 Project Lead: Grant Parker Mapping the Two Journeys of Francois Le Vaillant
by Mario Nicolas JOSQUIN RESEARCH PROJECT
Project Leads: Jesse Rodin and Craig Sapp Identifying Conspicuous Melodic Repetition in Renaissance Music
by Kiana Hu SHIPWRECKS
MARITIME HERITAGE OF
OF
CONNECTIONS
Project Lead: Justin Leidwanger Bringing Archaeological Heritage Online
by Sarah Pincus Director’s Welcome
from the Mentor Team
the
SOCIAL NETWORKS IN ROMAN COMEDY
Project Lead: Hans Bork Visual Learning From Ancient Roman Plays
by Marguerite DeMarco MODERNIST ARCHIVES PUBLISHING PROJECT
Project Lead: Alice Staveley Modernist Metadata
by Natalie Wang AFRICAN ARCHIVE BEYOND COLONIZATION
Project Lead: Denise Lim Decolonizing Visual Storytelling
by Brittany Linus
MODERNIST ARCHIVES PUBLISHING PROJECT (CONT.)
Whitespace as Intentional Silence: Computational Analysis of Jacob’s Room..........................................................................................34 by Hayn Kim
EARLY CHRISTIAN AND MUSLIM NETWORKS.......................................36
Project Lead: Michael Penn Interactions in the Church of the East...................................................37 by Zelig Dov The Geography of Christian Religious Authority.................................39 by Hasan Tauha
EPICCONNECT.........................................................................................42
Project Leads: Nelson Endebo, Fyza Parviz, and Ellis Schriefer Building a User-Driven Platform............................................................43 by Pauline Ar noud, Srihari Nageswaran, and Rosalyn Bejrsuwana Prototyping a Concept: EpicConnect....................................................45 by Carlo Dino and Benjamin Ruland
MAPPING SHARED SACRED SITES.........................................................47
Project Lead: Anna Bigelow Storytelling for Spatial Data..................................................................48 by Shannon Gifford
SCOFFLAWS AND DEBT COLLECTORS..................................................50
Project Lead: Destin Jenkins A Deep Dive into the Archive................................................................51 by Fer nando Bravo
SENEGALESE SLAVE LIBERATIONS PROJECT........................................53
Project Leads: Richard Roberts and Rebecca Wall Historical Data for Public Use................................................................54 by Stephanie Perez
ORAL HISTORY TEXT ANALYSIS PROJECT.............................................56
Project Leads: Estelle Freedman and Natalie Marine-Street The Oral History of Sexual Harassment................................................57 by Camellia Ye Protecting Sensitive Data......................................................................59 by Benjamin Ruland
PANIC AND PANDEMIC...........................................................................60
Project Lead: Laura Stokes The Language of Plague Outbreaks in Early Modern Germany..........61 by Niloufar Davis
VIETNAMESE REFUGEE ARCHIVE EXHIBIT.............................................62
Project Lead: Kelly Nguyen A Platform to Preserve Fragmented Histories.....................................63 by Elisa Lopez and Marguerite DeMarco
TEXT TECHNOLOGIES............................................................................65
Project Lead: Elaine Treharne Computer Vision for Mortuary Rolls.....................................................66 by Nikita Bhardwaj A New Approach to OCR for Medieval Scripts....................................68 by Sera Wang
cesta.stanford.edu
| v
TEXT TECHNOLOGIES (CONT.)
A Flexible Database of Medieval Scribes.............................................70 by Julia Fischer Building a Digital Version of a Manuscript Catalog.............................71 by Eren Yurek and Sera Wang
A New Platform for “Digging Deeper”................................................73 by Ronit Jain
OBELISKS OF SOUTH AFRICA................................................................74
Project Lead: Grant Parker Digitizing South Africa’s Obelisks.........................................................75 by Junah Jang
WARHOL’S PHOTO ARCHIVE..................................................................77
Project Lead: Peggy Phelan
Capturing Fleeting Moments in the Andy Warhol Photo Archive......78 by Arethea Ann Sian Lim
GRAND TOUR PROJECT.........................................................................80
Project Lead: Giovanna Ceserani
Visualizing Family Connections..............................................................81 by Nicholas Clark
Investigating Equity in Grand Tour Data...............................................83 by Sarah Pincus Improving a Data-Driven Map...............................................................85 by Eliot Jones Automatic Transcription of 18th-Century Travel Journals...................86 by Margot Hutchins
VISUALIZING THE TRIALS OF SLAVERY AT THE CAPE...........................88
Project Lead: Grant Parker Mapping the Paths of Escaped Slaves..................................................89 by Fiona Clunan
OPENGULF...............................................................................................91
Project Leads: Nora Barakat and David Wrisley Creating a Gazetteer of the 20th Century Gulf: Data Disambiguation..............................................................................92 by Defne Genç, Atash Heil, Rhea Kale, Mohammed Khalil, Enkhjin Munkhbayar, and Khosiyat Oripova
Multilingual Text Research on the Gulf.................................................94 by Defne Genç, Atash Heil, Enkhjin Munkhbayar, and Khosiyat Oripova Handwritten Text Recognition for Arabic.............................................96 by Mohammed Khalil
SUSTAINING THE HUMAN RECORD......................................................98
Project Leads: Elaine Treharne and Kathryn Starkey
Connecting Sustainability and the Humanities in the Classroom........99 by Eren Yurek
DIGITAL LEGAL HISTORIES PROJECT...................................................101
Project Leads: Amalia Kessler and Brent Salter The Evolution of Guild Agreements....................................................102 by Hong Le Xuan Vo
vi | Center For Spatial and Textual Analysis
MAPPING THE AEGEAN........................................................................104
Project Lead: Benedetta Bessi Georeferencing a 15th-Century Guide to the Greek Islands.............105 by Jennifer Luo
DIGITAL HUMANITIES GRADUATE FELLOWSHIP ................107 Program Directors: Eric Harvey and Mae Velloso-Lyons The Evolving Psalter.............................................................................108 by Eric Harvey Capturing Formal Innovation in Medieval Fiction..............................109 by Mae Velloso-Lyons Style and Language Amid the Fragments of Early Latin Literature...............................................................................................110 by Brandon Bark Foundations for the Alpheios Research Lab.......................................111 by Annie K. Lamar Return to Realism? Comparing 19th- and 21st-Century Novel Forms..........................................................................................112 by Zuza Leniarska Imperial Vocabulary: Public Political Discourse of Trans-Pacific Japan, 1868-1912.................................................................................113 by Andrew Nelson Raiding the Wordhoard: Recurring Alliterative Collocations in Old Norse Eddic Poetry.......................................................................114 by James Parkhouse Fear in the Archive: Ethnographic Concepts in Immigration Judges’ Decisions.................................................................................115 by Valentina Ramia A Different Kind of Chinese Empire: The City Networks of Chu (c. 350–c. 100 BCE).......................................................................116 by Dewei Shen Subverting Imperial Narratives................................................117 by Lydia Wei Encoding the Postcolonial in Place......................................................118 by Carmen Thong
cesta.stanford.edu
| vii
Updates on Other Projects and Programs..........................................119 CREDITS Mae Velloso-Lyons Managing Editor Annie K. Lamar Editor Dillon Gisch Editor Zelig Dov Designer Stephanie Perez Designer © 2022
FOR SPATIAL AND TEXTUAL ANALYSIS
CENTER
FOURTH FLOOR, WALLENBERG HALL (BLDG. 160) 450 JANE STANFORD WAY, STANFORD, CA 94305-2055 cesta.stanford.edu • @cesta_stanford • cesta_stanford@stanford.edu
Behind the Design
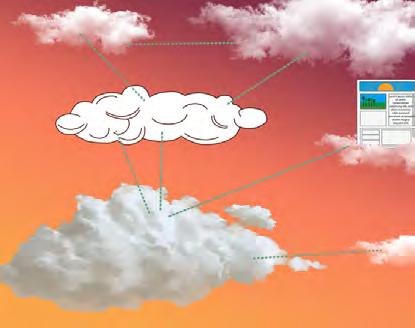
By Stephanie Castaneda Perez and Zelig Jacob DovFor this year’s Anthology, we wanted to portray the idea of transition.
Both CESTA in particular and the workspace in general have been sites of transition over the pandemic. There is an almost ironic aspect to this supercharged fusion of the digital and physical realms, given CESTA’s identity as a home for the digital humanities. Little did we know that thinking and working digitally would subsume every line of intellectual inquiry through the past few years. As we transition back into in-person work, we find ourselves hybridizing some of the digital with the style of work we practiced before—we use the best of both. This is the ethos of the digital humanities (DH), which recognizes both the affordances of a physical book and a computer’s capacity to sift through its words. Transition, then, is not necessarily forward-facing but a place of reconciliation, where each side blends into the other.
What resulted from this idea is a visual story made of two key elements.

The first is a set of icons, each representing a different way of doing DH research: rendering maps using geographic information systems (GIS), digitizing primary sources, creating data visualizations, and more.
The second element is the color palette, which was adapted from the CESTA palette using the official Stanford accent colors. Starting with light peaches and mints and ending with deep purples and oranges, the color story is representative of the transition from late summer to the beginnings of fall.

1 | Center For Spatial and Textual Analysis
Cloud icons bridge these two elements, evoking both clouds in their natural form as well as “the cloud” as jargon for the digital. The cover brings it all together, connecting these ideas through lines resembling those of the CESTA logo. They create a dreamscape of sky—linked entities almost like constellations. Summer to fall, day to night, physical to digital and back to physical again—transition.
A brainstorm of the cover featuring early renderings of clouds and icons.
These elements also serve a thematic purpose within the Anthology. Notice how they come together in the margins of each faculty project: margin color visually distinguishes each project from the next, and icons are “activated,” or highlighted, on every page to indicate which DH method(s) are most prominently used by each respective project.

Archival Research Text Analysis Mapping GIS Computer Vision Networks Quantitative Analysis Data Visualization Public Humanities Database Creation Digitization and HTR AI: Machine Learning Historical Analysis Spatial Analysis Web Development Digital Editions Pedagogical Resources Digital Tool Creation Digital Exhibitions cesta.stanford.edu | 2
Introducing CESTA’s 2022 Undergraduate Research Interns
Anthony Bui
is a senior majoring in Classics with minors in Philosophy and Art History. This summer, he helped Prof. Jenkins on his project Scofflaws and Debt Collectors, examining how race, injustice, government, and corporations were involved in peoples’ refusal to pay parking tickets in LA and Chicago in the late 1960s. He also worked with Brandon Bark on his project for the Digital Humanities Graduate Fellowship, Style and Language Amid the Fragments of Early Latin Literature.
is a sophomore majoring in Art History and Psychology. Arethea is passionate about preserving the stories and legacies of those who have come before us. She is a strong believer in the integration of the arts and sciences. On top of her academic interests, Arethea is a visual artist and pursues both painting and design work. During her CESTA internship, she worked with Prof. Phelan on the Warhol’s Photo Archive project.
Arethea Ann Sian Lim

is a sophomore with interests in Geophysics and Anthropology. This summer, he interned on the OpenGulf project, where he worked to disambiguate historical data about Iran’s Persian Gulf region and researched Persian gazetteers of the Qajar era.


Atash Heil
Benjamin Rulandis a non-traditional transfer student majoring in Computer Science. During his internship at CESTA, he divided his time between two projects: EpicConnect and the Oral History Text Analysis Project (OHTAP). Before coming to Stanford, he worked at Evoke Wilderness therapy and as an independent carpenter. Some of his many hobbies include reading fantasy fiction, playing soccer, and hiking with his partner.
Brittany Ozioma Linus
is pursuing a B.S. in Symbolic Systems and a Notation in Cultural Rhetorics through Stanford’s Program in Writing and Rhetoric (PWR). During her CESTA internship, she supported Dr. Lim’s project, African Archive Beyond Colonization, by designing the interface for a virtual archive of African artifacts. In her free time, she can be found walking the main quad with speaker in hand, enjoying the theme song for the anime she is watching.
is a junior majoring in English and Economics. Her interdisciplinary interests include environmental economics and justice, early modern and Renaissance literature, creative writing, and Chinese and Japanese novelists. At CESTA, she worked on coding and data visualization for the Oral History Text Analysis Project (OHTAP). In her free time, she plays the cello in Stanford’s Symphony Orchestra and is involved in the Stanford Storytelling Project.
Camellia Yeis a sophomore majoring in Computer Science, with an interest in Human-Computer Interaction. During his time at CESTA, he worked with Nelson Endebo, Fyza Parviz, and Ellis Schriefer on the EpicConnect project, which promotes collaboration between community college instructors. His role primarily focused on constructing the frontend of the website and connecting it to the server.
Carlo Dino3 | Center For Spatial and Textual Analysis
is a sophomore with interests in linguistics and religious studies. She used her years of Hebrew study to read and classify Hebrew biblical manuscripts with Dr. Harvey on the Evolving Psalter project.
 Chana Lanter
Charlotte Zhu
Chana Lanter
Charlotte Zhu

is a sophomore from Suzhou, China, double majoring in Computer Science and East Asian Studies. She is interested in East Asian languages and cultures, history, and digital humanities. At CESTA, she worked with Prof. Mullaney on the Massive Multiplayer Humanities project. In her free time, she enjoys visiting museums, creative writing, and singing.
 Defne Genç
is a rising junior majoring in Symbolic Systems with a minor in Ethics and Technology. For her internship with the OpenGulf project, she worked on disambiguating the Seyahatname and Lorimer texts. In her free time, she enjoys trying local food and coffee, exploring new cities, and listening to classic rock music.
Eliot Jones
is a junior majoring in Data Science, with interests in social networks and visualizing spatial data in order to help contextualize the past. This summer, he worked with Prof. Ceserani on the Grand Tour Project, assisting with preparations for the publication of the Grand Tour Explorer, a tool to explore data about travelers on the Grand Tour.
 Elisa Lopez
is a junior double majoring in Political Science and Classics with a minor in Religious Studies. During her internship at CESTA, she worked with IDEAL Provostial Fellow Dr. Nguyen on the Vietnamese Refugee Archive Exhibit in collaboration with the Việt Museum in San Jose. The result of that project is a digital exhibit about the museum, the Vietnam War, and the experiences of Vietnamese refugees which aims to center and directly incorporate Vietnamese perspectives.
is a junior majoring in Mathematical and Computational Science with a minor in History. During his CESTA internship, he assisted Dr. Hodge on the Women in Provenance project. He is passionate about uncovering the stories that lie behind raw data and turning them into actionable, predictive information. In future, he hopes to pursue a master’s degree in Statistics and Data Science.
Emir Kirdan Enkhjin Munkhbayaris a sophomore from Mongolia with interests in data science, digital humanities, and international relations. She worked with Prof. Barakat on the OpenGulf project to analyze data from John G. Lorimer’s Gazetteer of the Persian Gulf, Oman and Central Arabia. She also worked to incorporate historical texts in Russian into the project’s database in order to create data which is representative of the Gulf region’s multilingual and multicultural identities.
 Eyup Eren Yürek
is an undergraduate student in Comparative Literature and a coterminal student in German Studies. He has interests in early medieval religious texts and songs, manuscript studies, 20th-century poetry and Jewish thought, and song traditions and orality within the Persianate world. At CESTA, Eren worked on the Text Technologies project and on Sustaining the Humanities, where he helped design syllabi for new courses on sustainability and the humanities.

cesta.stanford.edu | 4
Feiyang Kuang
is a sophomore interested in Comparative Literature, History, and Philosophy. This summer, she worked on Prof. Parker’s Early Cape Maps project, using the travel notes of the 18th-century Dutch traveler Hendrik Swellengrebel to map the route he took during his voyage through South Africa.

is a rising sophomore with academic interests in Symbolic Systems and Comparative Literature. The interdisciplinary nature of both of these fields is what drew him to become involved in the digital humanities, excited by new ways to research seemingly old questions. This summer he worked on the Scofflaws and Debt Collectors project led by Prof. Jenkins.
Fernando Bravo Fiona Clunanis a sophomore from Virginia majoring in Classics and International Relations with a minor in Modern Languages. This year, she worked with Prof. Parker on Visualizing the Trials of Slavery at the Cape, a project which focuses on South Africa during the Dutch colonial period. Outside of CESTA, Fiona is involved in the Society for International Affairs at Stanford and the Aisthesis Classical Journal.
Hasan Tauhais a sophomore transfer student majoring in religious studies with an interest in early Islamic history. At CESTA, Hasan worked on Prof. Penn’s project on early Christian-Muslim relations. Hasan’s interest in Prof. Penn’s research stems from the manner in which it problematizes entrenched narratives about early Islam, such as the idea that there was an immediate clash between Christians and Muslims. Hasan hopes to conduct similar research in the future.
 Hayn Kim
(they/she) is a rising senior majoring in Comparative Literature and minoring in Mathematics. As an intern for Dr. Staveley’s Modernist Archives Publishing Project (MAPP), Hayn investigated Woolf’s use of whitespace in the novel Jacob’s Room. Over the course of the summer, they engaged in an individual literary seminar with Dr. Staveley and used R, Python, and Tableau for text analysis.
Hong Le Xuan Vo
is a rising junior majoring in Symbolic Systems. As a CESTA intern, Hong worked with Dr. Salter on the Digital Legal Histories Project, which examines changes over time in the union agreements of the Dramatists Guild of America.

is a graduating senior majoring in Computer Science with a concentration on Human-Computer Interaction. This spring, she worked with Dr. Bessi on Mapping the Aegean, a project which brought together her interests in design, history, and computer science. She has previously interned at the Superior Court of the District of Columbia, Instituto Sivis, and the Stanford Center for Philanthropy and Civil Society, and hopes to pursue a career at the intersection of humanities and technology.
Jennifer Luois a junior majoring in International Relations. At CESTA, he worked on the Josquin Research Project under Prof. Rodin and Prof. Sapp. This project utilizes mapping software to track the comings and goings of famed Renaissance composer Josquin des Prez.
5 | Center For Spatial and Textual Analysis
Jonathan Pak
Julia Fischer
is a sophomore from the Chicago area planning to major in Mathematical and Computational Science and minor in Psychology. At CESTA, Julia worked on the Text Technologies project. Julia is also involved with Stanford’s Innovative Styles contemporary dance group and Women in Computer Science.
Julia Gendyis a sophomore majoring in Political Science and Comparative Studies in Race and Ethnicity. She is interested in history and art and passionate about social change through community organization and education. Her work with Prof. Parker on the Community Museums project involved collaboration with museums in South Africa to create digital educational tools that promote community engagement with history.
Junah Jang(she/her) is a sophomore from the Seattle area majoring in Public Policy. She is excited by applications of data science to social issues. At CESTA, she worked with Prof. Parker on the Obelisks of South Africa project. Outside of school, she loves live theater, gardening, hiking, well-organized spreadsheets, and good tofu recipes.
Katherine Wang
is a sophomore from DC and Boston studying Symbolic Systems with minors in Dance and Environmental Justice. This spring, she worked with Digital Humanities Graduate Fellow Carmen Thong on the project Encoding the Postcolonial in Place. In addition to the digital humanities, Katherine enjoys reading and performance art.
Khosiyat Oripovais a sophomore majoring in International Relations with interests in digital humanities and history. She worked with Prof. Barakat on the OpenGulf project, which focuses on historical documentation about the Gulf and is a joint effort between Stanford and NYU Abu Dhabi. This summer, she worked on the Lorimer dataset and researched Russian texts about the context and impact of the Russian Empire and Soviets on the Gulf.
Kiana Huis a senior studying Classics and Archaeology. This year, she worked with Prof. Rodin and Prof. Sapp on the Josquin Research Project to refine digital music analysis tools that can be used to identify unique elements of Renaissance music composed by Josquin des Prez, as well as generating visual plots within the program.
Lydia Wei(she/her) is a junior majoring in English with a concentration in Creative Writing. As a CESTA intern, she collaborated with Digital Humanities Graduate Fellow Dewei Shen on his project analyzing the development of the Chu Empire, A Different Kind of Chinese Empire: The City Networks of Chu (c. 350–c. 100 BCE). She is from Gaithersburg, MD, and loves fruit popsicles.
Margot Hutchinsis a rising sophomore from Connecticut tentatively majoring in mathematics and religious studies. She is passionate about combining the tools of STEM with the liberal arts, which corresponds wonderfully to her work transcribing and analyzing historical journals as an intern on Prof. Ceserani’s Grand Tour Project.


cesta.stanford.edu | 6
Marguerite DeMarco
is a sophomore interested in Classics, Comparative Literature, and Art History. She worked with Dr. Nguyen on the Vietnamese Refugee Archive Exhibit and Prof. Bork on the Social Networks in Roman Comedy project. In the course of her internship, she created a digital exhibit for the Việt Museum and analyzed the social networks in several Roman plays.

is a junior majoring in Urban Studies with a concentration in Urban Sustainability. He is interested in transportation and energy policy and creating equitable urban systems. This summer, he worked with Prof. Parker on the Early Cape Maps project to map the travels and discoveries of naturalist and ornithologist Francois Le Vaillant through the interior of South Africa.
 Mario Nicolas
Miranda Liu
is a senior majoring in English, who enjoys using her analytical and technical skills to further humanistic inquiries. She previously interned on the project Counter-Surveilling the State, where she appreciated working on research to benefit minoritized communities. That theme continued this year with her work on Digital Humanities Graduate Fellow Valentina Ramia’s project Fear in the Archive, which studies judicial bias in immigration decisions.
is a rising senior majoring in Computer Science. A returning intern at CESTA, he began working with Prof. Barakat on the OpenGulf project in early 2021. His role involves building Optical Character Recognition models to automatically transcribe handwritten Arabic texts as well as digitizing and publishing open-source historical texts from the Arab Gulf.
Moe Khalil Natalie Wangis a rising sophomore interested in Symbolic Systems, law, and classical literature. During her internship, she worked with Dr. Staveley on the Modernist Archives Publishing Project (MAPP). Outside of CESTA, she is a member of Stanford’s Theater Lab and has experience in creative writing and legal research.

 Nicholas Clark
is a graduating senior with a major in Mathematical and Computational Science and a minor in Classics. In his work on the Grand Tour Project, he has pursued new ways to detect and represent meaningful connections within the project’s dataset, such as family trees for travelers. Nick is passionate about the human deep past and excited to apply his technological knowledge to advance its study.
 Nikita Bhardwaj
is a sophomore majoring in Symbolic Systems with interests in digital humanities, linguistics, and computer science. She worked with Prof. Treharne and Dr. Fafinski on the Medieval Networks of Memory sub-project of Text Technologies, where she learned about computer vision methods and female literacy in 13th-century England.
is a freshman from London studying History and Political Science. She has an acute interest in gender history and has worked on computer science research in the past. At CESTA, Niloufar had the opportunity to merge these interests as she worked with Prof. Stokes on the Panic and Pandemic project.
 Niloufar Davis
7 | Center For Spatial and Textual Analysis
Pauline Arnoud
is a junior majoring in Computer Science and minoring in Education. She worked with Nelson Endebo, Fyza Parviz, and Ellis Schriefer on the EpicConnect project to build a website to help foster collaboration and community amongst community college professors. She is passionate about using technology to make education more accessible and enjoyable.
Poojit Hegde
is a senior majoring in Mathematical and Computational Science and double-minoring in History and Comparative Studies in Race and Ethnicity. His interests include the history of race and capitalism, colonialism and decolonization, and data science. Outside of his studies, he is active in political organizing.
 Rhea Kale
is a junior from Dubai who is double majoring in Economics and History. She is passionate about global and colonial history, particularly relating to South Asia and the Middle East. To pursue this interest further, she worked with Prof. Barakat on the OpenGulf project, where she was able to deepen her interest in Gulf history whilst developing a new interest in the digital humanities.
 Ronit Jain
is a junior from Seattle, WA, studying English and Biocomputation, who worked on the Text Technologies project with Prof. Treharne. Ronit is broadly interested in the digital humanities, the modernist novel, and representations of otherness in the Western imagination. Outside of research, Ronit enjoys reading, exploring beaches and forests, and biking!
Rosalyn Bejrsuwanais a sophomore at Pasadena City College majoring in Political Science and Law, Public Policy, and Society. She has worked as a legislative intern under Senator Tammy Duckworth on Capitol Hill, where she contributed to amendments to the For the People Act of 2021 to expand ballot access for underrepresented communities. At CESTA, she worked on the EpicConnect project. In her free time, she likes to knit and rock climb.
 Salma Kamni
is a sophomore studying Product Design with an interest in data science. Last year, she interned on the Global Medieval Sourcebook project and co-designed the CESTA Research Anthology. This year, as a returning intern, she worked with Prof. Bork on the Social Networks in Roman Comedy project.


 Sandi Kine
(any/all) is a sophomore from Arcadia, CA, studying East Asian Studies and Science, Technology, and Society. Sandi’s research interests are in digital anthropology, technology and carcerality, surveillance, and envisioning abolitionist futures. At CESTA, Sandi assisted Digital Humanities Graduate Fellow Andrew Nelson on his project entitled Imperial Vocabulary: Public Political Discourse of Trans-Pacific Japan, 18681912. Sandi loves to read, knit, crochet, and paint in their spare time.
is a rising senior majoring in Classics and History. She is particularly fascinated by the status of women in Classical Antiquity. At CESTA, she worked on Prof. Leidwanger’s Shipwrecks and Maritime Heritage project, which explores the cultural history, archaeology, and environment of Southeast Sicily. She also assisted Prof. Ceserani on the Grand Tour Project. For that project, Sarah learned about data journalism and researched the often overlooked women who embarked on Grand Tours.
Sarah Pincuscesta.stanford.edu | 8
Sarina Rye

is a freshman currently interested in Sociology and Earth Systems (but even more interested in exploring new subjects each quarter!). At CESTA, Sarina worked with Prof. Roberts on the Senegalese Slave Liberations Project. In her free time, Sarina often writes poetry, plays her ukulele, and talks to her aunt and cat back home in Sacramento.
Sera Wang
is a rising sophomore majoring in English and minoring in Philosophy. Over the summer, she worked on two subprojects under the Text Technologies umbrella, spending half of her time renewing Ker’s Catalogue to make it more accessible to researchers and students and half her time on text recognition in medieval tituli. Outside of CESTA, she is a member of Caesura, Stanford Speakers Bureau, and Stanford Women’s Frisbee Team Firefly.
is originally from Seattle, WA, and is majoring in History with minors in Creative Writing and Archaeology. All these disciplines give Shannon the opportunity to study storytelling in a variety of forms. At CESTA, Shannon worked with Prof. Bigelow on the Shared Sacred Sites project, which uses different types of maps to represent shared sites around the world.
 Shannon Gifford
Shengming Ling
Shannon Gifford
Shengming Ling
is a sophomore interested in the intersection between philosophy and literature. This summer, Shengming worked with Prof. Alessandrini on the project Considering Disabilities in Online Cultural Experiences. Shengming worked to develop a database prototype which can contain, index, and draw out relationships between existing publications concerning disabilities and the arts.
Srihari Nageswaran
is a sophomore studying Comparative Literature. For his internship at CESTA, he worked with Nelson Endebo, Fyza Parviz, and Ellis Schriefer on the EpicConnect project. He focused primarily on the site’s UX/UI design, using interviews with Stanford’s EPIC fellows to help prepare EpicConnect’s launch.
 Stephanie Castaneda Perez
(she/her) is a rising senior majoring in History with a minor in Art Practice. She is especially interested in contemporary transnational history, particularly cultural history within immigrant groups in the United States. This summer, she worked on the Senegalese Slave Liberations Project with Prof. Roberts, helping to translate, transcribe, and analyze colonial registers of slave liberations in French West Africa.
Victor Cheruiyotis a graduating senior majoring in Computer Science. He is interested in statistics, storytelling, and African history, and hopes to use his skills in technology to develop a better understanding of human history. This spring, he worked with Digital Humanities Graduate Fellow Andrew Nelson on a project entitled Imperial Vocabulary: Public Political Discourse of Trans-Pacific Japan, 1868-1912. In his free time he is a keen mobile developer.
Zelig Dovis a sophomore with interests in history and comparative literature. He worked with Prof. Penn on the Early Christian and Muslim Networks project doing data cleanup and social network analysis for a ninth-century text, The Book of Governors by Thomas of Marga. Zelig also created visualizations regarding Timothy I, the Nestorian Patriarch, for Prof. Penn’s upcoming book project on global Christianity in the Church of the East.
9 | Center For Spatial and Textual Analysis
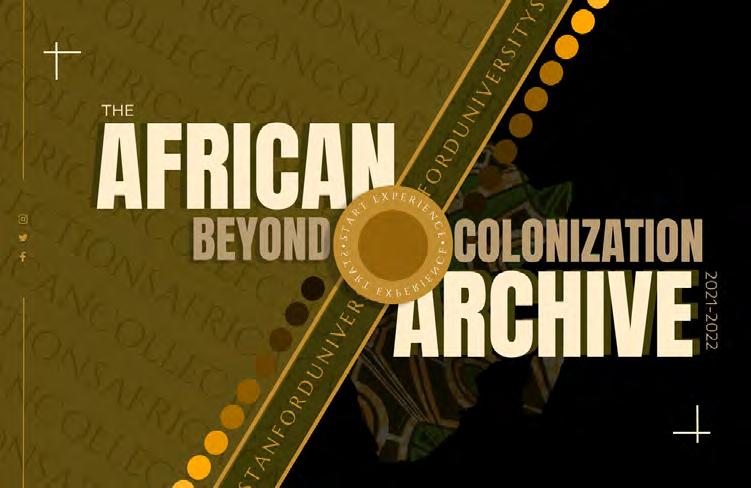
African Archive Beyond Colonization
The landing page for the “African Archive Beyond Colonization” virtual exhibition for the 2021-2022 academic year. This page was designed and implemented on the archiving platform by Brittany Linus.
Project
Description Denise Lim, Mellon Postdoctoral Research Fellow at The New School’s Parsons School of Design (at Stanford 2021-22)
This project was part of a new initiative that aimed to rehabilitate and recenter the African collections held in the Stanford University Archaeology Collections. Alongside BIPOC Curatorial Postdoc Dr. Denise Lim, students were invited to conduct in-depth research on 15 African objects from Angola, the Democratic Republic of the Congo, Egypt, Ethiopia, Kenya, Nigeria, the Sudan, South Sudan, and South Africa. In a course cotaught by Dr. Lim and Prof. Sarah Derbew, “The African Archive Beyond Colonization” (Fall 2021), students prototyped a virtual exhibition that archived their research contributions and served as a digital complement to the on-site exhibition, Reimagining African Borders Through Cultural Objects, which is currently on view at the Stanford Archaeology Center until May 2023.
cesta.stanford.edu | 10
Decolonizing Visual Storytelling
by Brittany LinusAs a diasporic African woman with a keen interest in visual storytelling, I leveraged my technical design experience, creative problem-solving skills, and academic interest in cultural rhetoric to contribute to this project in both its form and its function.
I participated in Prof. Derbew and Dr. Lim’s class, “African Archive Beyond Colonization,” where I was introduced to the complex social constructs underpinning the tensions between European, American, and African views of archaeological and ethnographic practice. Uncovering these tensions involved more than simply reading research papers: Dr. Lim and Prof. Derbew showed us how these tensions also manifest in journals and museums.
Being the lead user-interface designer for the “African Archive Beyond Colonization” virtual archive allowed me to merge my interest in visual storytelling with my appreciation for African craftsmanship as I helped provide an effective digital context for the objects researched by the students. This virtual archive is a part of a larger decolonial movement occurring within the digital humanities
An official acknowledgment from Stanford’s Archaeology Center recognizing that Stanford’s digital ecosystems depend on indigenous American and African communities. This acknowledgment fosters accountability within the Stanford community. It reminds all visitors to the virtual exhibition to actively challenge their colonial knowledge structures when viewing exhibited artifacts.

11 | Center For Spatial and Textual Analysis
and involving the narratives of marginalized or underrepresented communities within academia.
With Dr. Lim’s guidance, I began constructing the virtual archive to house the complete collection of the course’s student-curated virtual exhibitions. First, I compiled a research document containing detailed descriptions of the African artifacts and corresponding student
The
have
designed
curators. Since the curators did not all create their virtual exhibitions using the same platform, I decided to screen record and screenshot the virtual exhibitions to maintain the creators’ intellectual integrity. This tactic ensured seamless continuity between all the exhibitions on the platform. Engagement is critical with digital platforms intended to educate users, so I balanced text with interactive visuals. Assembling the virtual archive was a rigorous exercise. I exercised radical hesitation, juxtaposition, and critical citation to produce a paradigm-unsettling experience of engagement with African history through the artifacts featured in the archive.
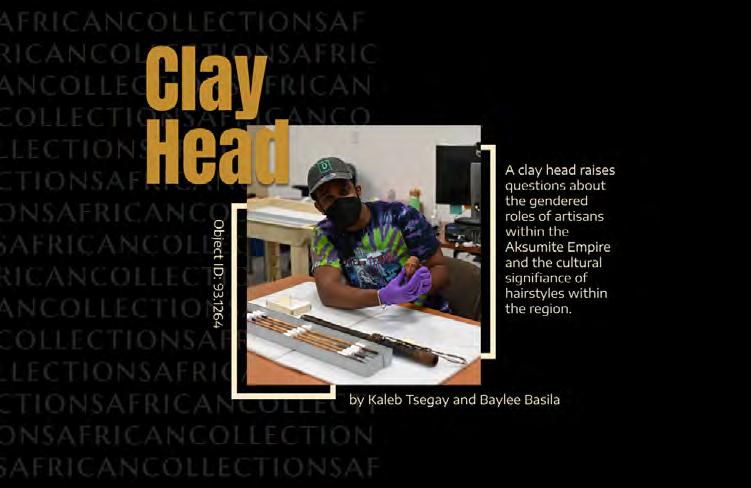
landing page for the “Clay Head” virtual exhibition curated by Kaleb Tsegay and featured on the archive website. All exhibitions featured in the virtual archive landing pages by Brittany Linus, which introduce visitors to the artifacts and student curators.cesta.stanford.edu | 12
Student Researcher Brittany Linus
Massively Multiplayer Humanities
A map showing the locations of archives and special collections within the US. The map is shown within the QGIS user interface. On this map, the blue dots represent libraries and the green dots represent zip code reference points.

Every person in the United States lives within close proximity to one or more of the country’s thousands of archives and special collections. As evidenced by our experience here at Stanford, however, the vast majority of these archives—along with their one-ofa-kind materials—go unused by high school students, college students, and members of local communities. The digital mapping project that our interns worked on is part of the second phase of the “Massively Multiplayer Humanities” initiative. In its seventh year, the program has been designed to upstream, scale-up, and diversify the hands-on research experience within the humanities and social sciences. Having developed a successful method here at Stanford, one which exposed more than 1000 Stanford undergrads to handson archival work for the first time, the project is poised to expand the model both nationally and globally.
Description Tom Mullaney, Professor of History13 | Center For Spatial and Textual Analysis
Project
Connecting Students to Archives
by Charlotte Zhu and Feiyang KuangOur work at CESTA spanned two mapping projects under the umbrella of the Massively Multiplayer Humanities. The first project involved mapping Chinese archives, and our primary contribution was brainstorming user needs and website design in order to create a directory website that would be more than a functional manual. In particular, we worked to present visual and geographic information in ways that would be meaningful for both researchers and those interested in meta-archival data. We also explored ways of incorporating existing databases, including physical catalogs and digital indices like JSTOR and Google Scholar.
The second project involved the development of a website for Prof. Mullaney’s summer course on graphic novels and world history. This
A map of the locations of archives and special collections in the California Bay Area. The map is shown within the QGIS user interface. On this map, the blue dots represent libraries, the green dots represent zip code reference points, and the green lines show the boundaries of each zip code area.
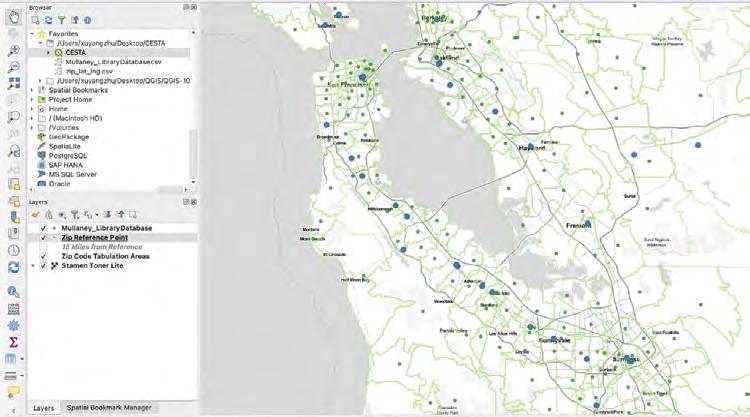
course aims to encourage students to do research in local, underexplored archives. To this end, we worked to synthesize and map location data for special collections, so that course participants could be connected with archives in their geographic vicinity.
There are over sixteen thousand public libraries in the US, but students make little use of the available resources. As a consequence of COVID-19, a large proportion of college summer programs have
cesta.stanford.edu | 14
A map showing a close-up view of the locations of archives and special collections in a specific area. On this map, the blue dots represent libraries and the green dots represent zip code reference points. The zip code reference point is the geographic center of a particular zip code. The transparent green circles show a 15-mile radius from the zip code reference point, giving us a straightforward way to determine how many libraries are accessible from each zip code.

gone fully remote, meaning that students now face even more difficulty in utilizing the library resources colleges have to offer. The goal of our project was to build an online map and a search engine that would offer information about the closest libraries and how to access them. The map would contain all national public libraries and archives, and the search engine would take in the user’s ZIP code and return all library resources within a selected distance. With the launch of the website, students would be able to identify library and archives close to their current location and access them more conveniently.
The first step was to create a base map of all libraries and archives. We completed self-guided QGIS and ArcGIS workshops, which gave us the skills we needed to create a visual map from the available CSV data. We made an initial mapping of the public libraries using a dataset provided by Prof. Mullaney. However, this dataset was limited to large, public libraries and was not comprehensive for smaller, local resources. We therefore supplemented it with statebased data, such as the Online Archive of California. We are currently in the process of harvesting additional locations from the web and converting course participants’ ZIP codes into geographic locations before mapping them.

15 | Center For Spatial and Textual Analysis
Student Researcher Charlotte Zhu
In addition, we added postal code areas to the plot with ZIP Code Tabulation Areas data from the United States Census Bureau, which maps out the geographic area of each ZIP code. This clarifies the boundaries of each region. The ZIP code areas are typically not in regular geometric shapes, and clarifying the boundaries helps people better understand the distance between the library or archive and their own location.
Through working on these two projects with Prof. Mullaney, we developed skills in two mapping softwares (QGIS and ArcGIS), enhanced our understanding of product design, and familiarized ourselves with libraries and archival resources in China and the US. Future steps in this project may include the development of a search engine or the addition of more library information to the dataset. Finally, we need to find a way to show only one circular area that directly corresponds to the ZIP code we want, as the current map shows all circular areas in one layer, which can be confusing when there are multiple next to each other.
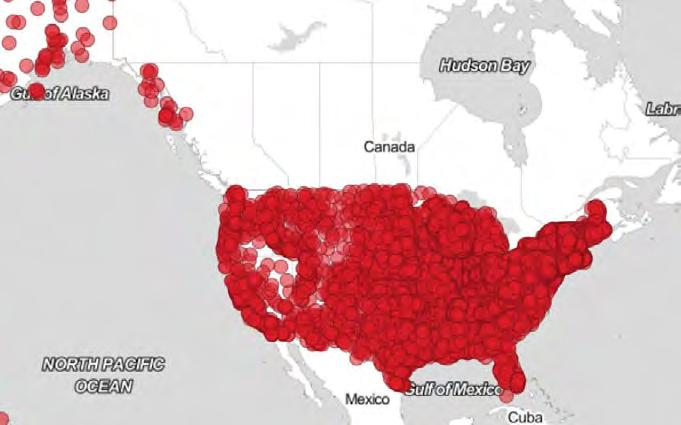
A map, generated using QGIS, showing the territory of North America, with special collections and library archives available in the US marked with a red dot.
cesta.stanford.edu | 16
Student Researcher Feiyang Kuang
Community Museums in South Africa
Grant Parker, Associate Professor of ClassicsBefore the pandemic, South Africa could boast more than 400 publicly-advertised museums. Not all will have survived COVID-19. Most imperiled are the smaller museums, often curated by volunteers with minimal funding. Our goal is to promote the digital visibility of community museums, here defined as those representing the histories of specific communities. Such museums are important because they contain the stories of local communities, more granular than those found in state-run museums, which typically recount the official grand narrative of nationhood. In collaboration with curators, we are building digital platforms for community museums. As a pilot, we have focused on the Pniël Museum and the Elim Museum, both on former mission stations in the Western Cape.

17 | Center For Spatial and Textual Analysis
A screenshot of the user interface of Audacity, the software that we used to create short podcasts with the museum curators.
Project Description
Bringing Local History Online
by Julia GendyThis past summer, I worked to create a digital platform for two community museums in South Africa. We collaborated with the Pniël Museum and the Elim Heritage Center in the Western Cape to create ArcGIS StoryMaps that include a history of the towns as mission stations, insight into the communities now, a gallery showcasing the museums’ contents, and samples from interviews we conducted with the curators. We hope the resulting StoryMaps platform will continue to expand and be used by other community museums in South Africa and beyond.
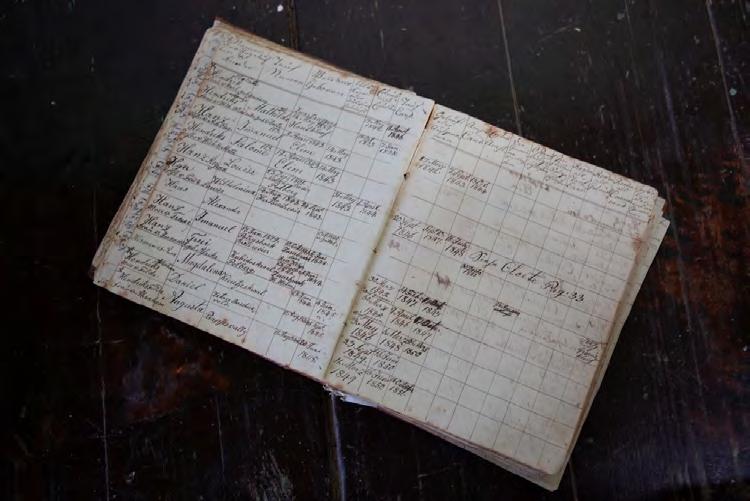
A birth register for the year 1824 from the Elim heritage records. This is an example of the type of artifacts this project hopes to present in an accessible digital format.
During the early stages of this project, it was crucial to build an understanding of the history of South Africa in order to understand its current landscape. I studied a range of sources for a comprehensive introduction to South African history, focusing on the conquest of the land by European powers that created a capitalist nation and entrenched the interests of settlers. I also analyzed works on museums and memory in order to begin building a framework for how online tools can empower the local communities we’re working with and give a voice to the residents, especially the curators.
cesta.stanford.edu | 18
Addressing all these elements helped us move closer to answering the question of how we could work to create a representation of South African history through the lens of its community museums. However, that question could not have been fully answered without our community partners’ insights.
The next steps involved close collaboration with the museum curators at Elim and Pniël. Prof. Grant Parker’s work in South Africa consisted of building a close, trusting relationship with these curators and getting a sense of their goals for this project. We collected photographs of each town, its community, church, and museum exhibits. I then embedded these photographs into StoryMaps to better convey a sense of the character of each museum.
We also wanted to give the curators a voice in the story and to share their inspiring journeys with the public. We conducted interviews over Zoom with both curators to gain a sense of the museums’ priorities and their goals moving forward. We were interested in learning how the museums came to be, who the founders were, and what challenges the museums are currently facing. Understanding this context helped us create online presences that can serve as promotional and educational tools for community museums which are often overlooked due to lack of funding. We hope the platform we are building will serve as a template for other community museums that are looking for accessible ways to share their stories.
19 | Center For Spatial and Textual Analysis
Student Researcher Julia Gendy
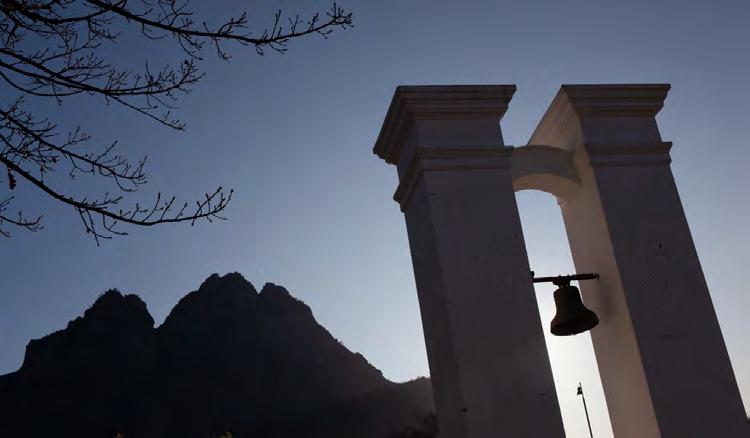
A view of Pniël at dawn. Photo credit: Paul Weinberg.
Early Cape Maps
 Project Description Grant Parker, Associate Professor of Classics
The Cape of Good Hope’s period of Dutch control (1652-1806) is richly attested in Stanford’s David Rumsey Map Center. Our aim was adjacent, namely to mine early European travel accounts for topographic information. In a dual pilot, we traced the itineraries of two travelers, Hendrik Swellengrebel and Francois Le Vaillant. The former returned to his native Cape colony from the Netherlands, undertaking three journeys into the interior (1776-77); the latter traveled (1781-83) at the behest of the French king, Louis XVI, creating a lavish map now at the Bibliothèque Nationale. In both cases, surviving travel accounts show acute observation of natural history and topography: both journeys cry out for a modern remapping that can present the texts in multimedia format.
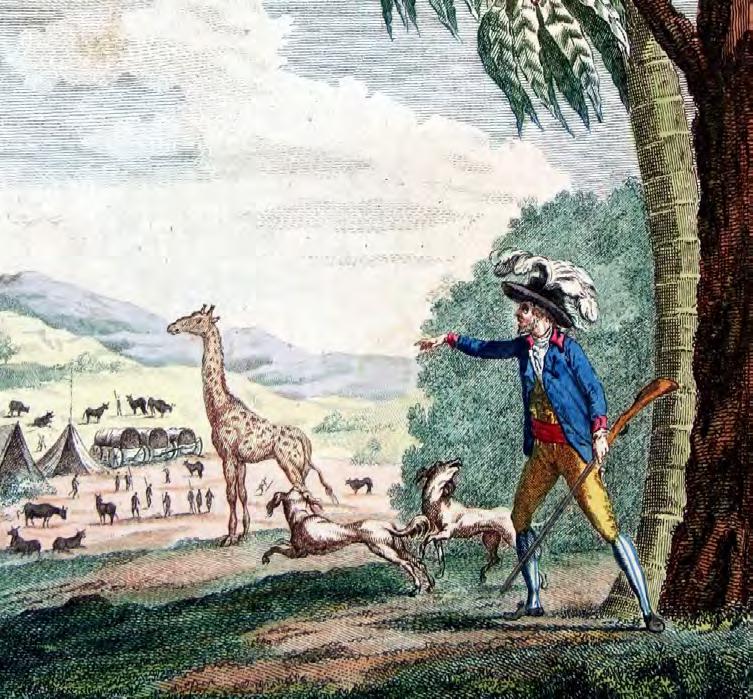
The frontispiece image from Voyage de F. Le Vaillant dans l’intérieur de l’Afrique par le cap de Bonne Espérance (Paris: Desray, 1797). Public domain.cesta.stanford.edu | 20
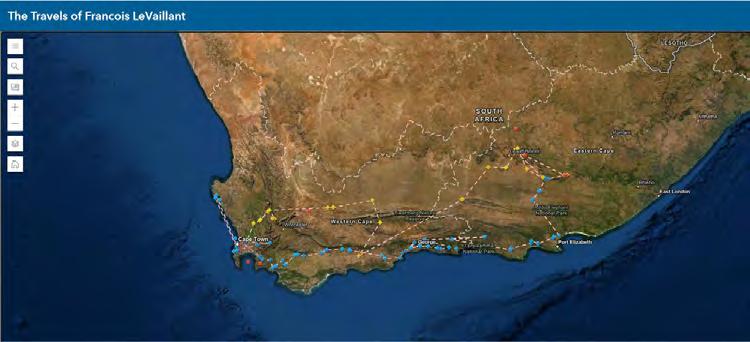
Mapping the Two Journeys of Francois Le Vaillant
 by
by
Mario Nicolas
Francois Le Vaillant was an 18th-century French traveler whose criticism of the Dutch empire differentiated him from many of his contemporaries. His bird preservation techniques were critical to the blossoming field of ornithology and his exhilarating descriptions of his travels captured the interest of many French readers, including Louis XVI, who commissioned Le Vaillant to draw an elaborately adorned map of his travels through the Cape from 1781 through 1784.
I created a web application that showcased Le Vaillant’s work in a digital format. I was interested in converting this work into a digital format because the observations he made and the actions he took are much more useful to historians, anthropologists, tourists, scientists, and the general public when they are both easily searchable and tied to specific locations on a modern map. Using the application I made, anyone can map out a route to the locations Le Vaillant visited and compare their modern observations to those the French traveler made over 200 years ago.
To get started, I read through the English translations of both volumes of Le Vaillant’s travels, storing the location names both as they appeared in the text and in their modern forms. I paraphrased and sometimes directly quoted Le Vaillant’s account of his activities, the societal observations he made, the landscape features he observed,
21 | Center For Spatial and Textual Analysis
A digital map showing Le Vaillant’s travels. This map is available on the web application Mario Nicolas created using ArcGIS StoryMaps.
A screenshot of the ArcGIS StoryMaps page created to showcase the travels of Francois Le Vaillant and Hendrik Swellengrebel around the 18th-century Cape. It was possible to find coordinates for over 100 locations mentioned in Le Vaillant’s narrative.

and the plants and animal species he uncovered. I used ArcGIS Online to store this information in pop-ups and then turned the map into a web application so that it would be more easily accessible to users on both computers and mobile devices. I used distance measuring tools on Google Maps as well as geographical context clues to find modern locations for the more than 100 locations Le Vaillant mentions in his narrative. I supplemented my pop-ups with beautiful hand-painted color images that Ian Glenn, Professor Emeritus at the University of Cape Town, graciously provided.
I also made an ArcGIS StoryMaps presentation to discuss my methodology and to orient the public as they explore Le Vaillant’s travels. This was accompanied by another StoryMaps presentation about Early Cape Travelers that introduces the project as a whole and contains links to both my map and presentation and to the work of my project partner, Feiyang Kuang, on the travels of Hendrik Swellengrebel.

cesta.stanford.edu | 22
Student Researcher Mario Nicolas
Josquin Research Project
A screenshot from the Verovio Humdrum Viewer showing an example of a conspicuous melodic repetition (highlighted in red) in the song La Bernadina by Renaissance composer Josquin des Prez. This project is identifying instances of conspicuous melodic repetition (CMR) computationally.

Project Description
The Josquin Research Project (josquin. stanford.edu) is an open access tool for exploring Renaissance music. The JRP hosts a large and growing collection of complete scores that are browsable online. Users are able to not only see the music, but also search the repertory for melodic and rhythmic patterns. A series of analytical tools can be used to probe individual works or explore musical phenomena across larger repertories. The project’s goal is to bring big data into conversation with traditional analytical methods in order to gain deeper knowledge of polyphonic music from ca. 1400 to ca. 1520.
23 | Center For Spatial and Textual Analysis
Jesse Rodin, Associate Professor of Music, and Craig Sapp, Adjunct Professor of Music
Identifying Conspicuous Melodic Repetition in Renaissance Music
by Kiana HuDuring my internship with the Josquin Research Project, I used the programming language C++ to perform musical analysis of conspicuous melodic repetition (CMR), a melodic feature that is particularly distinctive of the Renaissance composer Josquin des Prez (1450–1521). This analysis aims to identify the unique attributes of Josquin’s music and compare it to the work of his contemporaries. Josquin often uses CMRs to build tension by repeating the highest note in a melodic line. CMR is defined as three or more metrically accented notes of the same pitch within twelve minims (half notes). One of the notes in the sequence must also be melodically accented (i.e., approached from below by leap) or syncopated (i.e., a note duration longer than the note’s metric level). We translated this definition into code to perform a systematic analysis of the Josquin corpus and of music by several contemporary composers.
A screenshot from the Verovio Humdrum Viewer showing mm 5–12 of Josquin’s La Bernadina with two CMRs (highlighted in red in the Superius and Contra lines). On the left is the Humdrum music text that encodes the graphical score displayed on the right.
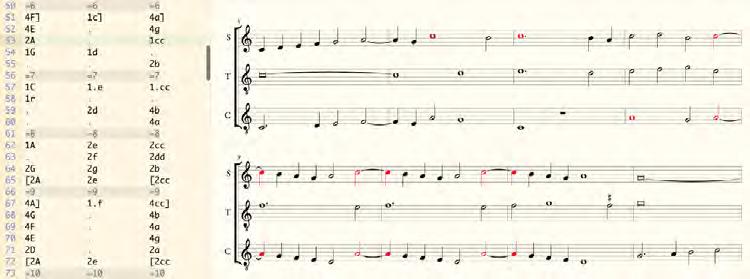
We refined the rules and the consequent code using the song La Bernadina. I was able to visualize the implementation of the CMR program on this music using the Verovio Humdrum Viewer, an online semi-graphical music editor created by Prof. Sapp. I also supplemented the baseline analysis with additional queries.
One such example that I coded was to identify local melodic minimums, where the repeated note was the lowest in a sequence. I used the text editor Atom to edit in C++ and became more familiar with terminal commands to compile and debug the programs.
cesta.stanford.edu | 24
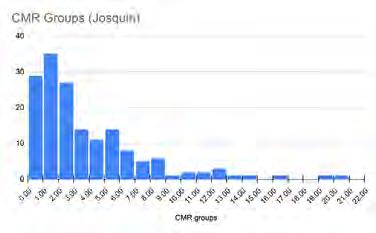
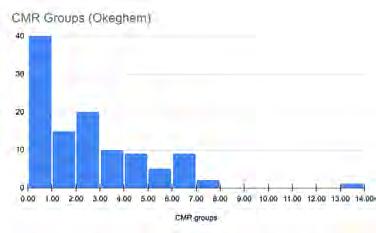
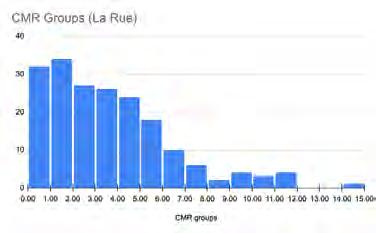
We performed an initial statistical analysis on the density of CMRs in Josquin’s music and that of three other composers: Pierre de la Rue, Johannes Okeghem, and Gaspar van Weerbeke. To better understand the significance of the average densities, I created histograms of peak group/CMR distributions for each composer.
In future, we hope to improve the statistical measures used for this analysis by further refining the definition of a CMR and the associated code.

Histogram charts of CMR distributions by composer. Each bar represents the number of pieces with the given CMR count for that composer. The horizontal axis represents the number of CMRs in a piece.
Scan the QR code to visit the Josquin Research Project website, where you can listen to a digital rendering of the song La Bernadina or download its full score.
 Student Researcher Kiana Hu
25 | Center For Spatial and Textual Analysis
Shipwrecks and the Maritime Heritage of Millennia of Sicilian Connections
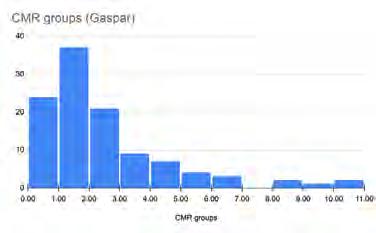
One of the project’s 3D models of wreckage found at the site of the Church Wreck.
Project
Description Justin Leidwanger, Associate Professor of ClassicsSituated amid Mediterranean connections between south and north, west and east, Sicily offers a vantage point and archaeologically rich record for different mobilities, interactions, and livelihoods spanning millennia: ancient ports and shipwrecked cargo, traditions and tools of fishing, and the boats that provided (and prevented) mobility for sailors, traders, warriors, pilgrims, and displaced peoples. This dynamic material record is the subject of ongoing archaeological excavation, 3D heritage documentation and archival research, semi-structured interviews with local practitioners, and public engagement initiatives. Among the goals of this project is the creation of multimedia public-facing work that challenges the public to engage with the objects, memories, and entangled realities of past and present movements across the sea.
cesta.stanford.edu | 26
by Sarah Pincus
While serving as Prof. Leidwanger’s intern, I worked on his project tracing the rich cultural history of southeast Sicily. Rooted in maritime archaeological work, the project explores humans’ evolving relationship with the sea from Classical Antiquity to the present. My main task was to create an outreach platform that could educate both Italian and American publics about the work of the project.
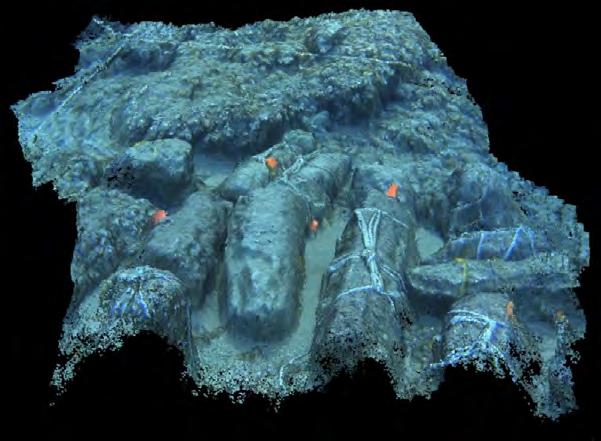
A map of key locations for bluefin tuna fishing in Southeast Sicily. Tuna fishing is a critical economic activity in this area.
With the help of Prof. Leidwanger and many of his students who were conducting archaeological fieldwork in southeast Sicily, I explored several threads within the project, including the Marzamemi 2 Shipwreck or “Church Wreck,” the historical bluefin tuna fishing culture in southeast Sicily, the history of the Palmento di Rudiní (which was once a winery and now houses artifacts discovered by Prof. Leidwanger’s archaeological team), the Vendicari Nature Reserve, and the modern geopolitical dynamics of human migration in the region.
Given Prof. Leidwanger’s desire for the public outreach platform to be geographically focused, initially ArcGIS StoryMaps seemed to be the best software for the project. But after greater exploration, I ultimately decided to use WordPress to add to a preexisting website that provided some information about the project’s work. WordPress offered a platform that could support the images and maps of
Online
Bringing Archaeological Heritage
27 | Center For Spatial and Textual Analysis
the region while also accommodating the necessary contextual information which supplemented the images.

Although I used WordPress to create the website, I still used ArcGIS Online to create the maps for the website, such as the map shown above which highlights key locations for bluefin tuna fishing in Southeast Sicily.
cesta.stanford.edu | 28
Student Researcher Sarah Pincus
The Palmento di Rudiní, a building which was once a winery and now exhibits artifacts discovered by the project’s archaeological team.
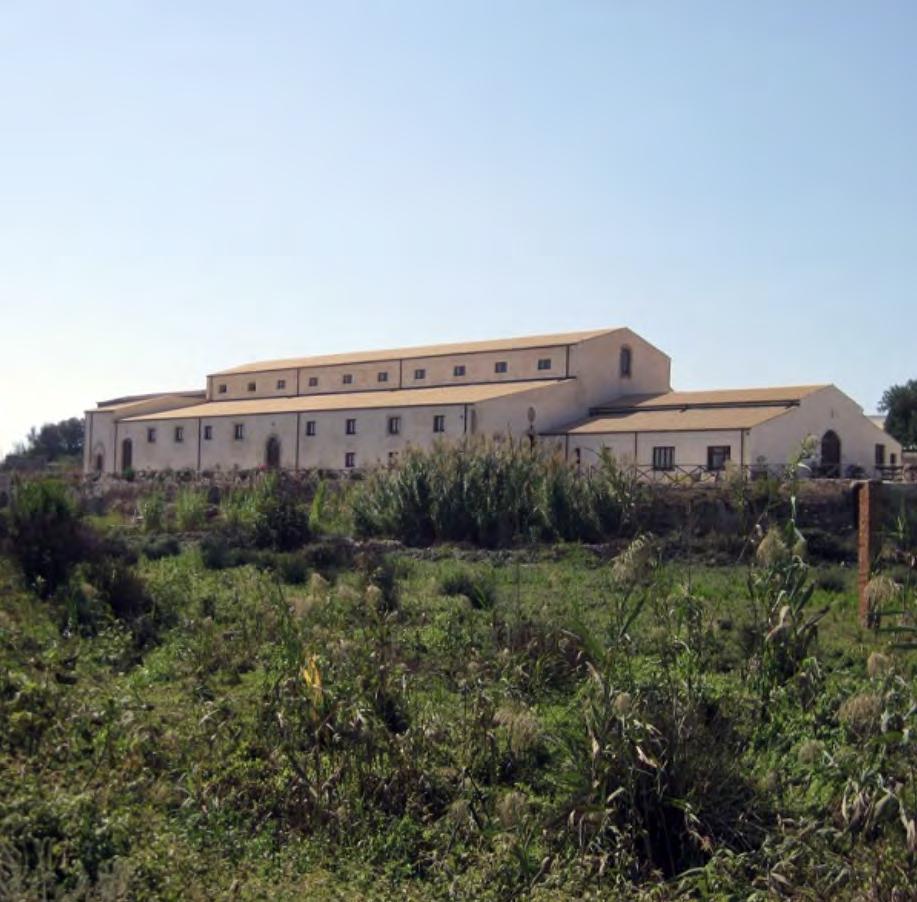
Social Networks in Roman Comedy
A basic social networking map of the characters in Plautus’ play Captivi. The color of the node corresponds to the status of the individual at the beginning of the play: purple for free, red for enslaved, and dark gray for unknown status.
 Project Description Hans Bork, Assistant Professor of Classics
This project aims to generate “social network maps” among characters in ancient Roman Comedy. Plautus’ work is one of the few places in ancient Roman literature where we encounter people of different statuses, ethnicities, economic classes, and genders interacting with each other. (Most ancient Latin literature tends to focus on elite Roman male figures; Plautus is a rare exception.) The interactions among Plautine characters are crucial evidence for a more accurate understanding of ancient Roman society, but until now they have never been examined from a contemporary networking perspective. We aim to fill this gap by using multiple indices of interaction—including the total lines spoken between characters, the total time onstage, and the total number of characters in a play, among others—to create the first visualizations of Plautine social networks.
29 | Center For Spatial and Textual Analysis
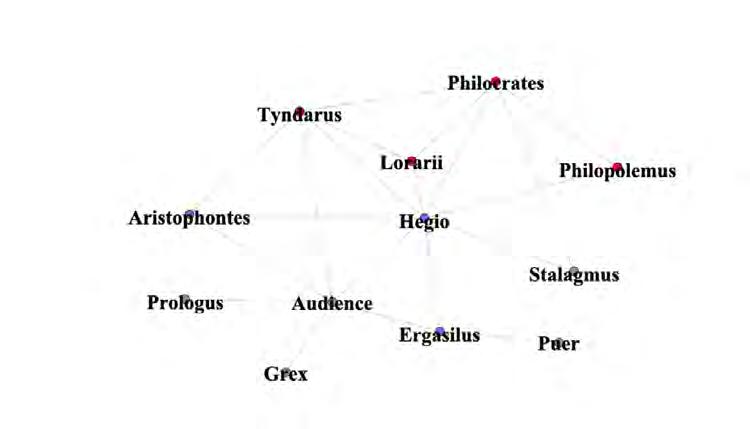
Visual Learning From Ancient Roman Plays
by Marguerite DeMarcoA major goal of my internship was to rework the data that had been gathered by a previous intern. I found new ways to represent the data and gathered new information about Plautus’ plays. After having read through the play Captivi (The Captives), I created a digital model that would facilitate visual learning for readers and students interacting with these Ancient Roman plays. I counted the number of lines spoken between various characters and marked their social status as it changes throughout the play in order to make a cohesive map of interactions.
To turn this data into a social network, I used Gephi, a data visualization software that allowed me to make graphs and networks of the interactions that I had tracked in my spreadsheet. I created a prototype that shows characters’ status as well as the number of lines spoken to other characters, which is color-coded for ease of understanding. I documented my process diligently throughout, from choosing a specific software for network visualizations to selecting data-formatting and collection methods.
When the user select a character’s node, that character becomes highlighted, along with any character that they interact with. In this instance, Tyndarus is the highlighted character, and the only other characters visible are those that he speaks to in the play.
cesta.stanford.edu | 30
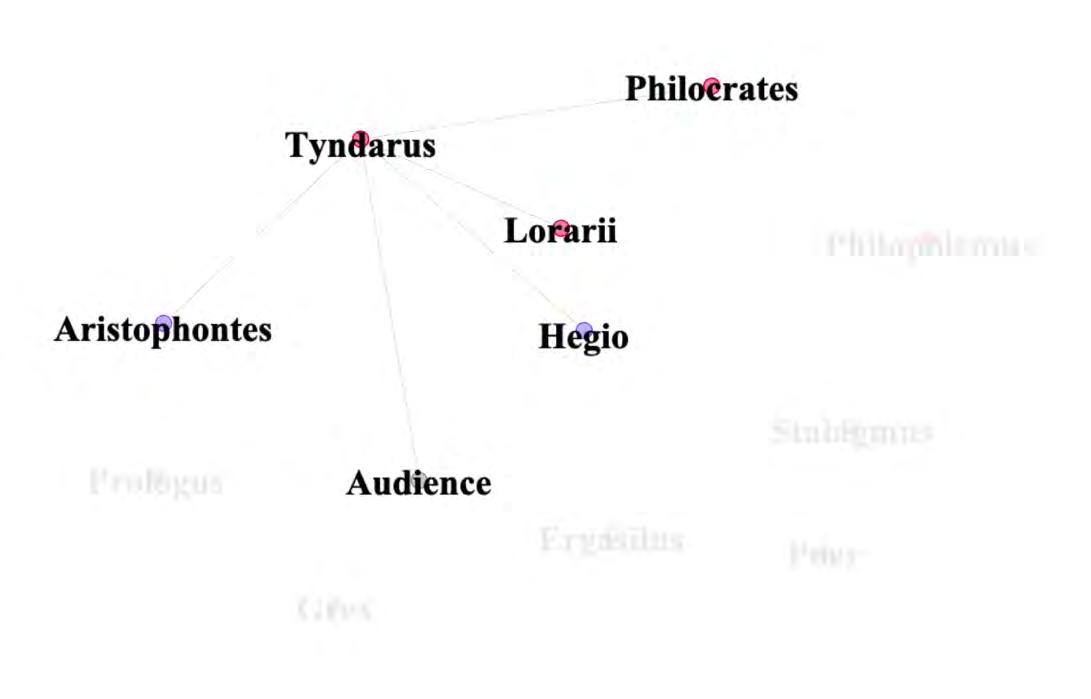
This is the same type of representation as in the previous figure, but using an earlier prototype of the network. Here Ergasilus is the highlighted character. The lines that go from the selected character (Ergasilus) to another character node are highlighted and color coded: lines spoken to the character are indicated by blue lines and the lines that the character speaks to someone else are indicated by pink lines.
The number of lines per character is also displayed so that users can more easily see who interacted with whom. While the thickness of the connecting lines scales with the number of lines spoken, it is easier to make sense of the interactions when the number of lines is also prominently displayed.
Overall, I have learned so much from this project, and have been grateful to have been able to spend this summer working with Prof. Bork on his research. I hope that the headway I made this summer will be useful as the project continues; I feel honored to have been a part of the team.
31 | Center For Spatial and Textual Analysis
Student Researcher Marguerite DeMarco
Modernist Archives Publishing Project
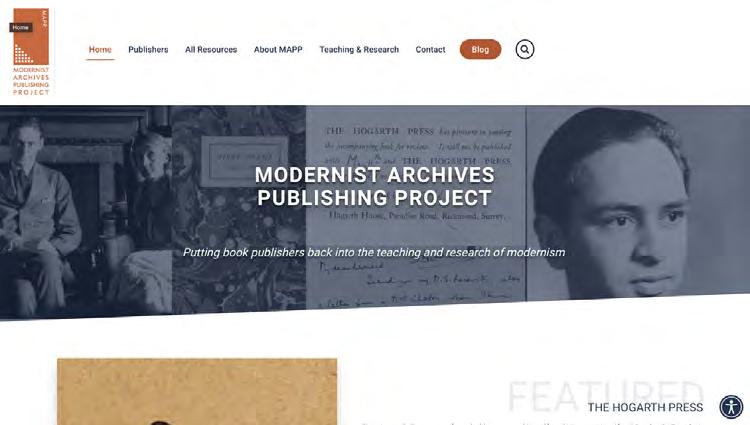
The new homepage for the Modernist Archives Publishing Project. The website is designed to showcase the letters, books, and people associated with literary Modernism. It began with a focus on Virginia and Leonard Woolf’s personal publishing house—the Hogarth Press—but since winning an Arts and Humanities Research Council grant (UK 2021-2024), it has begun to branch into other presses and industry partners, including The Hours Press, Knopf, and the William A. Bradley Literary Agency.
Project Description
Alice Staveley, Senior Lecturer of EnglishThe Modernist Archives Publishing Project (modernistarchives.com) is a critical digital archive of early 20th-century publishing history. With rich metadata, the site displays, curates, and describes documents that contribute to the “life cycle” of a book. It uncovers the often invisible industry actors— editors, illustrators, reviewers, printers— who bring works into the public eye. The collection contains thousands of images from archives and special collections relating in the first instance to Virginia and Leonard Woolf’s Hogarth Press—letters, dust jackets, financial records, paper samples, illustrations, sketches, production sheets, and other “ephemera”—but is actively expanding into other presses, with the long term goal of building the infrastructure currently lacking in book historical studies to engage a comprehensive comparative landscape of 20th-century book publishing.
cesta.stanford.edu | 32
Modernist Metadata
 by Natalie Wang
I worked with Dr. Staveley to produce metadata for documents and archives associated with The Hogarth Press. We cataloged information about the date, content, addresses of both creators and recipients, mentions of pertinent works and individuals, alongside other details. I worked with a variety of materials from the University of Reading’s Special Collections, including digital scans of typescript and handwritten correspondence, financial estimates for bookbinding and publication, copyright requests, samples of book and content designs, translation rights, and a wide variety of information regarding the printing and publication process.
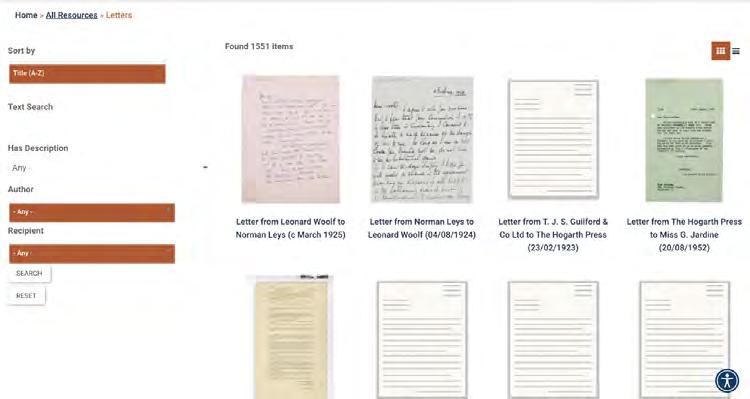
A gallery of letters from the Modernist Archives Publishing Project website. The Hogarth Press staff exchanged many letters with authors, foreign publishers, literary agents, printing and bookbinding companies, and even casual readers.
In the summer, my focus shifted to personal correspondence between Leonard Woolf and various staff members of the Hogarth Press, courtesy of the University of Sussex’s archives. The metadata I produced will be used for MAPP’s new website, which has recently launched. This research offers a glimpse into the rich, layered history of publication: not only of the complexities of every aspect of a book, but of so many voices—printers, bookbinders, typists, translators, designers—which are usually unheard.
33 | Center For Spatial and Textual Analysis
Student Researcher Natalie Wang
Whitespace as Intentional Silence: Computational Analysis of Jacob’s Room
 by Hayn Kim
I worked with Dr. Staveley to research Virginia’s Woolf’s second profession: her work as a publisher. We investigated the manifestation of Woolf’s dual identity as a writer and a publisher in the use of whitespace in Jacob’s Room, her third novel published by her own Hogarth Press. As this research commenced at the same time as my internship, I had the privilege of engaging in both the project design and the investigation.
First, I experimented with computational methodologies to determine which would best identify significant patterns in Woolf’s use of whitespace. Based on discussions with Dr. Staveley, my first aim was to dismantle the preconceived hierarchy between linguistic and bibliographic code: the idea that the text is more important than the way it appears on the page. In doing so, we hoped to identify meaningful aspects of Woolf’s work which were not contained in the text but rather in the layout.
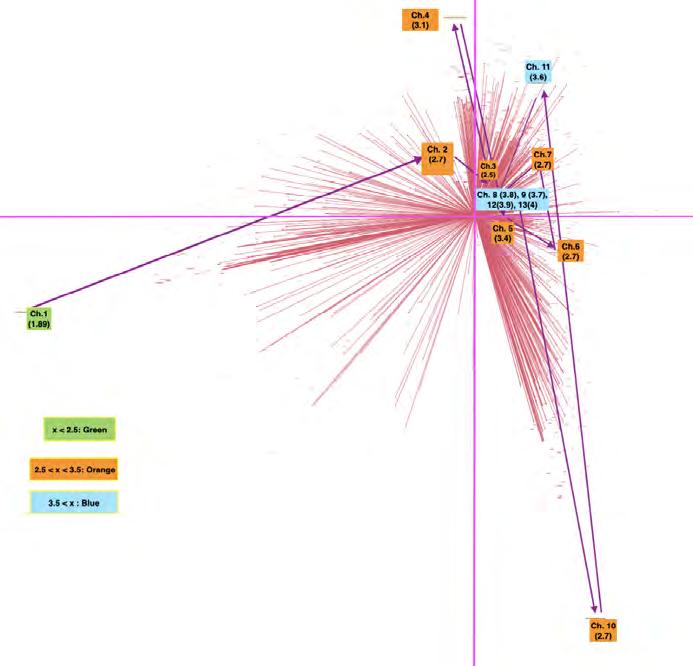
A biplot of a principal component analysis of the top nouns (scaled) in each chapter. This biplot suggests that Chapters 1 and 10 are thematically distinct from other chapters in Jacob’s Room
cesta.stanford.edu | 34
I used optical character recognition (OCR) and the software Abbyy FineReader to convert PDF scans of Jacob’s Room into digital text and cleaned these text files with custom Python code. As FineReader does not differentiate between the lengths of whitespace blocks, I manually labeled each whitespace line with the marker <WS> and wrote a code to annotate the number of lines for each whitespace block. Among the analytical methodologies that I experimented with, the most fruitful were average whitespace analysis and principal component analysis (PCA).
To investigate the average whitespace, I created bar charts to display the variance in whitespace lines throughout each chapter. I then calculated the average whitespace lines for each chapter and colorcoded the charts: green (average < 2.5), orange (2.5 <= average <= 3.5), and blue (3.5 < average). The results suggest a possible correlation between the character Jacob’s life and the amount of whitespace used in the layout. For example, Chapter 1, the only chapter that describes Jacob’s childhood, has a significantly low average (~1.9). The overall transition from orange to blue across the course of the work seems to align with Jacob’s growth. Finally, the absence of whitespace in Chapter 14 coincides with Jacob’s absence, as that chapter begins with the character’s death. Chapter 10 seems to be an anomaly: the average suddenly plummets from 3.7 to 2.6 and returns to a 3.5< range afterwards. This chapter necessitated additional investigation, so I conducted a principal component analysis (PCA).
With help from Quinn Dombrowski, I created a PCA-plot with R and Python code written by Prof. Algee-Hewitt (see p. 34). In this visualization, Chapter 10 appears in the bottom right corner of quadrant IV, far apart from the other chapters. As this chapter is also thematically anomalous, these results suggest a correlation between the use of whitespace and the plot of the book.
Scan the QR code to visit the website of the Modernist Archives Publishing Project, where you can browse thousands of rare twentieth-century publishers’ materials, from letters between authors and editors to dust jacket proofs and royalties documents.
 Student Researcher Hayn Kim
35 | Center For Spatial and Textual Analysis
Early Christian and Muslim Networks
Translated into Latin 1141 Chester Beatty 4924, 1689 (Arabic) +... Vat. 165, 1663, +... Paris 333, 19C & descendants BL. Add. 7197, 11C Vat. Ar. 157, ?? +... Vat. Ar. 109, 1213 +... Vat. 166, <1357 +... Mosul 28, 14C +... Vat. 436, 14C (?) +... Vat. Ar. 110, 14C +... Apology of Al-Kundi, c. 820 (Arabic) Thomas of Marga, Book of Governors, c. 840 Isho'dnah, Book of Chastity, mid-9C Elias of Nisibis, Chronography, 1018 (Arabic) Ibn al-Taiyib, Mas'ala..., d. 1043 (Arabic) Amr ibn. Matta, Book of the Tower, early 11C (Arabic) Abdisho b. Brika, Metrical Homily, d. 1318 Salibi ibn Yuhanna, Book of Secrets, 1332 (Arabic) Book of the Bee, early 13C Bar Hebreaus, Eccl. History, d. 1286—W. Syrian
Elias I, d. 1049
LAW BOOK COMPLETE
Baghdad 509, 12C/13C & descendants
FROM
EP. 59 NEW VERSIONS
EP. 59 Abraham of Tiberius, B Recension (Arabic) Dionysius bar Salibi, d. 1171—W. Syrian
A5 (Arabic) A6 (Arabic) A1 (Arabic)
Interpretation of the Theologian About the Stars Book of Questions 200+ Other Letters
Vat. 96, 1325
Elias of Nisibis, d. 1046
Baghdad 509, 12C/13C & descendants Baghdad 509,12C/13C & descendants
Abdisho b. Brika Nomocanons, ca. 1280
Eccl. Judgements, 1315/6
Vat. Ar. 153, 13C
Trichur 64, 1291 +... Cod. 91 Notre Dame des Semences, 1535 (missing) & descendants
Vat. Ar. 160, 1230
Vatican 605, 1874
Book of Canons, W. Syrian
Canons and Questions, W. Syrian
ms by G.of Ehden, 1471/2 (Arabic) (missing)—Marionite Sinai Syr. 82, 12C—W. Syrian Cambridge Add. 2023, 13C—W. Syrian
S. ad-Duwaihi, Apology, d. 1704 (Arabic)—Maronite Bkerké 107, 18C & descendants
1899 (missing) Mossul 12, early 20C Karmalayss 39, 1904 Codex Ganni, mid-20C
Syriac Epitome of Ep. 59 A4
Coptic Museum 726D, 18C Paris Ar. 215, 16C—Melkite Paris Ar. 215, 16C—Melkite Damascus 1616, 18C—Greek Orthodox Beruit 662, 19C Paris Arab 5140, 19C Damascus 1609, 19C—Greek Orthodox Damascus 1593 (20C)—Greek Orthodox Leeds 7, 1889 Paris 306, 1889
A visualization of the memories of Timothy I, the patriarch of the Church of the East from 780 to 823. Each colored tree depicts the dissemination of a different branch of memories of Timothy. The green tree depicts Tales of Timothy, where authors wrote about the patriarch over hundreds of years. The blue tree represents citations from Timothy’s Law Book, his legal treatise. The purple and orange trees show the copying of Timothy’s epistles by later scribes.
Project Description
Michael Penn,
Professor ofReligious Studies
This project stems from the world’s largest alumni newsletter: in the mid-9th century, Thomas, the East Syrian Bishop of Marga (a region in modern day Iraq), decided he would collect as many stories as he could concerning graduates from his homemonastery of Beth Abhe. Titled The Book of Governors, the resulting hagiography runs to 685 pages and has just shy of 500 characters. It contains a treasure trove of information on topics ranging from Christian-Muslim relations to medieval economic history, ecclesiastical politics, and ancient pilgrimage routes. In recent years, humanists have increasingly applied social network analysis to historical sources in order to study and display how groups are structured. The Book of Governors makes for a particularly intriguing and productive case study for premodern social network analysis.
cesta.stanford.edu | 36
Visualization of how various memories of Timothy were transmitted. Includes information about which, when, and how many manuscripts preserve a given text about or by Timothy. Dates given for earliest extant manuscript. “+ …” indicates multiple surviving manuscripts. “And descendants” indicates we have multiple extant manuscripts but all surviving copies depend on a single, earlier manuscript. EP. 1-59 COLLECTED Baghdad 509, 13C/14C Seert 65, 17C/18C (destroyed 1915) Borgia 81, c. 1869 BL Or 9361, 1889 Paris 332, 1895 Tichur 65, 1897 Mingana 17, c. 1900 Mingana 47, 1907 Mingana 587, 1932 Baghdad 41, 1942 Trichur 10, 1897 Baghdad 512, 1894 Codex Chabot,
Timothy I LAW BOOK CITATIONS &
EXTRACTED CANONS
Abdisho b. Bahriz, early 9C Gabriel of Basra, late 9C George of Arbela, 10C Ibn al-Taiyib, d. 1043 (Arabic) Ubdaydullah ibn Bochtisho, d. 1058 (Arabic)
NON-EXTANT WRITINGS
TALES ABOUT TIMOTHY
EP. 59 ALONE EXTRACTS
Vollers, 10C (likely destroyed WWII)—likely West Syrian +..., W. Syrian, Melkite, Copt E. Syr.
+...
Codex
Cairo Geniza, 11C—Jewish Raqqada, 11C Paris Ar. 82, 14C Beruit 548, 16C Beruit 542, 16C Paris Ar. 215, 1590/1—Melkite Saint Sepulcre 101, 17C—Greek Orthodox Sbath 1324, 18C
A2 (Arabic) A3
(Arabic)
(Arabic)—Melkite
Interactions in the Church of the East
by Zelig DovAt its height, the Church of the East covered land in modern-day Turkey all the way into Tibet and parts of India. The incredible expanse of this church during the Early Middle Ages provides a unique opportunity to study emerging global networks and the structures inside the Church of the East. My work involved documenting and visualizing interactions between members of the Church of the East during the 9th century. I split my time between two main projects. First, I developed visualizations and infographics about Timothy I, patriarch of the Church of the East from 780 to 823. Second, I worked on edge cleanup and social network analysis concerning all of the character interactions in The Book of Governors, a 9th-century hagiography of the monastery Beth Abhe in modern-day Iraq.
My primary task on The Book of Governors project was to create a finalized list for every interaction between the five-hundred characters in the text. Previous interns had already scraped the book for character interactions so my job was to verify and add to their work. In addition to simply noting interactions, I documented character traits such as ecclesiastical hierarchy and religion as well as interaction characteristics such as sending a letter, having a conversation, or causing a miracle like bringing someone back from the dead.
In order to be consistent with my documentation, I created detailed guidelines for which scenarios I considered valid interactions that I updated with unique cases as they arose while I was going through the book. I then imported the data into Gephi, a network visualization software, which I used to graph and analyze the interactions I had collected.
A graph showing all of the character interactions in The Book of Governors Circles (nodes) represent characters and lines (edges) represent interactions between them.
Larger nodes depict characters with more interactions. The colors indicate modularity class, that is, the different communities of characters in the graph.
Jacob Babhai Sahdona Isho-yahbh III Aphni-Maran George Isho-yahbh the Abbot Maran 'ammeh Timothy Cyriacus Kardagh Yahbh-Iaha Elijah Narsai 37 | Center For Spatial and Textual Analysis
Thomas
The second part of my work involved creating visualizations about Timothy I. The greatest chunk of my time was spent on a single visualization that depicts memorialization of Timothy over the past 1200 years. I used Adobe Illustrator to create a graph with multiple intertwining trees to represent Timothy’s epistles, the Law Book that Timothy wrote, the tales written about Timothy, and the copying of manuscripts that was necessary for Timothy’s memory to survive.
I also visualized the uncertainty in the historical record concerning the dates of Timothy’s letters and created an infographic that shows all of the unlikely events which had to take place over hundreds of years for a single manuscript called Baghdad 509 to survive. These visualizations are intended as material for Prof. Penn’s book project, The Church of Baghdad, which is centered around Timothy and explores the beginnings of global Christianity.
Sergius retains copies of 59 of Timothy's letters (ca. 805)
Someone (perhaps Sergius) assembles these 59 letters into a collection (9c?)
Unnamed scribe copies out 700+ page manuscript later known as Baghdad 509 (13C)
Scribes keep copying this legal collection that includes Letters (10c?-13c)
A typical manuscript survives about 250 years, Baghdad 509 makes it to the early 1800s (13C-early 19C)
During Iran-Iraq War Baghdad 509 safely moved to Baghdad (1980s)
Baghdad 509 survives US Invasion of Iraq (2003)
Baghdad 509 survives raiders plundering Monastery of Rabban Hormizd (1828)
Scribes keep copying this letter collection (9c-10/11c)
Unknown compiler (possible Elias I?) includes Letters in a collection of primarily legal texts (10c?-12?c)
Baghadad 509 survives raiders burning books from Monastery of Rabban Hormizd (1842)
Baghdad 509 survives ooding of hidden cache of manuscripts (1858)
Baghdad 509 survives another raid of Monastery of Rabban Hormizd (1850)
Baghadad 509 photographed by Elisabeth Horem Aechbacher (200?)
A visualization of the events which had to take place for the manuscript Baghdad 509 to survive. Baghdad 509 contains all of Timothy’s extant epistles and every other surviving version of the patriarch’s letters was copied from this single manuscript. Without it, there would be no surviving record of Timothy’s epistles.
What was Necessary for Baghdad 509 to Survive. The manuscript now known as Baghdad 509 is the only surviving medieval copy of Timothy’s Letters. All other manuscript containing Timothy’s Letters derive from it. This chart documents the di erent stages between Timothy’s composition of his Letters in the late eighth and early ninth centuries and their eventual publication in the early twenty- rst century. It highlights speci c historical contingencies that had to be met for the composition and preservation of Baghdad 509 and hence for the survival of Timothy’s Letters.
cesta.stanford.edu | 38
Student Researcher Zelig Dov
The Geography of Christian Religious Authority
by Hasan TauhaThomas of Marga’s monastic history, The Book of Governors, contains information about interactions between the various regions comprising and surrounding the Islamic caliphates through the 9th century CE. By using social network analysis, it’s possible to glimpse the landscape of Christian religious authority under early Muslim rule.
A visual representation of all the geographical interactions found in Book IV of The Book of Governors. As can be seen, all nodes are either directly or indirectly connected to one another. Darker, thicker edges indicate multiple connections. The type of connection is specified in red font at the midpoint of the edge. (Note: The data for Book IV was subsequently improved, so these graphs are not final.)
As a research intern on this project, I scraped data from a c. 700page translation of Thomas’s Syriac text. I conducted preliminary social network analysis using Gephi. After conducting background research on the subject and methodology, I collaborated with Prof. Penn to produce a rule-based system for identifying and coding geographic interactions found in the text.
Having scraped the text and deliberated on several cases that challenged our system, we arrived at around 100 geographic interactions for each of the six books in Thomas’s text. Using the data from Book IV, I began experimenting with visual representations
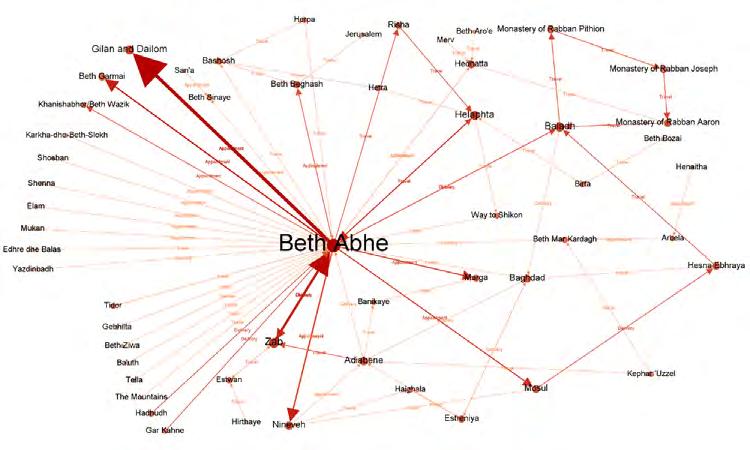
39 | Center For Spatial and Textual Analysis
of these geographical interactions using Gephi. I was particularly interested in whether we could detect patterns that might escape someone who was encountering the same information as a longform text.
There are indeed geographical interaction trends that are difficult (if not impossible) to observe in the absence of data visualizations. For instance, a visualization of all the geographical interactions in Book IV—whether travel, delivery, or ecclesiastical appointment—showed that every location involved directly or indirectly implicated every other location in the same book. In other words, we found a single parent network to which all nodes were linked, rather than many disconnected networks.
Our systematic coding also enabled us to filter the parent network to view, for example, only those geographical interactions realized via the movement of church catholicoi, letters, cutthroats, and corpses. The data compiled is easily navigable and a promising source for further analysis.
A pair of annotated pages from Thomas of Marga’s Book of Governors prior to the data being put into a spreadsheet. The sentences between the highlighted brackets are examples of interactions between Christian and Muslim religious authorities.
cesta.stanford.edu | 40
As an aspiring scholar of early Islamic history, I found this exercise in “researching outside the box” very gratifying. There is often a tendency among academic and (especially) traditional/religious scholars of the early Islamic past only to read what is effectively the imperial Perso-Arabic corpus of texts. Thomas of Marga’s Book of Governors is a brilliant example of a richly informative source on life in the early Islamic world from the point of view of those not in political power. I am grateful to have had the opportunity to participate in such a paradigm-shifting project.
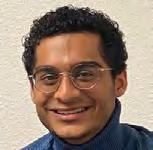
A visual representation of all the geographical interactions found in Book IV of The Book of Governors, filtered to display in blue those interactions involving persons (travel, appointments) and display in orange those interactions involving objects (deliveries).
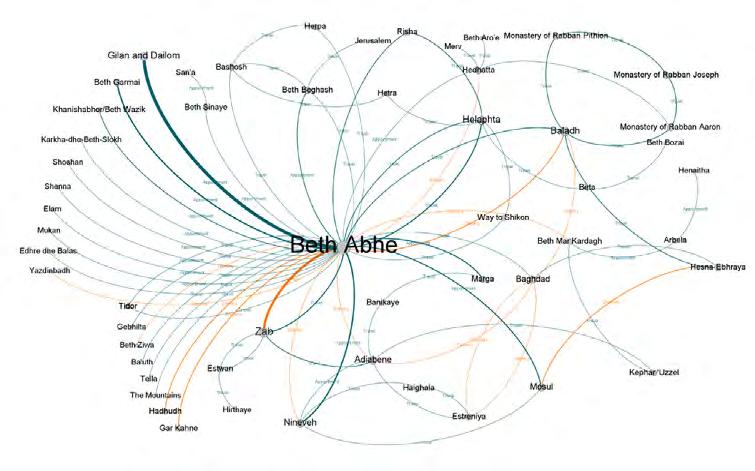
41 | Center For Spatial and Textual Analysis
Student Researcher Hasan Tauha
EpicConnect
A working Figma prototype of a sample “Profile” page for the EpicConnect website. Each EPIC fellow will be able to edit their profile, which can include information about their publications, social media, collaborators, and other projects.
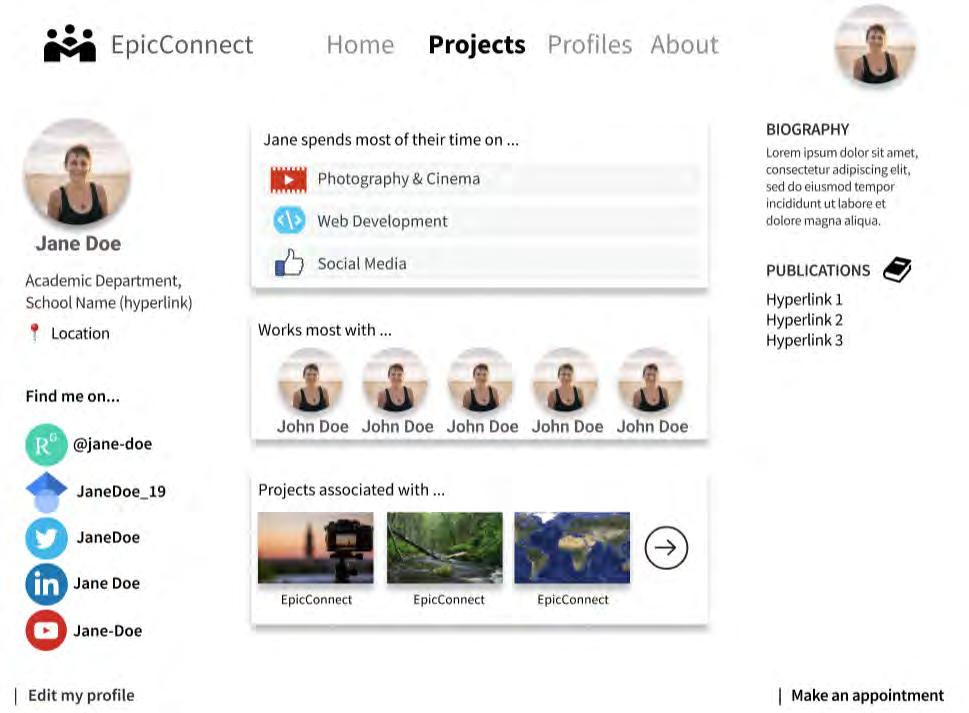
Project Description
Nelson Endebo, PhD Student in Comparative Literature, Fyza Parviz, Digital Learning Consultant, and Ellis Schriefer, PhD Student in ILAC
EpicConnect is an open-source, openaccess online productivity platform that uses Behavior Design principles to build community, enhance belonging, and help instructors collaborate on pedagogical projects. The platform’s goal is to foster project development, increase the social impact of community college instruction, and promote a sense of belonging within an active community of innovative educators. Initially designed in close partnership with Stanford Global Studies’ Education Partnership for Internationalizing Curriculum (EPIC) program, EpicConnect has subsequently been awarded a Stanford Learning Design Challenge Research Grant.
cesta.stanford.edu | 42
Building a User-Driven Platform
by Pauline Arnoud, Srihari Nageswaran, and Rosalyn BejrsuwanaWe began our internship by learning the necessary skills to gauge how the platform could best improve the pedagogical outcomes for its central audience: the EPIC fellows of Stanford University’s Global Studies Program, all of whom are community college instructors aiming to incorporate international materials into their curricula.

An example of the future “Projects Overview” page on the EpicConnect website. Each card on this page represents a project. Clicking on the card will take the user to that project’s page, where more information is available.
We then designed the platform with two functions in mind. First, the “Blueprint function.” This principle emphasizes reproducibility (i.e., new fellows and other educators can plan for their own projects by following the documentation of existing ones). The second is the “Ambassador function,” which envisions the platform as a way for individual fellows to showcase their work and enhance their professional branding.
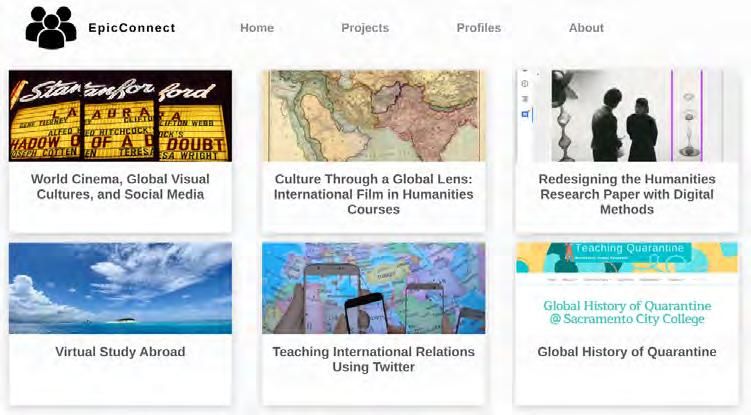
43 | Center For Spatial and Textual Analysis
Student Researchers Pauline Arnoud (left) and Rosalyn Bejrsuwana (right)
As a part of this internship, we taught ourselves the basics of Figma and user-interface design while preparing to interview the EPIC fellows to determine what to display on the website. While designing the Figma prototype of what would eventually become the official EpicConnect website, we conducted research interviews with all EPIC fellows working with CESTA and some working with SPICE.
We tracked their responses in spreadsheets and incorporated their input into the final website. We collaboratively designed four pages, including the interface for the description, story, goals, challenges, and takeaways for each project, as well as fellows’ contact information.

A sample “Project” page on the future EpicConnect website. On the left, there is space for the project title, project description, and a list of tools used in the project. The central part of the page will include the project’s story, goals, and challenges, in addition to providing space for peer feedback. Finally, on the right, EPIC fellows will be able to include links to other project materials and list the main takeaways from their work.
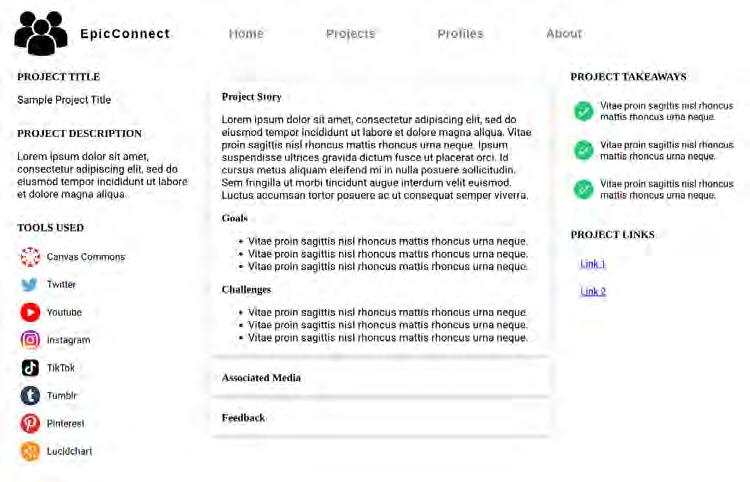
cesta.stanford.edu | 44
Student Researcher Srihari Nageswaran
Prototyping a Concept: EpicConnect
by Carlo Dino and Benjamin RulandDuring our internship with EpicConnect, we worked on a number of key website features, most notably a user login system and the project creation page. We started by reading a number of project outlines and blueprints to give us direction. Using these as a foundation, we prototyped the basic design of the frontend using the React and Bootstrap frameworks (the former we learned on the job while prototyping!). At this stage we developed the navigation bar, a temporary “About” page, a static project page, and an authentication page.
Next, we developed the user login system. This system allows users of the website to log in and access their materials, or create a new
Users can edit the project information that will appear on the Explore page!
Users can create their project’s story, and list the future goals and ongoing challenges with the curriculum in its current state.
Users can list the possible student takeaways of their curriculum.
On the “Project” page, users can draft and publish their curriculum on EpicConnect. Although still a work-in-progress, this iteration allows project leaders to draft their project online and publish it for other viewers to seek potential collaboration. The left-hand column contains basic curriculum information, which will also be displayed on the “Explore” page.
The main body allows users to describe their project in detail. Here, the story behind the project can be shared to show its roots, alongside a summary of its goals and a list of the previous challenges it has encountered. Finally, the righthand column contains the project’s takeaways, offering an incentive for others to participate in the project for the benefit of their own students.
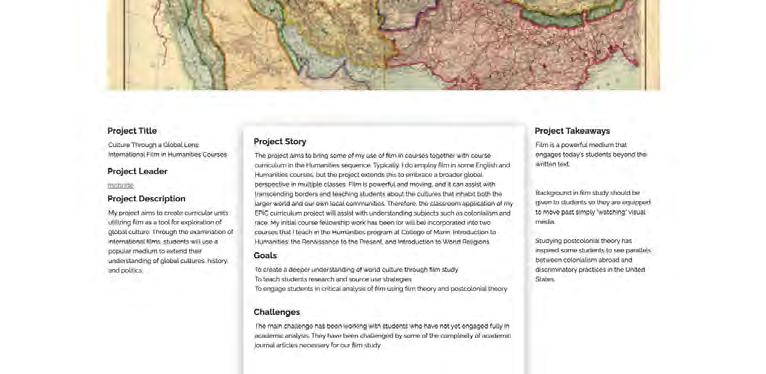
45 | Center For Spatial and Textual Analysis
Student Researcher Carlo Dino
On the Explore page, projects are displayed as a “card” that contains the name and cover photo of the project!
Viewers can click on these project cards to access that project’s page to get more information about their curriculum.
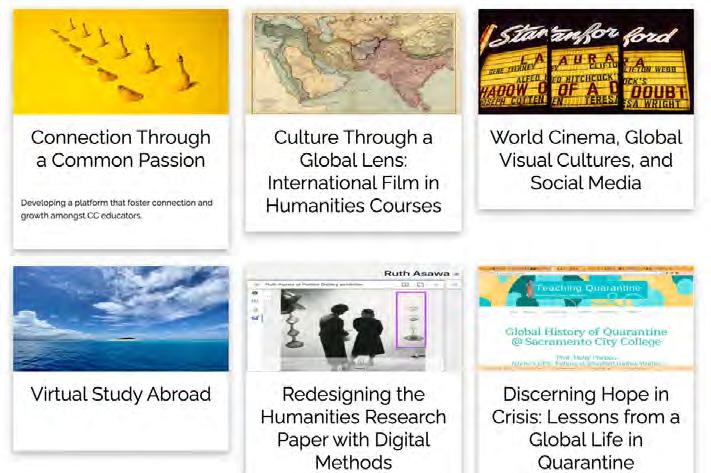
The “Explore” page hosts users’ projects for public display on EpicConnect. This allows users to view other projects to potentially collaborate on them with the project leader. It also allows project leaders with similar projects to collaborate on curriculum development, which is a major goal of the EpicConnect project. The “Explore” page is available to non-EpicConnect users, and projects must be published to be visible.
account to develop a new project page. We utilized the MongoDB system and Mongoose framework to connect our application to our user credentials datapool on MongoDB. For heightened security, user passwords are encrypted before being stored on the database.
Finally, we developed the “Project” page using several JavaScript libraries. Every user is given their own project page, and can freely edit text boxes and upload files. We designed these pages to store information sustainably through the JSON standard file format, which is then hosted on EpicConnect’s server.
As of right now, the EpicConnect project is nearing the end of its prototyping phase. We are extremely excited about this project’s bright future, and are so grateful to have been a part of its mission during our time at CESTA.

cesta.stanford.edu | 46
Student Researcher Benjamin Ruland
Users’ project description will appear in a dropdown whenever a viewer hovers over their project.
Mapping Shared Sacred Sites
The QGIS interface where coordinate data for the preliminary list of shared sacred sites was first rendered by Shannon Gifford as geospatial shapefiles. The workspace contains several layers which were used to test different site database configurations. This configuration matters because it impacts how the points can be represented later in ArcGIS.
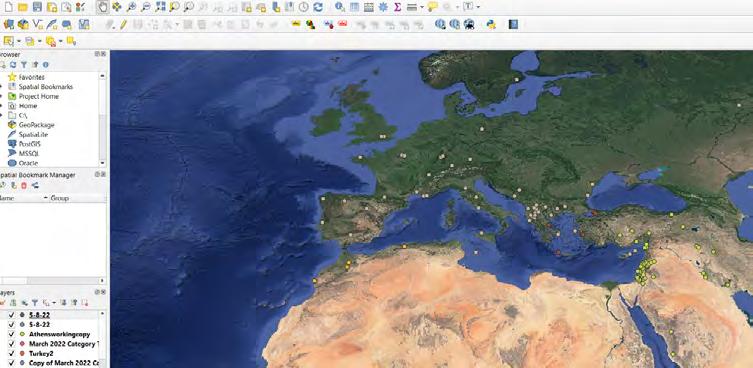
Project Description
Anna Bigelow, Associate Professor of Religious StudiesDespite the existence of numerous shared sites of religious observance across the world, they remain largely unknown. Shared sacred sites are “holy” for members of multiple religious groups (which may also be ethnically or nationally distinct) and serve not only as places where people come together to respect the site in various ways, but also as sites where they are forced, by their coexistence, to mediate and negotiate their diversity and differences. This ethos of sharing has been customary throughout the world and throughout history. This project proposes to restore accounts of cohabitation, hospitality, and tolerance to the historical record, taking their place alongside the better known examples of communal strife and interreligious antagonism.
47 | Center For Spatial and Textual Analysis
Storytelling for Spatial Data
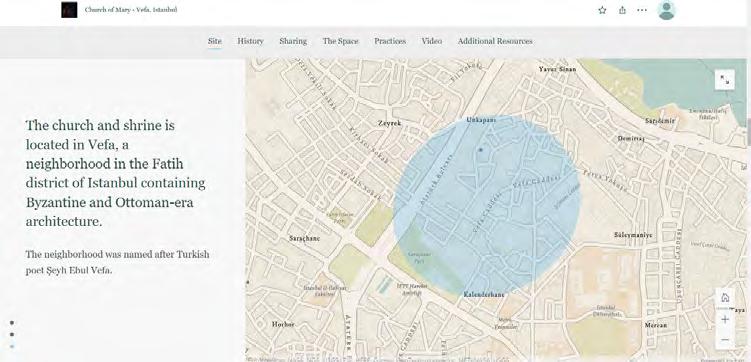 by Shannon Gifford
What are accessible ways of visualizing spatial data? How can we tell stories about this data without losing its inherent nuance? These are questions that I tackled during my internship with the Shared Sacred Sites team. There were two main facets to my work.
The first facet entailed creating a map of shared religious spaces worldwide. Using Google Earth, I collected coordinates for a preliminary list of sites. I then turned to organizing this data, which was unexpectedly challenging. To turn real, tangible places into dots on a map, we had to organize qualitative data quantitatively. While our database format is still in flux, I did develop a few
A screenshot from the StoryMaps presentation of the Church of Mary (Vefa, Istanbul). The presentation seeks to orient the viewer to the space of the site at different scales. It begins with a map zoomed in to the single point of the church, then zooms back out to show Istanbul more broadly. Next, as shown here, it highlights the neighborhood. After this, the story leads the viewer through the church itself using photos, text, and video.
models to generate our first test maps. First, I created shapefiles by mapping the coordinates in QGIS. Then, I took these files and experimented with different forms of ArcGIS maps. I tried diverse layer configurations, various data searching methods, and different visual distinctions such as point and pop-up box styles.
The global map was essential for the project. The sheer number of points, regardless of which styles we chose, spoke to the existence of shared sites in the face of dominant narratives about conflictual ones. However, the challenges we faced in choosing a format—in
cesta.stanford.edu | 48
reducing the dimensionality of a lived space to a dot on a screen— reinforced the importance of supplemental forms of storytelling.
The second facet of my work involved constructing immersive ArcGIS StoryMaps pages for individual sites, allowing a deeper dive into the site-specific material. I am currently developing a model StoryMaps site for the Church of Mary in Vefa, Istanbul, and experimenting with tools to represent multimedia data in an immersive way. While we still have decisions to make about the global map format, we have made significant progress in identifying the strengths and limitations of visualizing this type of nuanced spatial data.
A screenshot from the ArcGIS StoryMaps page for the project’s first model, the Church of Mary in Vefa, Istanbul. Given that shared sacred sites can have many different names, even deciding how to render the title (the site name) raised important questions and necessitated thoughtful discussion by the project team.
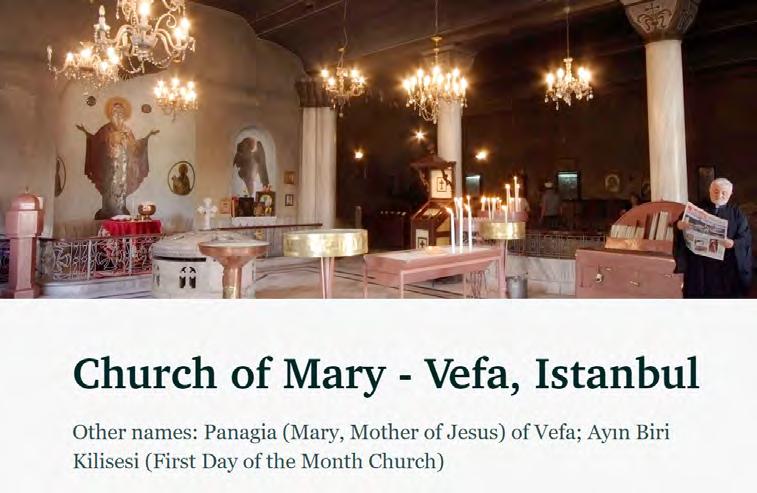 Student Researcher Shannon Gifford
49 | Center For Spatial and Textual Analysis
Scofflaws and Debt Collectors
Looking south on State Street, Chicago, 1964. Image source: Vintage Everyday.

Project Description
Destin Jenkins, Professor of HistoryThis project takes the routine experience of parking tickets as a window onto the history of privatization and urban governance in the post-Civil Rights era. Beginning in the late 1960s, in the context of tax revolts and increased fiscal stress, ‘scofflaws,’ or those who refused to pay parking citations, became both a social problem and potential revenue solution. American cities increasingly partnered with corporate debt collectors to replenish their coffers. Often, the contracts ended in scandal and corruption, with very little return for cities, many of whom spent more to collect than they took in. This project is currently assembling and geocoding city government finance documents, online newspapers and trade bulletins, and corporate records, in order to build a network visualization of debt collection.
cesta.stanford.edu | 50
A Deep Dive into the Archive
by Fernando BravoThis project investigates the politics of debt accumulation and collection as it pertains to parking tickets in late 20th-century Chicago and Los Angeles. During this time, there was an increase in the number of people who would accumulate large numbers of unpaid parking tickets, and corresponding efforts by municipal governments to collect this debt. Eventually, the governments turned to private firms to handle the data processing necessary for the debt collection. However, this outsourcing often ended up costing more than it brought in. This curious fact is what gave rise to the key question for this research project: why would municipal governments go to such lengths only to spend more money than they were getting back?
“Notice of Delinquent Parking Violation,” Box 2601, Folder 15: “Bradley Administrative Papers, Bill Bicker, Parking Fines (Uncollected), 1990,” Thomas Bradley Administration Papers, 1920-1993, Charles E. Young Research Library, University of California, Los Angeles.
As my internship coincided with the beginning of this project, the first goal was to build up a collection of relevant sources by conducting original archival research, and to use this process to inform the scope and aims of subsequent research phases. Most of my work consisted of analyzing daily newspaper articles about so-called ‘parking ticket scofflaws’ in 1960s and 1970s Chicago. I observed that the information in the articles was generally consistent. While new numbers would be revealed about how much the cities had lost
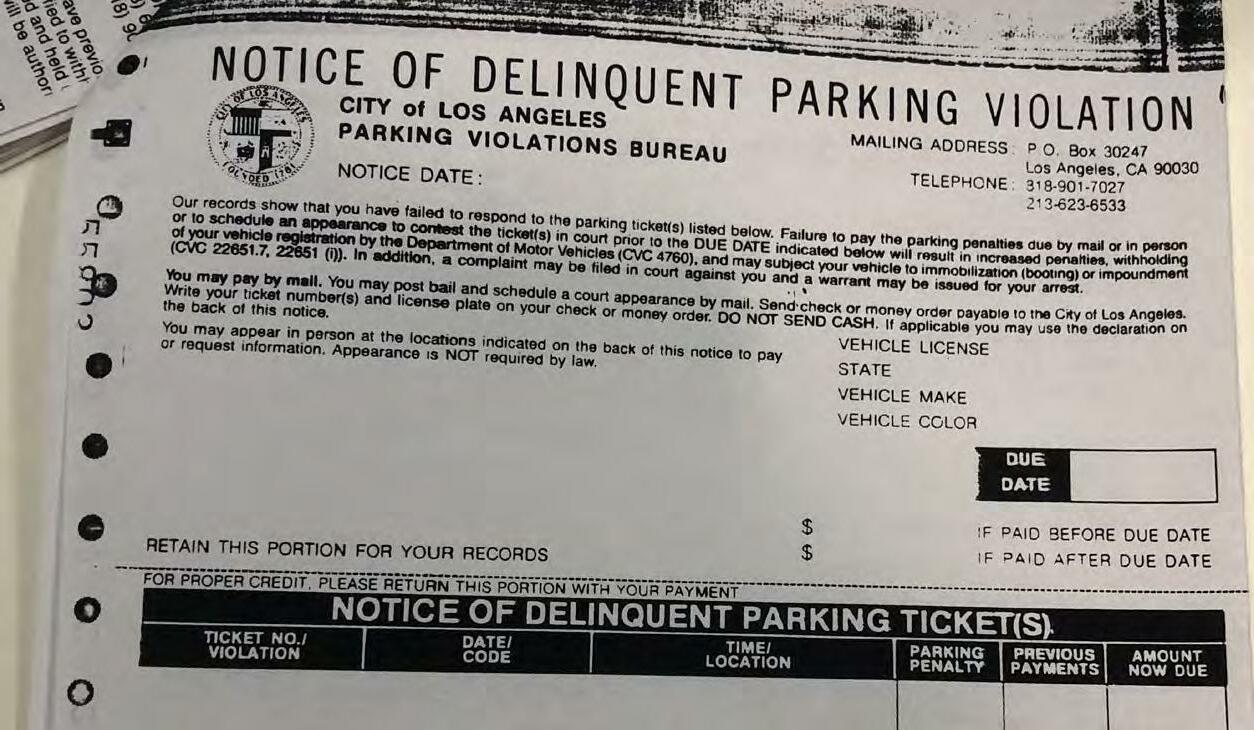
51 | Center For Spatial and Textual Analysis
in revenue from unpaid tickets, and new people were named as the top scofflaws, these articles tended to follow a stable formula.

In the process of collecting and assessing these journalistic sources, some overarching patterns and developments revealed themselves. For instance, it became evident that reporting the top scofflaws’ misdeeds, and including increasingly more identifiable information (up to and including names and addresses), was likely a way of stigmatizing the habit of ignoring parking tickets. If laws or debt collectors were unable to compel people to pay their parking tickets, perhaps a sense of municipal patriotism or shame would be more effective.
The archival research I conducted gave us more context into the social stigma surrounding scofflaws, but has not yet allowed us to definitively answer the question of why municipal governments focused on parking tickets or outsourced their debt collection. The next stage will be to assemble documents of different kinds to build up a broader picture into the culture and practices of municipal debt collection in the late 20th century. Once these sources have been collected, they can be transformed into a dataset allowing for both qualitative and quantitative analysis.
cesta.stanford.edu | 52
Student Researcher Fernando Bravo
Michigan Avenue, Chicago, 1965. Image source: Vintage Everyday.
Senegalese Slave Liberations Project
Sénégal
A map of colonial Senegal with French colonial outposts indicated. This image is from the French translation of Prof. Richard Roberts’ book “Two Worlds of Cotton.”
Project Description
This project builds on the Slave Voyages Database, which has transformed the study of the trans-Atlantic slave trade by presenting the most comprehensive collection of slave trade voyages. That database, however, tells us virtually nothing about the slave trade within Africa. Our project offers a crucial counterpart by presenting evidence of slavery in the Senegambian, Mauritanian, and Malian region of West Africa during the late 19th century. We are working to analyze the data from registers of liberation (records of slaves under French colonial authority who sought their freedom); of the 28,000 liberations registered for 1857-1904, we have so far analyzed over 12,000. We held an international workshop on the ethics of naming the names of enslaved people in digital humanities projects and we are currently preparing papers for a special issue of Digital Humanities
53 | Center For Spatial and Textual Analysis
Quarterly.
Richard Roberts, Professor of History, and Rebecca Wall, Assistant Professor of History, Loyola Marymount University
ie G bam ce sam n a a C
Kayes
e
Dakar Gorée l t
Pout Cap Vert c O
Bakel Petite Côte
Saint-Louis
u q i t n a
A n a é
Richard Toll
SOUDAN
0100 Chemin de fer km SÉNÉGAL
SÉNÉGAL MAURITANIE
GUINÉE GUINÉE BISSAU GAMBIE
Historical Data for Public Use
by Stephanie PerezDuring my internship with the Senegalese Slave Liberations Project, I built upon the work of previous interns to expand our set of transcribed slave liberation records, completing an additional 6,114 entries from the years 1886 to 1893. As this information continues to be input and standardized in the project’s spreadsheets, researchers, educators, and other interested parties will have a better medium through which to use this data, whether as supplementary educational material, a primary source for historical research, or simply as a source for exploration.
this case, includes the name of a (possibly assigned) guardian or location of origin. All registers are available through Stanford University Libraries (https://searchworks.stanford.edu/view/5185180).
This process of discovery is one in which I personally participated. As I transcribed data from 1886-1888, for example, I noticed a larger number of unaccompanied minors than I had in other rolls—a detail that launched a small investigation into when French colonial officials started creating separate registers for orphans, most of whom were girls. The frequency with which girls appeared in these registers preceded their presence in the tutelle system, which placed liberated girls in a guardianship arrangement where, more often than not, they experienced exploitation and neglect.
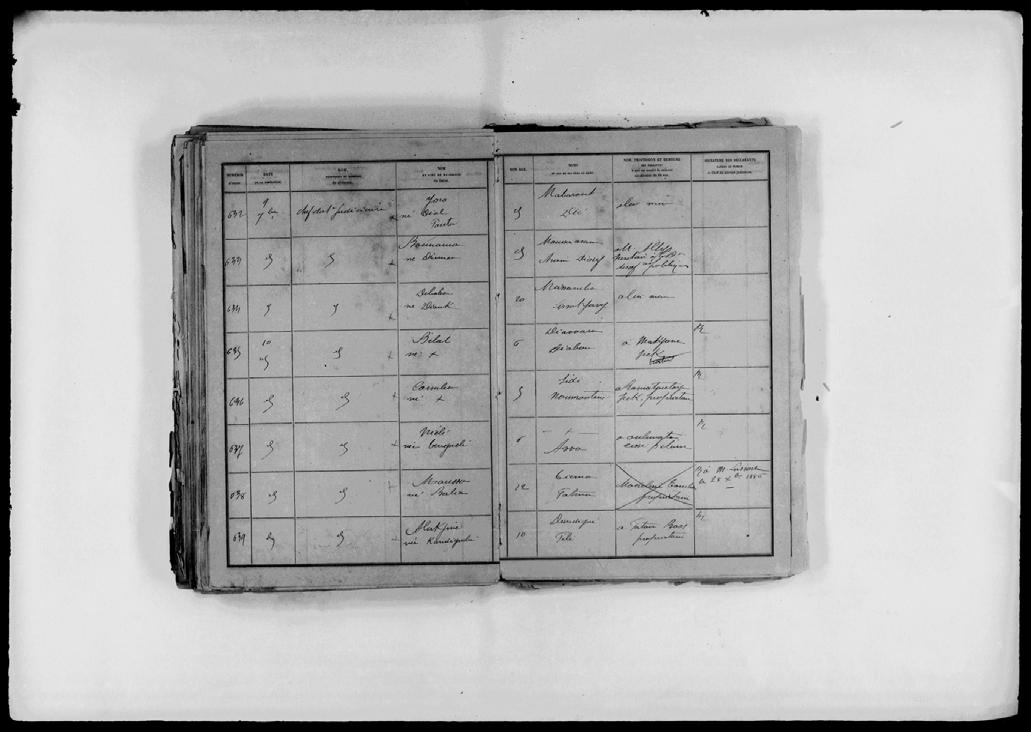
cesta.stanford.edu | 54
Unearthing archives such as these and making them available to the public allows such inquiries to develop, fostering a better public understanding of colonization and gender, agency, surveillance, and more.
The second part of my work concerned how to best frame this data for public use. I am currently working on adding material to the website built by the project’s interns at Hamilton College. Working with educators from Senegal, the United States, and beyond, we have been compiling information on how to best cater the site to curriculum-building—from including background readings to incorporating additional media such as data visualizations, videos, or photos.
This process also involves probing the nature of the archive, and contending with how to best represent stories that can often only be found in colonial documents. In order to do this well, it is crucial to read about, talk about, and reflect deeply upon the issues at stake. A challenge we face in the future is finding ways to increase the sustainability of the website, and the project as a whole.
To make sense of original archival data, we also need to engage with the secondary literature. Here is an example of my engagement with an excerpt from Kelly Duke Bryant’s A Sentiment of Humanity

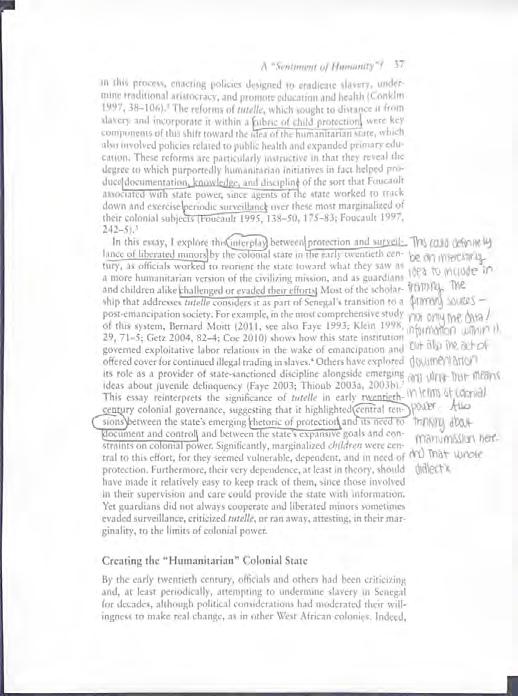 Student Researcher Stephanie Perez
55 | Center For Spatial and Textual Analysis
Oral History Text Analysis Project
Content Warning: This project deals with themes of sexual violence.
The search and results page of Winnow. Users can search a corpus of interview transcripts and view the results as frequencies/distributions of keywords, and as extracts of texts surrounding them.
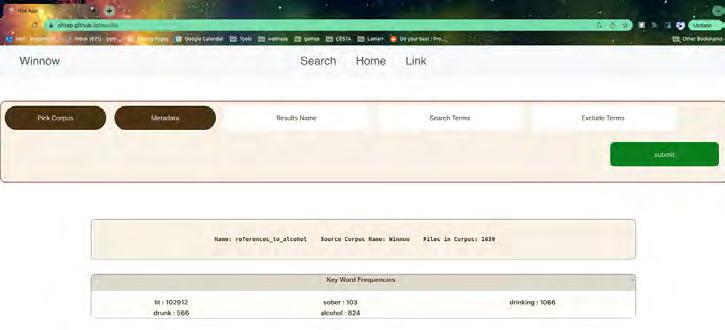
Project Description Estelle Freedman, Professor of History and Natalie MarineStreet, Oral History Program Manager (Stanford Historical Society)
The Oral History Text Analysis Project (OHTAP) is developing an original methodology for data mining the rich but untapped collections of digitized transcripts of women’s oral histories housed in university libraries and other collections across the United States. OHTAP has created a database of 2400 transcripts from diverse regions and social groups and developed a subcorpus extraction tool called Winnow. The current study asks whether and how the women interviewed named, remembered, and interpreted forms of sexual violence and harassment. Our project combines quantitative and qualitative analysis to understand which women spoke about sexual violence; what language narrators used to describe assault, abuse, and harassment; how responses to violence changed over time and across groups; and what historical contexts enabled resistance and activism concerning sexual violence.
The user can search their corpus, optionally including a metadata file and any terms they would like to ignore in their search Details such as how many files matched the search are presented to the user The search returns the occurrences of each searched term, this information will be used in future analysis such as densities and keyword usage over time.
cesta.stanford.edu | 56
The Oral History of Sexual Harassment
by Camellia YeDuring my internship with the Oral History Text Analysis Project, I primarily worked on manual coding and first-level data visualization. Previous coding passes have identified and tagged excerpts from interviews discussing sexual harassment. Using NVivo, a software used for qualitative data analysis, my task was to identify specific details within these tagged excerpts and sort them within the framework provided by the project’s codebook.
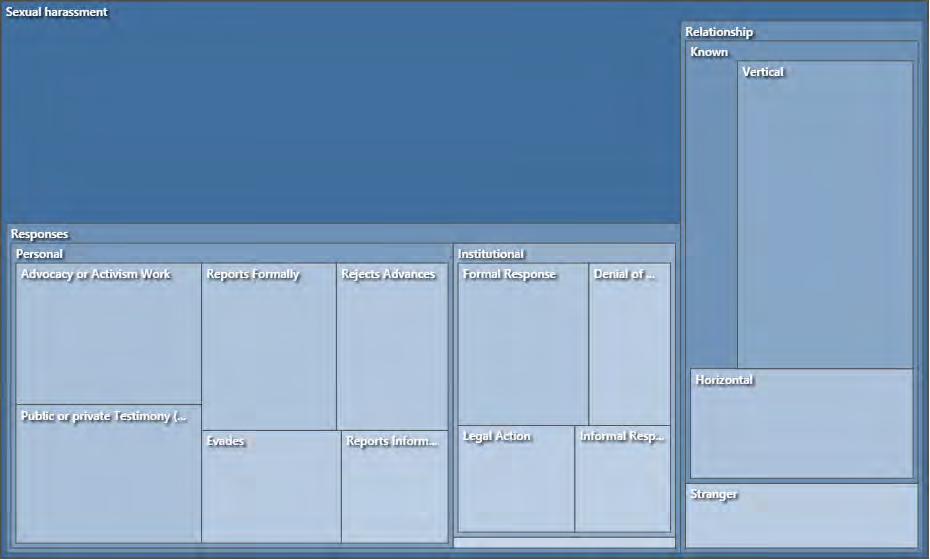
A high-level summary, generated using NVivo, of the hierarchy of subtopics within discussions of sexual harassment by number of coding references. The interview transcripts in OHTAP’s database represent a diversity of US regions and social groups. The coding was conducted by the project team and assessed for intercoder reliability.
For each excerpt about sexual harassment, I identified the nature of the relationship between the victim and the harasser, if possible, and whether it constituted a horizontal or vertical power dynamic or was between strangers. I also identified the personal response (i.e., reporting formally, rejecting, testifying) and the institutional response (i.e., denying the problem, taking legal action, responding formally) to the sexual harassment case. I worked alongside another coder (Prof. Freedman) to ensure the reliability of the coding. After each round, I was responsible for generating the intercoder reliability and reviewing coding differences to improve accuracy.
With the manual coding of the project’s corpus finished, my second task involved visualizing the data and identifying trends. One of the
57 | Center For Spatial and Textual Analysis
project’s primary objectives was to investigate how race affected how women spoke about sexual harassment in the periods before and after the naming of sexual harassment around 1976. How did the language, the relationships between the victim and the accused, and the personal or institutional responses change for Black women as compared to white women over time?
Using the coding on sexual harassment, I began organizing the data amassed from the collections of oral histories and considering the best ways to display that data in order to identify key trends.

An example visualization of some of the macro results from the manual coding of interviews in the oral history corpus. Now that the coding phase is complete, the project is exploring different ways of visualizing the data to draw out meaningful trends.
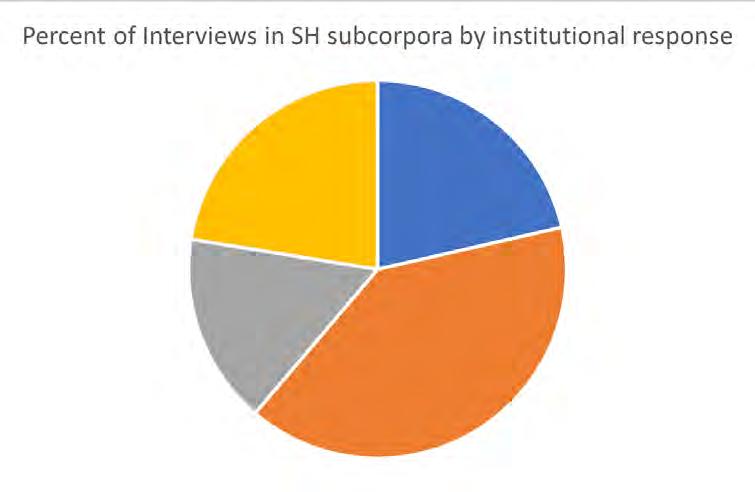
cesta.stanford.edu | 58
Student Researcher Camellia Ye
Protecting Sensitive Data
by Benjamin RulandBeing someone who loves to tinker and build, I was delighted to intern with this project. In the course of developing Winnow this summer I had the privilege to learn about Prof. Freedman’s research and to read some of the many interview transcripts documenting women’s personal experiences. One of the most important tasks of this project has been to put myself not only in the shoes of the researcher, but also in the shoes of the people she researches. To me, Winnow is not just a piece of search software, Winnow is a tool for bringing the voices and stories of real people to the forefront and helping us honor, remember, and learn from them.
Given the sensitive nature of some of the data that Winnow analyzes, data privacy and security was a primary goal for the project. Winnow is coded in Javascript using React. By utilizing a new application programming interface (API) called File System Access, the project now runs entirely in the web browser with no backend server typical of such applications. In short, this means the user’s data stays on the user’s computer, which is very important when working with sensitive and private data.
Through this project I have learned an array of new skills including Javascript and React, search algorithms such as Aho-Corasick and Knuth-Morris-Pratt (KMP), UX/UI principles, data storage ethics, and application deployment. I look forward to continuing the project with Prof. Freedman this fall, when we aim to release the first version of Winnow before continuing to add a handful of exciting features.
An overview of how data flows through Winnow.
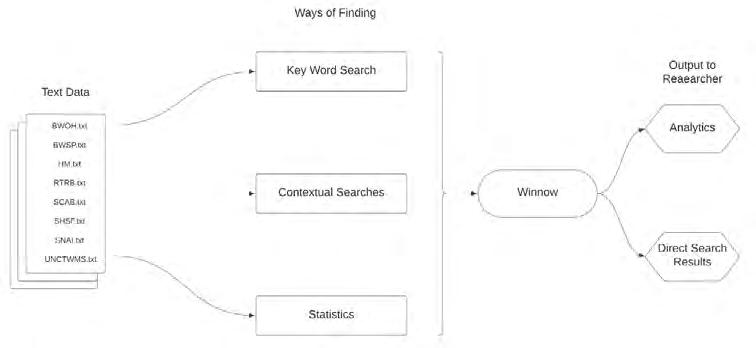
59 | Center For Spatial and Textual Analysis
Student Researcher Benjamin Ruland
Panic and Pandemic
A word bubble of terms associated with “Pestilenz” (plague). Interestingly, the words “Krieg” (war), “Schaden” (damage), “gefährlich” (dangerous), “heimlich” (secretive), and “sterben” (to die) were more closely associated with plague, while words for Christ and Christians appeared in the outermost ring of words. This may suggest that people feared the physical realities of plagues more than the possibility that they were divine punishment.
Project
Description Laura Stokes, Associate Professor of HistoryThis project examines discourses on epidemic disease against the history of outbreaks in early modern Europe, with case studies on Germany, England, and France. Using online databases, we analyze metadata of early modern publications for themes related to epidemic disease and compare these occurrences with historical reports of plague outbreaks. We also bring this data together with additional indices such as persecution (witch-hunting, antisemitism, and religious strife) and climatological variation. For example, in our German case studies, data streams on outbreaks are combined with structural data on the relative centrality of German cities, allowing us to model the impact of centrality on epidemic disease as well as the discourses which preserve its historical traces. Such models will allow the visualization, examination, and testing of different hypotheses about the role of environmental and social stress in the dynamics of panic and persecution.
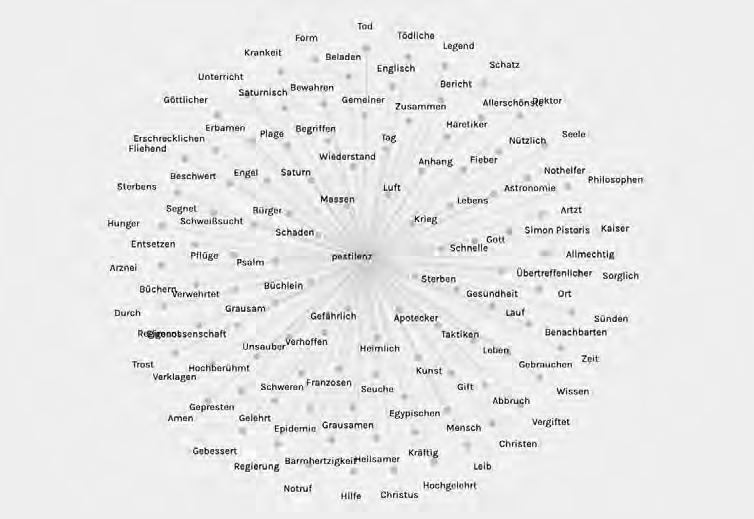
cesta.stanford.edu | 60
The Language of Plague Outbreaks in Early Modern Germany
by Niloufar Davis
As an intern on this project, my work consisted of two main tasks. First, I acquired data about plague outbreaks in Germany during the 16th and 17th centuries from the Biraben dataset. Second, I produced data visualizations of the relationship between plague outbreaks and their most commonly associated words.
In this visualization, phrases that are more closely associated are located closer together. The groupings show the strong interconnection between medicine, doctors, and healing, suggesting that medical discourses played an important role in writing about plague, perhaps more so than religious discourses.
To ensure that our dataset was as comprehensive as possible, I first identified additional sources using Gateway-Bayern.de, an archival website affiliated with the Bavarian Directory. Prior sources had been found using keyword searches for “Pest” and “Pestilenz,” (two German words for “plague”). I thought I might find more if I searched for “Krankheit” (sickness) and “erkrankt” (falls/fell ill) and read the associated entries to determine if they were referring to plague. After updating the database with my finds, I input the text data into Palladio, a Stanford-made data visualization software. I then generated word and phrase bubbles to reveal words associated most frequently with plague. One interesting finding was that terms for war, danger, and death were more closely associated with plague than religious terms.
61 | Center For Spatial and Textual Analysis
Student Researcher Niloufar Davis
Vietnamese Refugee Archive Exhibit
A screenshot showing the front page of the digital exhibit. The three images on the page are a photograph of the front of the museum, an illustration of a Vietnamese mother and her children, and a photograph of Vietnamese soldiers.
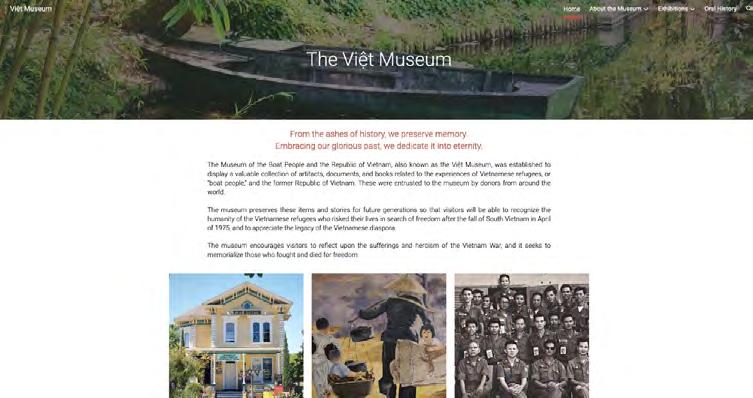
Project Description
Kelly Nguyen, IDEAL Provostial Fellow and Anhthu Vu Le, Việt MuseumThis project is a collaboration with the Việt Museum (Viện Bảo Tàng Việt Nam) located in San Jose, California. Founded in 2007 after over thirty years of planning and collecting, the Việt Museum is the first and largest museum dedicated to Vietnamese refugees. It holds art and artifacts related to the Vietnam War and the consequent displacement of approximately three million Vietnamese refugees, only about two-thirds of whom were eventually resettled, the others having perished at sea during their attempts to flee. The project follows the call by Critical Refugee Studies to “re-conceptualiz[e] refugee lifeworlds not as a problem to be solved by global elites but as a site of social, political and historical critiques that [...] make transparent processes of colonization, war, and displacement”. To that end, this project partnered with the Việt Museum in order to digitize the materials held there and to record oral histories related to them and to the experiences of Vietnamese refugees.
cesta.stanford.edu | 62
A Platform to Preserve Fragmented Histories
 by Elisa Lopez and Marguerite DeMarco
As the first and largest museum dedicated to Vietnamese refugees, the Việt Museum is the result of more than thirty years of planning and collecting. Through the efforts of the Vietnamese community and supporters, the museum opened to the public in 2007. The collection consists primarily of donations from members of the Vietnamese community throughout California. Those donors include Vietnamese veterans, refugees, descendants, and survivors of the “re-education camps.” The collection contains approximately 10,000 relics, artifacts, and artworks. In line with the values of the Việt Museum, the online exhibit seeks to honor and remember the experiences of the diasporic Vietnamese community.
A screenshot from the Vietnamese Refugee Archive Exhibit webpage, showing the clickable images which lead to the “About the Exhibit” page and to the three different sections of the exhibition: “Returning and Remembering”, “Crafting Survival”, and “Art in the Diaspora”.
Central to the Việt Museum’s current period of transition is developing an official collection inventory. The Vietnamese Refugee Archive Exhibit is the museum’s first curated online collection and first collaborative project. It seeks to make the collection of the museum more accessible to the wider public.
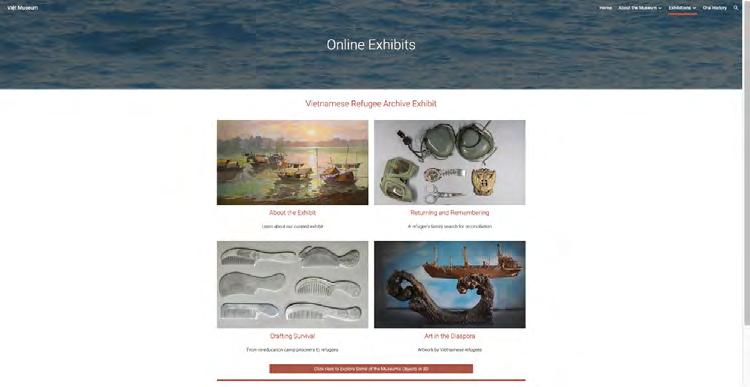
63 | Center For Spatial and Textual Analysis
Student Researcher Elisa Lopez
Our contribution to the project consisted of curating the collection of artifacts and crafting a narrative around them, and then building a website to display the exhibits we’d designed. Those exhibits are: “Returning and Remembering,” “Crafting Survival,” and “Art in the Diaspora.” We spent many hours crafting the website, taking photos of each object that was to be included, rendering some of the more visually interesting objects in 3D, and learning about the culture and history of Vietnam. The final project culminated in a published website that is now used by the Việt Museum.
A special thank you to the Vietnamese refugee community in San Jose, California, for sharing their stories with us, and to Stanford University Libraries’ Digitization Services and Stanford University Archaeology Collections for their assistance.
The oral history page features video interviews with Vũ Văn Lộc, the founder of the Việt Museum, and artist Hà Cẩm Đường.
Scan the QR code to visit the Vietnamese Refugee Archive Exhibit website, where you can learn more about the Việt Museum and explore the digital exhibits.
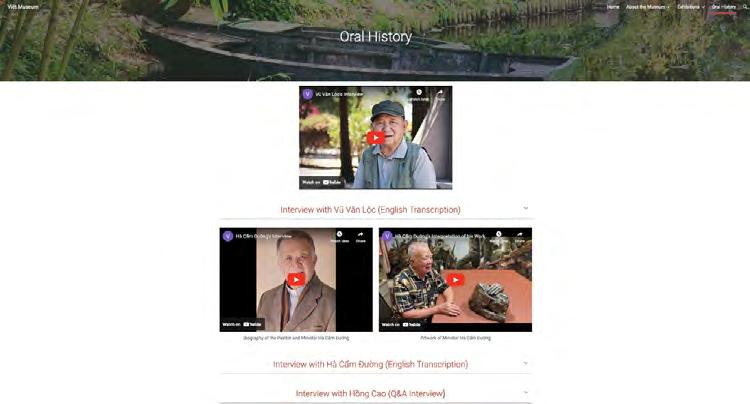
cesta.stanford.edu | 64
Student Researcher Marguerite DeMarco
Text Technologies
An interactive map created for Medieval Networks of Memory using the entries from a 13th-century mortuary roll. Each dot represents a titulus written by a different religious house and is color-coded to reveal different kinds of information gleaned from the roll.
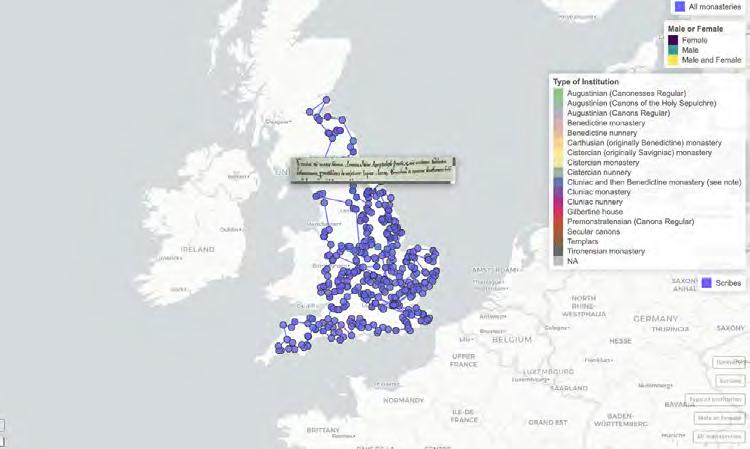 Project Description Elaine Treharne, Professor of English
Stanford Text Technologies (texttechnologies.stanford.edu) investigates all forms of human communication from 70,000 BCE to the present day in order to determine trends and characteristics in information systems.
Medieval Networks of Memory is one of several sub-projects under this umbrella. It aims to reveal a new and dynamic picture of 13th-century religious and social networks by describing, mapping, visualizing and analyzing unique and culturally rich textual artifacts— the Mortuary Roll of Lucy of Hedingham, now kept at the British Library (MS Egerton 2849, parts I and II), and the Mortuary Roll of Amphelisa of Lillechurch, which belongs to St John’s College, Cambridge (MS N. 31). Our team is currently building out a database for an interactive map, behind which will be locational, descriptive, textual, and evaluative evidence.
Ker 2.0 is another sub-project, consisting of a digital revision of the major 1957 catalog by Neil R. Ker (Catalogue of Manuscripts containing Anglo-Saxon [Oxford, 1957]), that is a catalog of all manuscripts containing English before 1220. Significant new discoveries have already been made thanks to the work of our research interns.
65 | Center For Spatial and Textual Analysis
Computer Vision for Mortuary Rolls
by Nikita BhardwajEight hundred years after the death of Prioress Amphelisa of Lillechurch in Kent, her mortuary roll endures. Mortuary rolls are manuscripts documenting prayers that monasteries and convents sent to other houses of the same order when an important member of their community died. At each house, a resident scribe inscribed a prayer for the soul of the deceased called a “titulus.” These mortuary rolls provide evidence of significant shifts in paleographical practices from c. 1220 to 1230. By studying the rolls, it is possible to observe a range of scripts, scribal practices, and competencies throughout this period.
An excerpt from the Mortuary Roll of Amphelisa of Lillechurch. This digital image is one of 47 used to train the titulus-detection model.
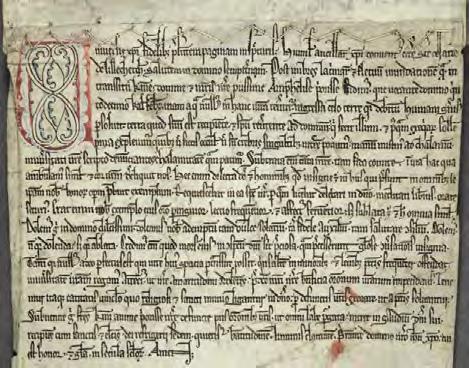
My work was to detect and classify tituli on mortuary rolls through computer vision and machine learning. I wrote a program that could detect and classify the bounding boxes of tituli to augment the growing database created by the team. The database contains information for each religious house inscribed on the mortuary roll that can be explored through an interactive map (see p. 65). Knowing the amount of space each titulus took up can tell us something about how important each titulus writer was, as well as providing information about script-writing techniques and human commemoration across time and space.
I developed a titulus-detection system using the Mask R-CNN deep neural network and the Detectron2 framework to identify and count the occurrences of tituli in the manuscripts. To create this program, I refined an existing model on a dataset of 47 digital images of the Prioress Amphelisa of Lillechurch mortuary roll. I first labeled the tituli on each of these digital images and uploaded annotations in the COCO format. I then fine-tuned a COCO-pretrained R50-FPN
cesta.stanford.edu | 66
Mask R-CNN model on the titulus dataset and created a predictor using the trained model. This model was able to identify tituli 98 percent of the time on the St. John’s Amphelisa roll. It therefore holds much promise for the study of similar Latin manuscript rolls.

An example of a page from the 13th-century Mortuary Roll of Amphelisa of Lillechurch after it was run through the titulus-detection program. The model was able to identify tituli on the roll 98% of the time.
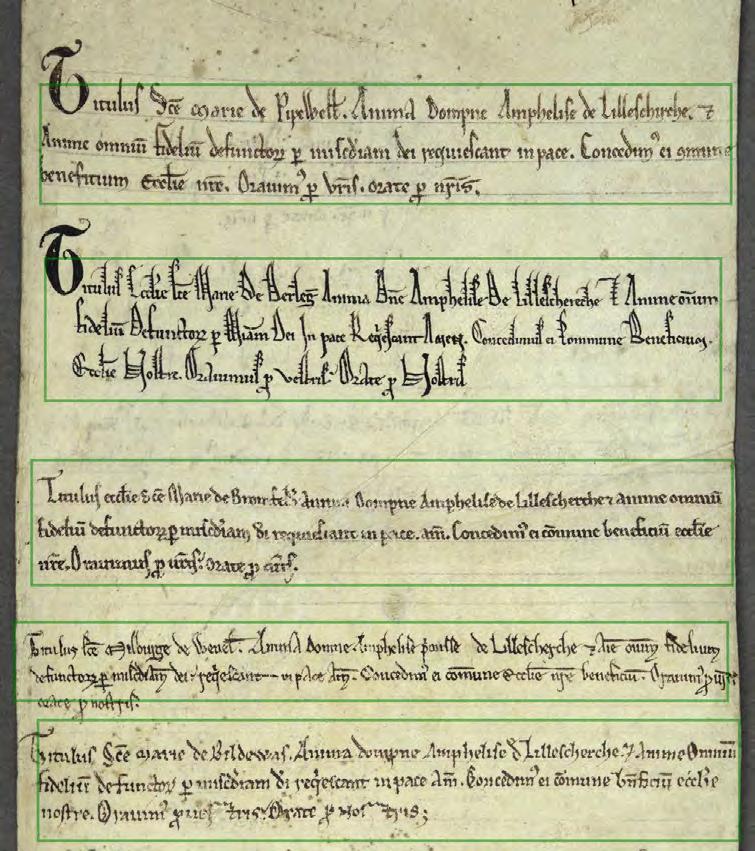
67 | Center For Spatial and Textual Analysis
Student Researcher Nikita Bhardwaj
A New Approach to OCR for Medieval Scripts
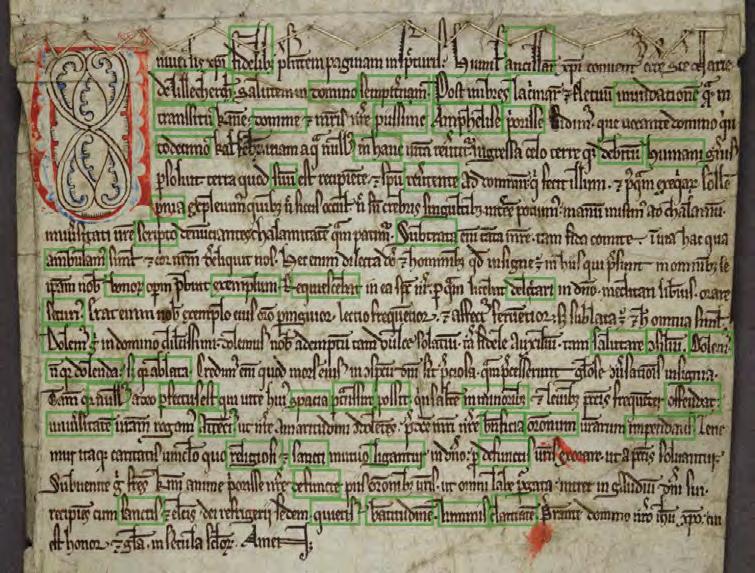 by Sera Wang
I worked with five images of the Mortuary Roll of Amphelisa of Lillechurch to test if Detectron2, an image recognition platform developed by Facebook AI Research (FAIR), had potential for optical character recognition (OCR) of medieval writing. In my first week on the project, I identified current research on OCR technologies for handwriting and scripts and developed an understanding of past and current research in digital paleography.
An example of one of the image outputs from the OCR code, showing a titulus from the Mortuary Roll of Amphelisa of Lillechurch. In the top left corner is a red illumination that marks the beginning of the titulus. The machine-generated green boxes are the shapes identified by the algorithm as constituting words. This image indicates that most of the words on the manuscript were not identified by the Detectron2 machine learning model.
With this foundational knowledge in place, I began adapting and testing machine learning code. The project team had previously developed code using Detectron2 to identify tituli in the scrolls (as discussed in Nikita’s project report above), and the aim was to adapt that code to identify individual words.
I overcame many challenges while working on this project, including learning to use Google Colab and how to change parameters in
cesta.stanford.edu | 68
our model to make the best use of our data. In the end, we found that while the model could recognize words with a high degree of accuracy, it omitted many words. We believe this may be due to the small sample size, to threshold issues, or perhaps to the fact that Detectron2 is not optimized for OCR. I wrote documentation about our experiments with this model so that future research interns can build on our experience.

My final task was to research the various priories, abbeys, and cathedrals that housed these mortuary scrolls in preparation for the launch of the Medieval Networks of Memory website. This research gave me a good idea of how various religious structures in medieval England operated, including the issues many of them faced with poverty, land disputes, and internal organizational challenges. I gained skills in using online databases and in collaborative research, as I was often building upon the work of other team members.
An example of an embedded manuscript image on the new platform for Digging Deeper, a massive open online course created by Text Technologies and offered through Stanford (see p. 73). On the new platform, high resolution manuscript images can be expanded for closer viewing.
Scan the QR code to visit the recently-launched Medieval Networks of Memory website, where interactive maps allow users to explore the journeys taken by two medieval mortuary scrolls and learn about the many religious houses which contributed to them.
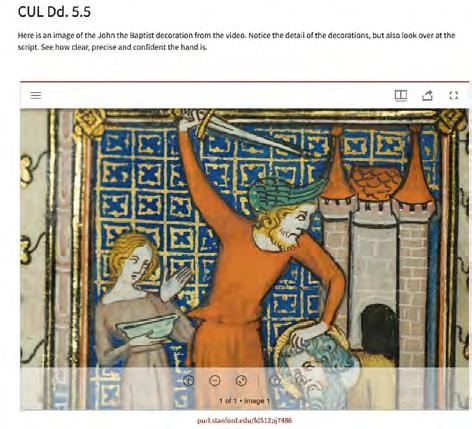 Student Researcher Sera Wang
69 | Center For Spatial and Textual Analysis
A Flexible Database of Medieval Scribes
 by Julia Fischer
My main project was to build a database of English language scribes from 1060 to 1220. Although there was an existing website containing this information, it had never been compiled in a flexible format. My task was to arrange the information to make it useful for future researchers. I used Google Sheets because it is easily accessible and can be exported into different formats. First I needed to determine how to structure the data. I wanted to clearly highlight the individual scribes, but the source website enumerated manuscripts, not scribes, and many manuscripts contained the work of multiple scribes. I therefore decided to organize the data by manuscript, assigning each manuscript a number, and assigning the individual scribes who worked on each manuscript a unique numerical code. For example, manuscript 48 might have scribes 48.1, 48.2, and 48.3. I also added hyperlinks to more information about each manuscripts and to digital images.
The other project I worked on was a website migration. The website of one of Text Technologies’ sub-projects, CyberText, was due to move to a new content management system that would be incompatible with some of the site’s content. My task was to create a static webpage using GitHub Pages and to transfer the content over, revamping the design in the process. This allowed me to learn more about website development and to make a meaningful contribution toward preserving digital humanities scholarship.
The original CyberText website, which is being transferred to GitHub Pages.cesta.stanford.edu | 70
Student Researcher Julia Fischer
Building a Digital Version of a Manuscript Catalog
by Eren Yurek and Sera WangIn 1957, the medievalist Neil Ker published an extensive edition of a large number of medieval English manuscripts. The Ker 2.0 project aims to create a digital re-edition of Ker’s work with additional features incorporated to increase its usability. The goal is to gather all available information, bibliography, and internet resources concerning the manuscripts described by Ker and collect them in one new book and website within a consistent format. A further goal is to identify and remove the subjective language Ker used in his manuscript descriptions.
Our main focus during our internship was copyediting the Ker entries one by one, which was a meticulous process! As there isn’t an existing digital version of Ker’s book, we used a software called Transkribus to perform optical character recognition (OCR). OCR technologies still struggle to recognize medieval text, which often includes characters specific to Old English and other Germanic languages, such as þ (thorn), æ (ash), ð (eth), and ƿ (wynn), so we needed to correct these characters manually.
A schematic representation of the Ker 2.0 project and its background. The first image is a page of a medieval manuscript, which represents the sources that Ker worked from when producing his Catalogue. The second image is an entry from Ker’s Catalogue, published in 1957. The third image shows a Google Doc containing the transcription of the published entry with the addition of relevant information. The green arrow indicates the transformation that Ker 2.0 is currently focused on.
There has been lots of research conducted on these manuscripts since Ker made his catalog, and the second major task we worked on was compiling this scholarship for incorporation into the digital
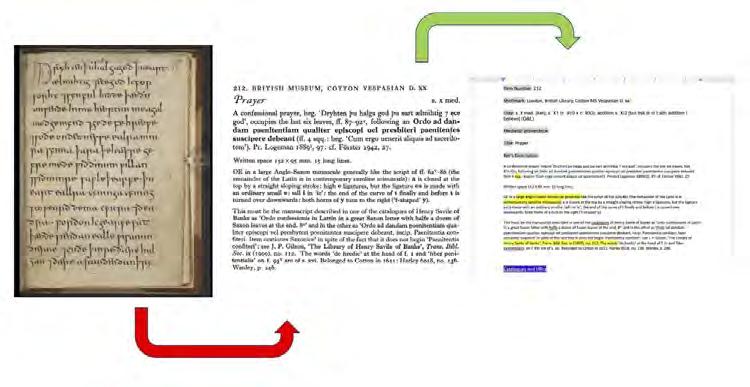
71 | Center For Spatial and Textual Analysis
re-edition. We collected links from the British Library, Parker on the Web, Digipal.eu, NUI Galway’s “Earlier Latin Manuscripts” project, which digitized E. A. Lowe’s Codices Latini Antiquiores, and em1060. stanford.edu. We also included the bibliography from Gneuss and Lapidge’s Anglo-Saxon Manuscripts: A Bibliographical Handlist of Manuscripts and Manuscript Fragments Written or Owned in England up to 1100 (2014) and Donald Scragg’s A Conspectus of Scribal Hands Writing English, 960-1100 (2012). None of these resources was as expansive as Ker’s catalog, and there were some points on which they disagreed with each other.
A screenshot of Ker 2.0’s spreadsheet with the names of editors, the current stage of the entry, a color code indicating difficulty, and comments about the entry.
During this process, we were particularly concerned with maintaining progress between current and future interns, so we developed ways to keep track of our work and ensure its legibility. We completed around 200 entries during the summer, and it was a great learning opportunity in terms of codicology, paleography, and manuscript studies. We not only learned skills related to transcription technologies, project management, data gathering and cleaning, and digital sustainability, but learned how to access, read, and critique the physical, digital, and bibliographical afterlives of Old English manuscripts.
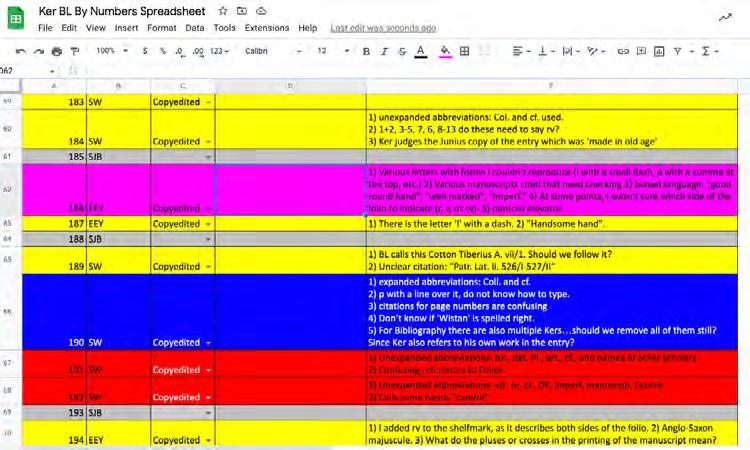
cesta.stanford.edu | 72
Student Researchers Eren Yurek (left) and Sera Wang (right)
A New Platform for “Digging Deeper”
 by Ronit Jain
My work with Text Technologies centered around Digging Deeper, a Stanford Massive Online Open Course (MOOC) that aimed to make studying medieval manuscripts accessible to anyone interested. However, the MOOC recently had to go offline because of a compatibility issue with its online platform. I focused on building out a new platform that would house the MOOC content using both Spotlight and digital assets contained in the Stanford Digital Library.
I first aggregated, organized, and cataloged course materials. These consisted of diverse media ranging from instructional videos to manuscript images to practicums. Next, I turned my attention to organizing these materials into modules that made the most pedagogical sense. This involved considering different spatial arrangements of text, embedded video, and images to determine which best facilitated comprehension and ease of navigation. Finally, I prepared the site to launch. It is my hope that my work will make the study of medieval manuscripts widely available in an interactive, easy-to-digest, and user-friendly interface.
Textual information organized on a Digging Deeper course module page on the platform developed by Ronit Jain. Digger Deeper is an online course, created by Text Technologies and offered through Stanford University, which aims to make the study of medieval manuscripts accessible to anyone who is interested in them.
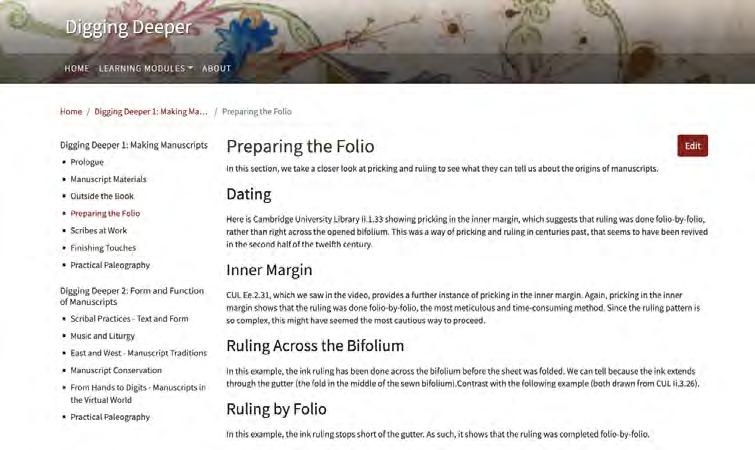
73 | Center For Spatial and Textual Analysis
Student Researcher Ronit Jain
Obelisks of South Africa
This map displays all obelisk items in the project database and is shown on the site’s landing page. Each location marker links to more details on the individual obelisk, such as its geographic coordinates, height, material, inscriptions, date, and the reason it was erected.
Project Description
Grant Parker, Associate Professor of ClassicsThis project maps South African uses of the obelisk form as a subset of monuments and memorials. These tapering stone placemarkers reflect diverse histories of the country, yet our digital catalogue raisonné reveals that these were the monument of choice for white Afrikaners in the 19th and especially the early 20th century. Why obelisks? A detailed response to this question needs clarity on specific contexts as well as the available choices of form and medium. This project, ostensibly focused on a few hundred examples, represents the intersection of several larger projects, namely investigations into the nature of collective memory; of ‘Egyptomania’, the western fascination with Egypt; and of history of the obelisk form from the pharaohs to modern times.
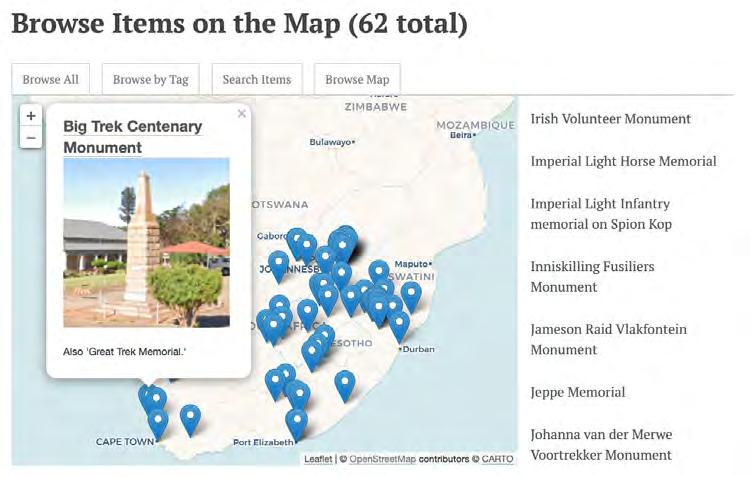
cesta.stanford.edu | 74
Digitizing South Africa’s Obelisks
by Junah JangWhat is the history and significance of obelisks in South Africa? Websites, such as artefacts.co.za, and organizations, such as the South African Heritage Resources Agency, have gathered broad records of South Africa’s diverse monuments and structures, significant buildings, and other historically notable locations. However, little attention has been devoted specifically to obelisks.
As an intern on this project, I assisted Prof. Parker with his research on memorialization and Egyptomania by building a database of obelisks in South Africa. I then translated this data to an accessible web format. By focusing on obelisks specifically, we hope to gain a broader understanding of their relationship to nationalism and commemoration.
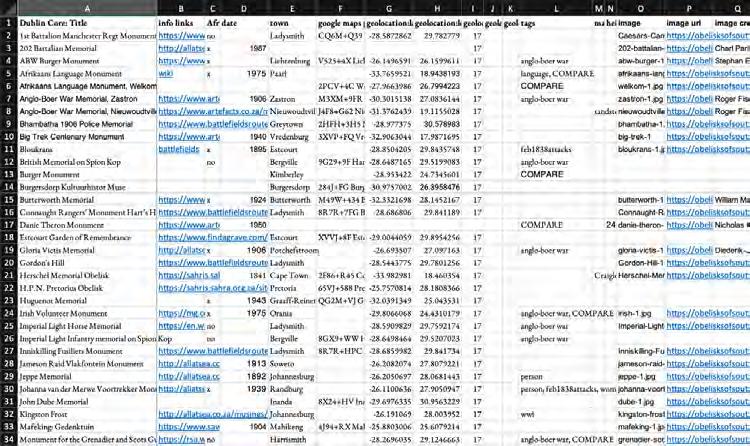
A screenshot of the project’s database of obelisks and obelisk-reminiscent monuments. Each row represents an individual structure.
Several highly visited and well-maintained obelisks exist in South Africa, including the National Women’s Monument in Bloemfontein. However, many more stand in private cemeteries and remote areas, evading conventional identification tactics. Prof. Parker and I were also interested in recording structures that do not fall neatly under the ‘obelisk’ label but are reminiscent of the form. For this reason, I cross-referenced Google Maps, historical blogs, various websites, and many print resources (field guides, architectural records) to find and consolidate metadata for individual obelisks and obelisk-like monuments. The final database contains detailed information about
75 | Center For Spatial and Textual Analysis
Five different obelisks located around Isandlwana Mountain, the site of a battle between the British Empire and the Zulu Kingdom in 1879. These images are pulled from print resources and Google Maps but are not identified or marked as specific locations. As a result, they are difficult to identify without additional fieldwork.
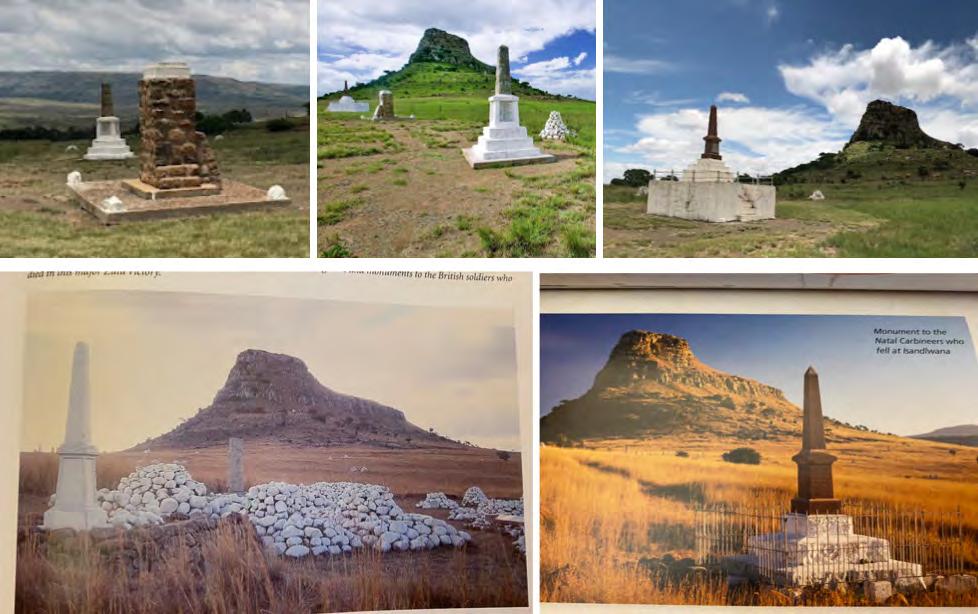
each monument, including its geographic coordinates, height, material (if known), inscriptions, date, and the historical context of its construction or its reason for being built.

I initially used the software QGIS to plot our obelisks on a map of South Africa. However, we eventually pivoted to Omeka, a more interactive and gallery-like platform. Learning to use Omeka, in conjunction with mapping plugins, allowed me to curate a digital exhibition that simultaneously centers on a map of all obelisks while showcasing the history of each individual obelisk.
This digital exhibition has much potential for future development. The project as a whole would benefit from in-person fieldwork to acquire missing data and provide more granular metadata (for example, so that obelisks could be sorted by decade, by association with Afrikanerdom, or by their form). We look forward to the storytelling potential of this work, which highlights both the individual uniqueness and collective impact of South African obelisks.
cesta.stanford.edu | 76
Student Researcher Junah Jang
Warhol’s Photo Archive
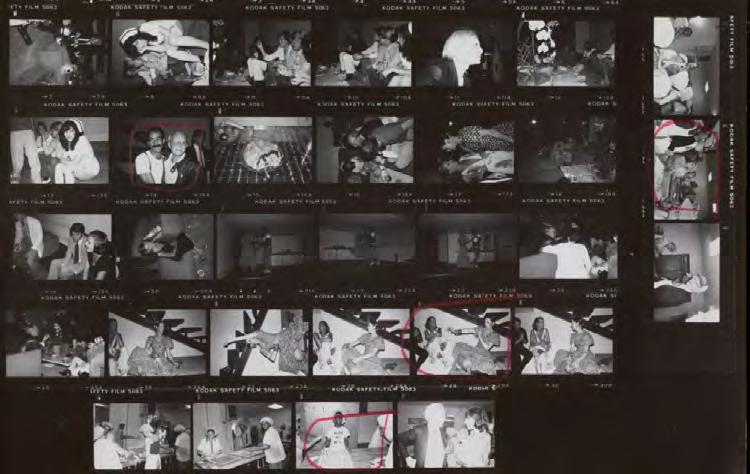
Project Description
This project originated when the Andy Warhol Foundation selected Stanford University to be the home for a collection of more than 3,600 of the artist’s contact sheets. The project has already resulted in a special exhibit at the Cantor Arts Center and the book Contact Warhol: Photography Without End. Warhol brought his camera with him everywhere, taking at least 36 exposures each day in the last decade of his life. Warhol’s practice of documenting the moment anticipates the ubiquity of the cell-phone camera today. The collection includes over 130,000 digital files, each depicting a single exposure from the 3,600 contact sheets. Machine-learning tools will help scholars find new paths through the digital archive in the future.
77 | Center For Spatial and Textual Analysis
One of Warhol’s contact sheets covering Brooke Shields’ eighteenth birthday party. The project explored notions of transition and ephemeral movement apparent in Warhol’s practice of taking repeated images of the same scene.
© The Andy Warhol Foundation for the Visual Arts, Inc.
Peggy Phelan, Professor of Theater and Performance Studies and English
Capturing Fleeting Moments in the Andy Warhol Photo Archive
by Arethea Ann Sian LimI explored the rich digital archive of over 100,000 images in the Stanford University Libraries Spotlight Exhibit, “Andy Warhol Photography Archive. Contact Sheets: 1976 - 1987”, working with Prof. Phelan to uncover thematic narratives that emerged from the photographs that Warhol took over the course of his artistic career.
After surveying the topics covered in the contact sheets, we decided to focus on birthday celebrations hosted by or for celebrities. In my research, I proposed that Warhol sought to create a more personable and relatable presentation of celebrities in his birthday party images. These images allow viewers to celebrate a celebrity, not for their persona but for who they were as a person, by presenting celebrities from a friend’s perspective instead of the media’s.
An image taken from Warhol’s belated 51st birthday celebration, through which the project explored the notion of childhood nostalgia and birthday traditions.

© The Andy Warhol Foundation for the Visual Arts, Inc.
I surveyed close to 100 contact sheets and worked with Prof. Phelan to identify the themes running through the images, including the
cesta.stanford.edu | 78
idea of the ‘fleeting moment,’ the raw image, and the dialogue between public and private. Beyond conducting this visual analysis, I read through autobiographical and scholarly texts and essays about photography and about Warhol’s work on party culture, including his diary entries.
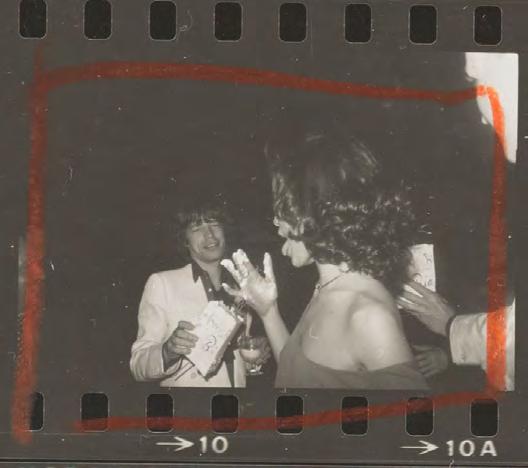
I then analyzed the medium of contact sheets itself, and how they act as a medium of transition that mirrors processes of aging and movement. Our aim is to publish an article to accompany the Spotlight exhibition on different topics surrounding the theme of birthday parties—pure joy, the unnoticed, rituals, and the self-portrait.
We explored the idea of the raw and unfiltered image through a scene Warhol captured of Bianca Jagger, unaware of his presence, unposed and at ease.
© The Andy Warhol Foundation for the Visual Arts, Inc.
Scan the QR code to visit Stanford University Libraries’ digital Spotlight exhibit “Andy Warhol Photography Archive: Contact Sheets 1976–1987.” The exhibit images, which are held by Stanford’s Cantor Arts Center, can be filtered by topic, date, or region, and users can browse selected images in 22 categories, including “Artists”, “Musicians”, “Nightclubs”, and “Nudes”.
 Student Researcher Arethea Ann Sian Lim
79 | Center For Spatial and Textual Analysis
Grand Tour Project
A screenshot of the default view of the Map of Travel Places in the “Visualizations” section of the project website. In the yellow boxes are suggestions for changes to improve the usability of the map.
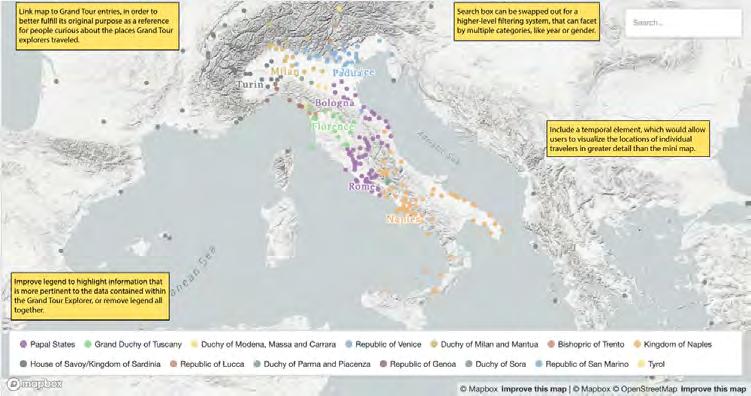 Project Description Giovanna Ceserani, Associate Professor of Classics and Faculty Director of CESTA
In the 18th century, thousands of Northern Europeans traveled to Italy for a journey of cultural and symbolic capital they called the Grand Tour. These travels were a formative institution of modernity, contributing to a massive reimagining of politics and the arts, the market for culture, ideas about leisure, and the practices of professionalism. Since 2008, the Grand Tour Project (grandtour. stanford.edu) has generated digital tools, analysis, and visualizations to bring us closer to the diverse travelers who collectively represent 18th-century travel to Italy. We have been digitizing and enhancing John Ingamells’ Dictionary of British and Irish Travelers to Italy 1701-1800 to create a searchable database of more than six thousand entries. As we work towards the public release of this interactive database with an accompanying digital volume of explanatory essays, this year’s interns focused on two lines of research: a critical review of data integrity and features of the interactive interface; and new research on the traveler John Symonds (1730-1807), following the discovery of more of his unpublished journals.
cesta.stanford.edu | 80
Visualizing Family Connections
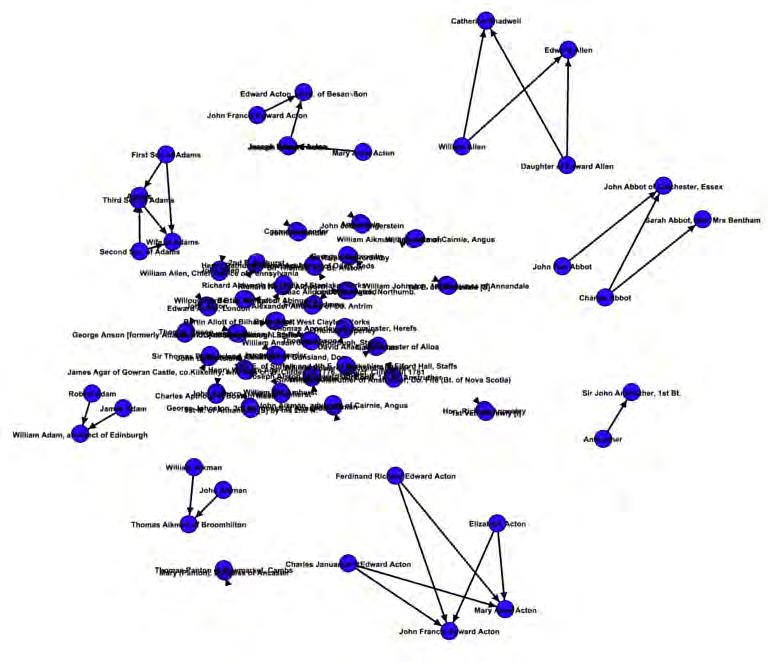 by Nicholas Clark
The Grand Tour Explorer database contains information on approximately 6,000 travelers from Britain and Ireland to Italy. In the past, researchers on this project have developed visualizations grouping travelers according to when they traveled and how many tours they took. My goal was to develop a similar framework to visualize each traveler’s familial connections.
First, I sought to understand how many travelers in the database have information about their familial connections. I decided to focus on parent-child and spousal relationships as these were the most common relationships mentioned in the entries. Nonetheless, fewer than half of the travelers’ pages contain information about parents or spouses and only about one-fifth contain information about children.
I then worked to improve the visualization framework that I had previously developed. On my first attempt, I used a Python network
An early graphical representation of the family networks of approximately 60 individuals. The layout is called “Force Atlas” and pushes the larger family groups to the edges. This iteration only includes parent-child relationships.
81 | Center For Spatial and Textual Analysis
A later graphical representation of family networks. Individuals contained in the project’s database of travelers are in green and their family members who are not included in the database are in pink. The blue arrows indicate parent-child relationships and the yellow lines are marriages.
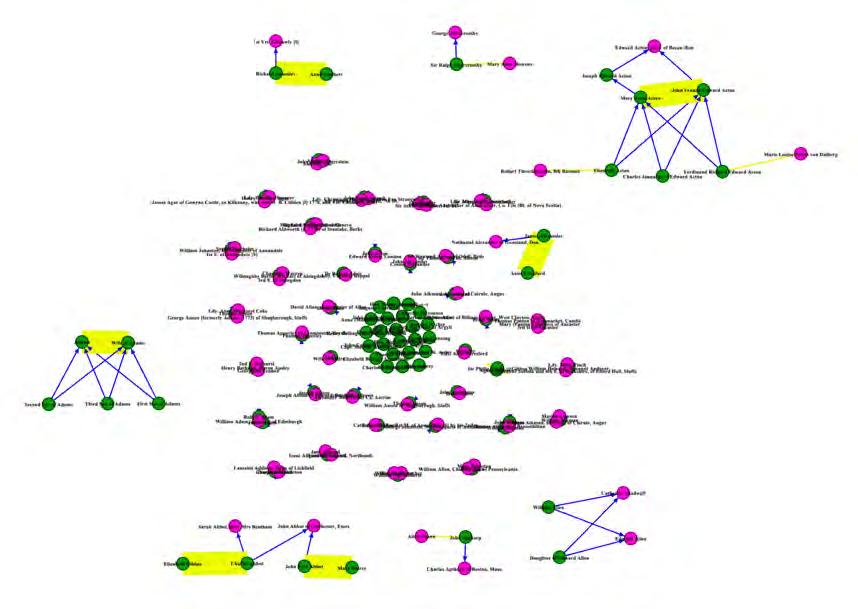
visualization library but ran into problems representing individual family networks in a compelling way, including inadvertently merging parental and spousal relationships. To fix this, I used a graphical tool called Gephi that allowed for more effective customization and far more compelling visuals. The most critical step for using this tool was assembling the dataset of individuals and their connections. Once the dataset was curated correctly, creating and properly labeling the edges and vertices of the graph was a simple matter.
The development of a useful visualization took several iterations. In the first iteration, I focused on the most effective way to show individual family groups. By my final iteration, I was able to display several large family groups within a subset of the travelers.
Moving forward, one way to build on my work would be to find an effective way to include all travelers in one visualization. However, given the large size and complexity of the database, it might be desirable to allow the user to filter by different subsets of travelers.
cesta.stanford.edu | 82
Student Researcher Nicholas Clark
Investigating Equity in Grand Tour Data
by Sarah PincusAs an intern on the Grand Tour Project, my work focused on two different areas: aiding with the review of data and considering data equity in the Explorer’s database and interface, both undertaken to support preparation for the publication of the Grand Tour Explorer.
The entry for Catherine Graeme in the Grand Tour Explorer. Her page instructs the user to view the page of her husband for more information. Relocating information about Catherine Graeme to her own entry is one way that future iterations of this project could improve data equity.
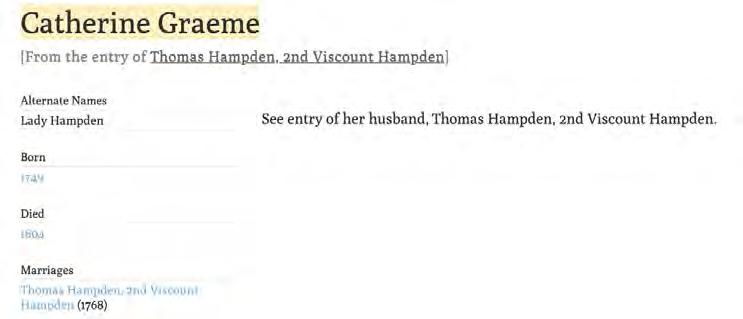
The data review process involved identifying and resolving inconsistencies and errors in the Explorer’s data. For example, we noticed that some travelers had multiple names in the database, so we needed to ensure that the number of names was not being used anywhere on the site as a proxy for the number of travelers.
My work on the project’s data equity was inspired by Catherine D’Ignazio and Lauren Klein’s book Data Feminism, which demonstrates the importance of an intersectional feminist approach to data science. One important issue for the Explorer is how to display the often overlooked stories of women who embarked on the Grand Tour.
The Grand Tour Project has done fantastic work in this area by creating hundreds of independent entries for women travelers out of mentions of them in the entries devoted to male travelers (often their husbands) in the original Dictionary. Such entries contain biographical data extracted from the source entry but they do not contain a biographical text, as composing new text or modifying existing text was never intended to be part of the Grand Tour Project.
83 | Center For Spatial and Textual Analysis
To take one example, Catherine Graeme (1749-1804) toured Italy three times yet did not have an entry in Ingamells’ Dictionary, instead appearing in the entry of her husband, Thomas Hampden, 2nd Viscount Hampden. In the Explorer, the Grand Tour Project team has given Graeme an independent entry, which makes it possible to easily locate her in the data. At the same time, the biography of her life remains within the original entry on her husband’s page. When a user views her page in the database, they are therefore instructed to view the page of her husband.
This inadvertently risks creating the impression that she wasn’t significant, when in fact, most of the content in Thomas Hampden’s entry is actually about Graeme! My view is that in cases such as this, where we have large amounts of documented biographical information for a female traveler, it may be worth reconsidering the project’s approach to the Dictionary and creating a new and independent entry for that traveler. This would help to reinforce the importance of women as Grand Tourists in their own right—and not just as companions for their husbands and male family members.
Detail of a portrait of Catherine Graeme Hampden by J. Hoppner (1786). While Graeme did not have an entry in the original Dictionary of Grand Tourists, much of her husband’s entry is devoted to her. This raises questions of how this data should be represented in the digital Grand Tour Explorer.
Scan the QR code to visit the website of the Grand Tour Project, where you can learn more about the project’s history and explore interactive visualizations of Grand Tour data.
cesta.stanford.edu | 84
Student Researcher Sarah Pincus
Improving a Data-Driven Map
 by Eliot Jones
My work on this project primarily revolved around two tasks: conducting a review of the data in the database, and brainstorming changes that could be made to enhance the usability of the Map of Travel Places in the “Visualizations” section of the website.
When we looked at the current implementation of the map, we identified a few aspects to improve prior to the Explorer’s publication. In particular, although the map’s purpose is to provide geographic context for users of the database, the information it currently offers is quite limited. In the next phase of development, I believe that adding the ability to filter and facet the data in order to visualize specific groups of people would be the most effective single change. Beyond that, adding the ability to reference the map from the entry of each individual traveler will help users to quickly contextualize entries.
Through my time working on the Grand Tour Project, I became intimately familiar with the inner workings of the Explorer and its dataset. Despite the majority of my work being behind the scenes, I hope that future iterations of the Explorer will be improved by what we accomplished this summer.
A screenshot of the Map of Travel Places, zoomed in slightly to highlight details of the basemap and issues with the visual representation. The yellow boxes are comments illustrating potential changes to be made in order to improve the quality of information that the map provides.
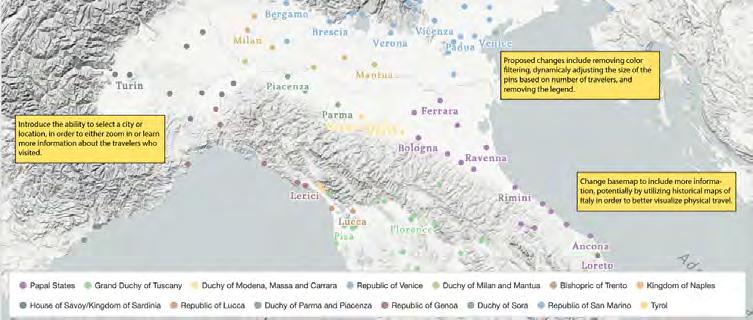
85 | Center For Spatial and Textual Analysis
Student Researcher Eliot Jones
Automatic Transcription of 18th-Century Travel Journals
by Margot HutchinsDuring my internship with the Grand Tour Project, I worked to transcribe the handwritten travel journals of John Symonds, which offer a detailed account of his journeys through Europe in the late 18th century. The journals are handwritten in cursive script and describe the agriculture, culture, architecture, and history of the places he visited in Western and Southern Europe, with a particular focus on Italy. Though the journals are written primarily in English, they often contain passages in Italian, Latin, and French.
I began transcribing the journals manually, which was made more difficult by water damage, spelling errors, and small handwriting. After spending many hours transcribing tens of thousands of words, I finally had a large enough sample to pivot to developing AI models using Transkribus, a text-recognition software. Transkribus broke up the pages line-by-line, which required reformatting my transcriptions and editing them to ensure that each word in my transcription represented what was on the page. However, once I input my data, I was able to quickly develop AI models to systematically transcribe the remainder of the journals using character-recognition software.
While my Transkribus model transcribed some journals more accurately than others due to the consistency and clarity of the handwriting, most transcriptions were completed with between a 90% and 97% accuracy rate. After generating these rough transcriptions, I combed through them to fix spacing errors, spelling
A screenshot of the Transkribus interface, showing a trained model with a 3.2% character error recognition on the validation set. This is an error rate within acceptable bounds for machine transcription, especially as I manually validated the transcriptions.
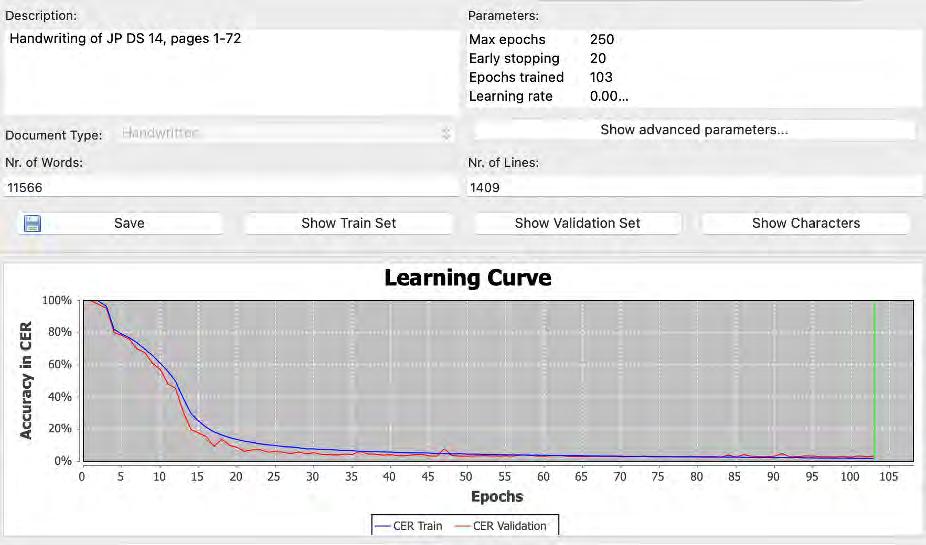
cesta.stanford.edu | 86
A screenshot showing line-by-line automatic transcription. Notice that the transcription model retains all formatting, punctuation marks, and capitalizations.
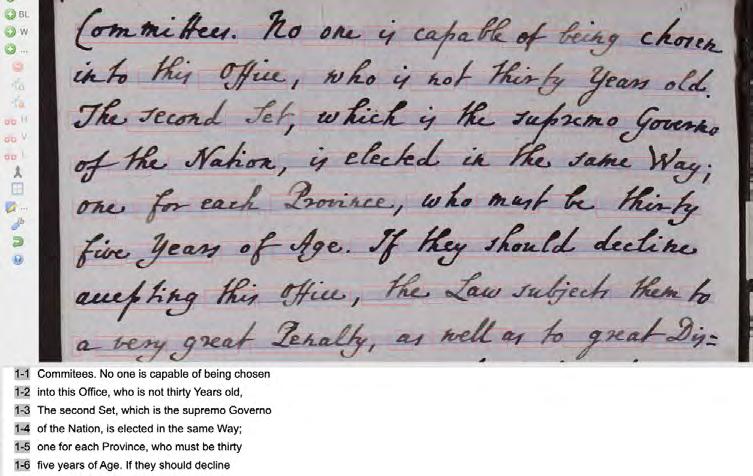
mistakes, and formatting inconsistencies, and to manually transcribe the phrases in other languages.
Though Transkribus required a bit of getting used to, it became much more efficient and useful once I adapted my methods to suit the needs of the software. By developing models using different samples of Symonds’ handwriting to reflect the differences in style between the journals, the models and the accuracy of my subsequent transcriptions improved.
Another aspect of my research was an analysis of the language Symonds used in his journals. I was eager to explore Symonds’ biases and his impressions of each region in which he traveled, so I began to explore various natural language processing techniques.
From this research, I developed a preliminary word2vec model in Python that could be used to analyze and visualize linguistic relationships across the journals. I also utilized stylometric techniques to generate curves of composition, which show the frequency distribution of word lengths for each journal, and began to explore how stylometry could detect Symonds’ writing style changes across each journal, especially those that I hypothesize were written for public consumption versus for his own usage.
87 | Center For Spatial and Textual Analysis
Student Researcher Margot Hutchins
Visualizing the Trials of Slavery at the Cape
A heatmap of all the locations mentioned in the 87 trials that could be confidently identified. The heatmap reveals that runaways often moved from the Cape of Good Hope to areas around False Bay and Stellenbosch. Some, such as Augustus van der Caab, escaped to even more remote areas before capture. The labels are named after the person in whose trials the location was referenced.
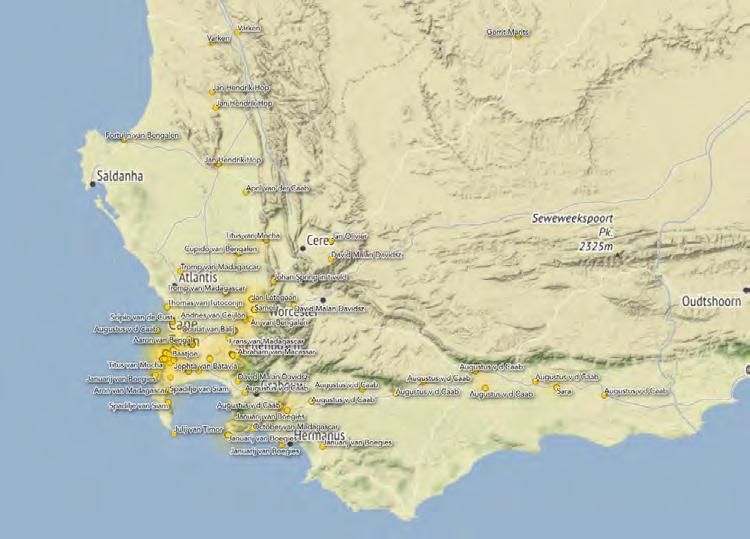
Project Description
Grant Parker, Associate Professor of ClassicsHow might we understand the experiences of enslavement at the Cape of Good Hope in the long 18th century, and what are its legacies? As an exercise in commemorative justice, this project distills narratives out of court documents involving enslaved persons (1704-1795). Our goal is to republish the selected legal documents online in such a way that provides readers with rich context, including maps and other images. We especially seek to make our website a publicly available resource that can be used by school learners, teachers, students, tourists alike—in fact by anyone interested in histories and legacies of enslavement, in South African settings and beyond.
cesta.stanford.edu | 88
Mapping the Paths of Escaped Slaves
by Fiona ClunanThis project aims to render the experiences of enslaved individuals from the Cape visually compelling and accessible. Building on the work of past CESTA interns, I mapped locations mentioned in Dutch court documents that recorded the trials of enslaved men and women from the 18th-century Cape of Good Hope. Visualizing this data, which reveals the paths that escaped slaves took and the places they frequented, provides a glimpse into the lived experiences of those enslaved at the Cape of Good Hope. The maps I have produced include individual journeys and data aggregated from across the whole collection of trial documents.
This map illustrates the path of Augustus van der Caab and other enslaved runaways who fled Cape Town to escape servitude. They hoped to journey from the colony to the “Land of the Caffers,” a place thought to be beyond the reach of Dutch control. The group ventured almost 150 miles from the Cape using forged documents to ease their travel. They were only captured after committing several murders outside Swellendam.
Identifying the exact locations of places mentioned in the 18thcentury documents was not straightforward. I began by searching the Dictionary of Southern African Place Names for named locations. I then searched the internet for travel accounts and birth and death records, connecting names to places. For some farms, it was even possible to identify their locations based on records of property lots archived on South African government websites. Google Maps also proved helpful for finding places whose names have remained similar over the past 250 years.
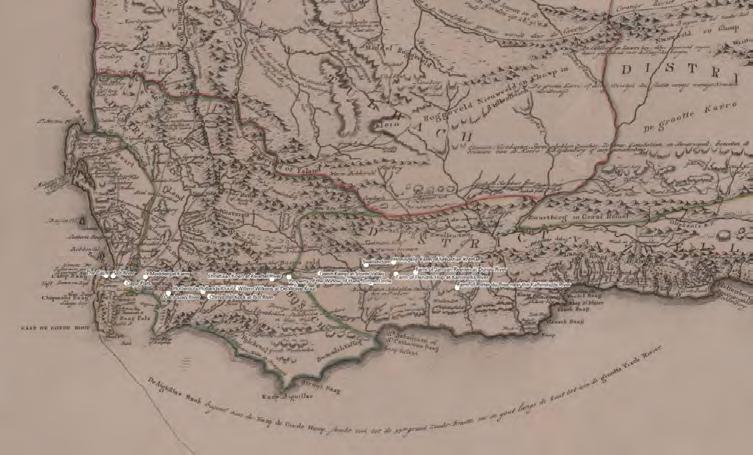
89 | Center For Spatial and Textual Analysis
However, this process was not without its challenges. Variable orthography made identifying historical place names complex. Moreover, the landscape itself has changed since the 18th century. For example, certain rivers noted in the accounts no longer exist or have changed course due to dams. Historical maps provided by South African colleagues were beneficial, allowing me to identify old farms and named places.
After locating the places as precisely as possible, the next step was to produce effective maps. Using QGIS software, I first produced a heat map highlighting locations mentioned repeatedly in trials. I then generated a precise map of the specific trial of Augustus van der Caab. In the future, the maps and location data will be published on a website dedicated to hosting information on this project.

This historic map was particularly useful for finding the locations of Honingklip, the farm where Augustus van der Caab and his companions committed murder, and the Karnmelks River, which the runaways crossed. The Karnmelks River now exists only as an unnamed tributary of the Slange River.
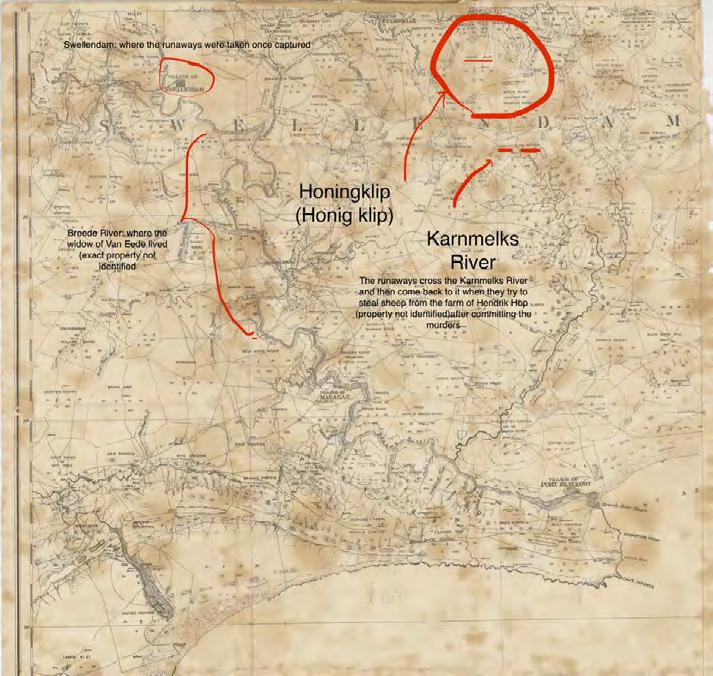
cesta.stanford.edu | 90
Student Researcher Fiona Clunan
OpenGulf
The OpenGulf project uses historical datasets to open up new research questions in the field of Gulf Studies. This map shows the number of weapons reported by British sources (orange) and by Ottoman sources (purple) in the Northern Gulf and Iraq, 1908-1909.
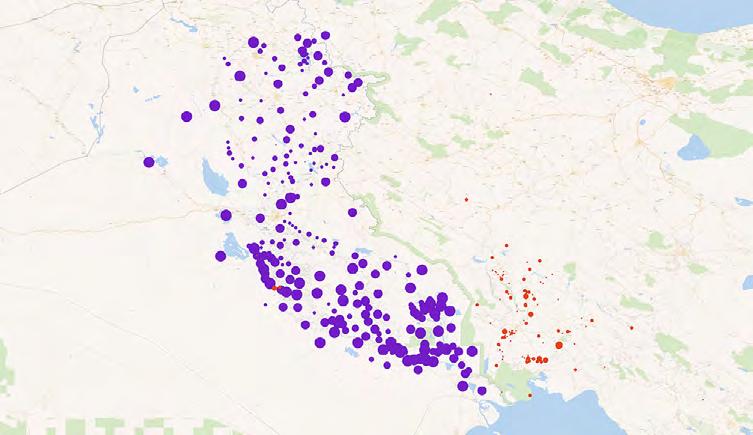
Project Description
OpenGulf (opengulf.github.io) is a transdisciplinary, multi-institutional research project analyzing historical texts produced in the Arabian Peninsula, Iran and Iraq from the early 19th century to the present. The various sub-projects associated with OpenGulf publish open historical datasets, corpora and digital exhibitions with the aim of opening the field of Gulf Studies to digital historical exploration, analysis and interpretation in the service of open research and pedagogy. Currently, OpenGulf includes six sub-projects, with students, faculty and staff at eight institutions actively contributing content. During the 2021-2022 academic year, CESTA interns worked on the Historical Texts as Data sub-project, which follows a general three-step workflow: preparing historical texts in various media formats and languages for digital analysis; extracting and annotating names of people and places in those texts to create reusable structured data; and creating and publishing visualizations and narratives derived from those datasets.
91 | Center For Spatial and Textual Analysis
Nora
Barakat, Assistant Professor of History, and David Wrisley, Associate Professor of Digital Humanities, NYU Abu Dhabi
Creating a Gazetteer of the 20th Century Gulf: Data Disambiguation
by Defne Genç, Atash Heil, Rhea Kale, Mohammed Khalil, Enkhjin Munkhbayar, Khosiyat OripovaAs interns on the OpenGulf project, we worked closely with an existing dataset of geographical entities from John G. Lorimer’s Gazetteer of the Persian Gulf, Central Arabia and Oman, a 20th-century British geographical dictionary divided into discrete regions of the Gulf. Our team checked locations of the Persian Coast and Trucial States sections of the dataset for accuracy using a disambiguation workflow.
The disambiguation process is an important step toward publishing the dataset of place names derived from Lorimer’s Gazetteer (c. 20,000 discrete locations) as a spine for an interactive digital gazetteer of the Persian Gulf region that will eventually integrate texts produced in multiple political contexts and in multiple languages.
To check the existing dataset for accuracy, we used AntConc—a freeware toolkit for text analysis—to find each location in Lorimer’s Gazetteer and verify that the description matched that of the dataset. After confirmation, we assigned each location a unique geographical ID using GeoNames, an online geographical database containing over 27 million place names and 15 million alternate names. As our
A diagram of the disambiguation workflow used to verify the accuracy of location descriptions in the dataset produced from Lorimer’s Gazetteer
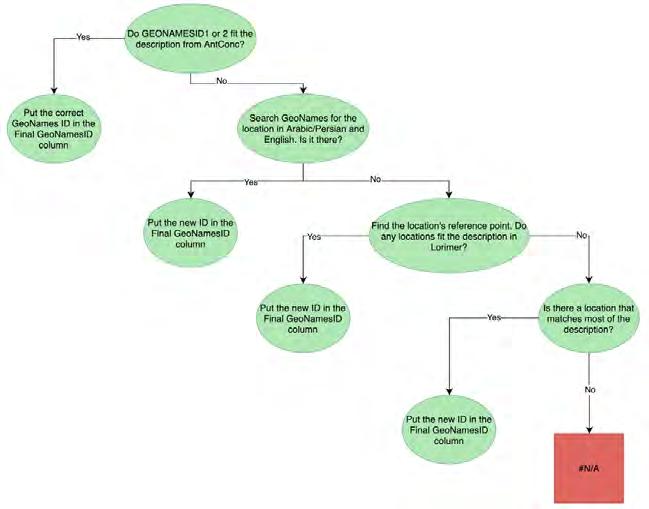
cesta.stanford.edu | 92
team checked locations of the Persian Coast dataset, fuzzy search was particularly useful when searching for non-English place names. We also made use of the “feature class” identification data in GeoNames, which sorts contemporary place names into classes like “populated place” and “first-order administrative division” but also “valley” and “well.” To the extent possible, we tried to match GeoNames feature classes to the historical descriptions (e.g. of towns vs. districts) contained in Lorimer’s Gazetteer.
A 1905 map of the Persian Gulf, Oman and Central Arabia
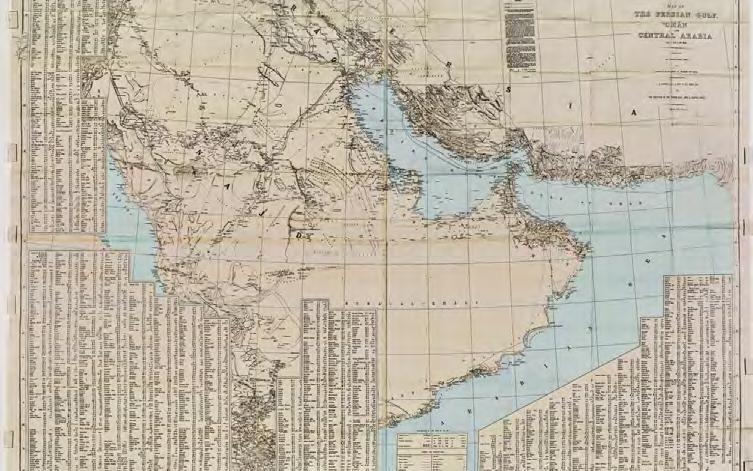
We also searched for difficult-to-locate place names in additional databases, such as Google Maps. The “measure distance” tool in the Google Maps interface proved particularly helpful, as Lorimer’s original text provides distances and directions of a place to reference points such as towns or rivers.
Often, these disambiguation efforts suggested place name changes commissioned by central governments during eras of political dispute. This granular project of historical gazetteer construction also highlighted the urban development that has occurred within Gulf countries, revealed by the changing landscape of locations, from desert landscapes to metropolitan areas.
 Student Researcher Rhea Kale
93 | Center For Spatial and Textual Analysis
made by F.F. Hunder in consultation with J.G. Lorimer. Public Domain.
Multilingual Text Research on the Gulf

 by Defne Genç, Atash Heil, Enkhjin Munkhbayar, and Khosiyat Oripova
Since 2019, OpenGulf and its affiliates have been locating, preparing and digitally analyzing texts in languages other than English produced in multiple political, linguistic and regional contexts in the Gulf. These endeavors seek to widen the scope of modern Gulf studies beyond the study of English texts produced by British officials, which have dominated the field. These texts will also enable the team to analyze and visualize imperial geographical perspectives beyond the British knowledge-production practices that Lorimer’s voluminous Gazetteer represents.
During our time at OpenGulf, we used our various language skills to help create multilingual data about the Gulf region. Khosiyat and Enkhjin used their Russian skills to locate geographically rich historical texts in Russian that could provide information about the impact of the Russian Empire and Soviet Union on the Gulf. We
Safarnameh (“Travel Log”) by Sadid Al-Saltaneh. After digitizing the text of this Persian work, the team will annotate the place names using Recogito and compare how the Qajar administration’s representation of the Persian Coast compares to the British representation of the Persian Coast in Lorimer’s Gazetteer.
cesta.stanford.edu | 94
Student Researchers Khosiyat Oripova (right) and Enkhjin Munkhbayar (left)
sought guidance from Stanford’s Curator for Slavic Collections, Margarita Nafpaktitis, and developed a spreadsheet with place names, bibliography, and sources from the Green Library and Hoover Archive.


In search of Persian sources, Atash sought guidance from Stanford’s curator for Middle East collections, Dr. Kioumars Ghereghlou, who recommended two travel logs—Safarnameh—written by Qajar official Sadid Al-Saltaneh during the late 19th century. Commissioned by the central government in Tehran, Al-Saltaneh’s texts dedicate chapters to travels along the Gulf coast by ship, including stops in Bahrain. The next step will be to choose one of Al-Saltaneh’s texts and decide on the best method for digitizing these printed Persian texts in order to annotate the place names using Recogito. This annotation process will produce a database of place names that will enable us to visually analyze Qajar administrative representations of the Persian Coast region and compare them with those contained in Lorimer’s Gazetteer.
Meanwhile, Defne reviewed and corrected existing annotations of an Ottoman Turkish text focused on southern Iraq, the Seyahatname-i Hudud, which was produced by Ottoman administrators in the mid19th century during the process of negotiating the border between Ottoman Iraq and Qajar Iran. Defne corrected the annotations on a modern Turkish-alphabet edited edition of the original Ottoman Turkish text (in Arabic script) in Recogito.
We also began planning how to combine the 1000-row dataset resulting from this annotation process with the place-name data on Iraq extracted from Lorimer’s Gazetteer. One challenge will be the different spellings of transliterated place names. Developing a workflow for comparing and simultaneously disambiguating the Seyahatname data and the Gazetteer Iraq data will provide a blueprint for future datasets generated from Arabic, Persian and Russian texts.
Scan the QR code to visit the OpenGulf website, where you can learn about the various strands of this evolving project and see several examples of maps created using data from Lorimer’s Gazetteer.
Student Researchers Defne Genç (left) and Atash Heil (right)95 | Center For Spatial and Textual Analysis
Handwritten Text Recognition for Arabic
by Mohammed KhalilWhile geographically-rich texts like Lorimer’s Gazetteer, the Seyahatname, the Safarnameh, and many of the Russian sources exist in printed editions, I have focused on increasing access to handwritten materials written by historical inhabitants of the Gulf, particularly in Arabic.
An example of a manually transcribed page which was added to the project’s multilingual and multicultural dataset on the history of the Gulf Region.
Since early 2020, I have been working with OpenGulf to develop a Handwritten Text Recognition (HTR) model using the software Transkribus to automatically transcribe handwritten Arabic texts. This model will eventually be applied to non-digitized archives of texts produced in the Gulf to create a more comprehensive library, representative of the many linguistic and textual practices in the region’s modern history.
So far, I have manually transcribed handwritten letters exchanged by Kuwaiti and Omani political elites and British representatives in the late 19th and early 20th centuries which the Qatar Digital Library has made available. Using these manual transcriptions, I have produced a Transkribus model with a test error rate below 20% despite being at a relatively early stage of its development.
Ultimately, the goal of our HTR project is the publication of digitized, annotated texts on open-source platforms. Our most recent publication prototype, shown below, would include the source
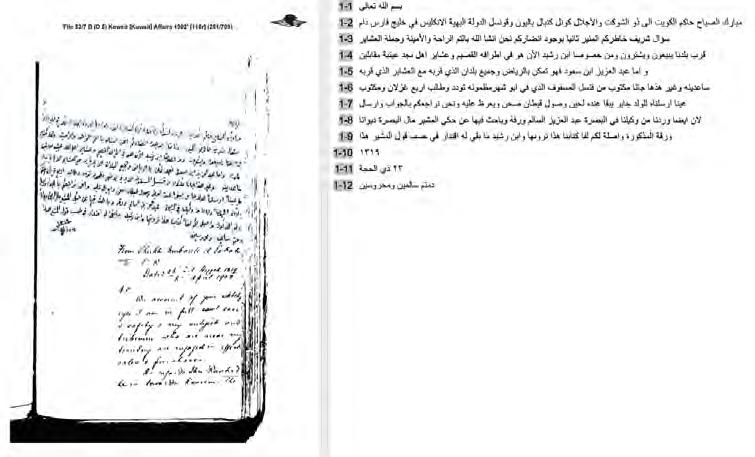
cesta.stanford.edu | 96
image alongside the digitized text, as well as several potentially useful formats including a CSV file containing place name data and an XML file containing relevant annotated tags. For individuals who are interested in simply reading through the digitized text, our publication would also include the text presented in HTML format with the place names presented as hyperlinks to the relevant GeoNames link. In the future, our aim is to also include comprehensive CSV files for every text which would include an aggregate of all the data found within all its pages.
Through this project, we hope to change the narrative surrounding the Gulf by bringing the voices of its historical residents back to the forefront of academic discourse.
A prototype of one output of OpenGulf’s work on handwritten text recognition for Arabic sources: the digital publication of texts along with their associated data.
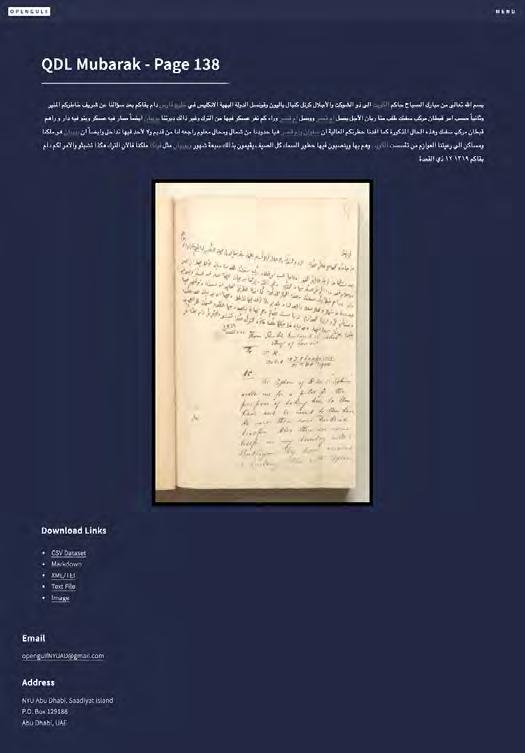
97 | Center For Spatial and Textual Analysis
Student Researcher Mohammed Khalil
Sustaining the Human Record
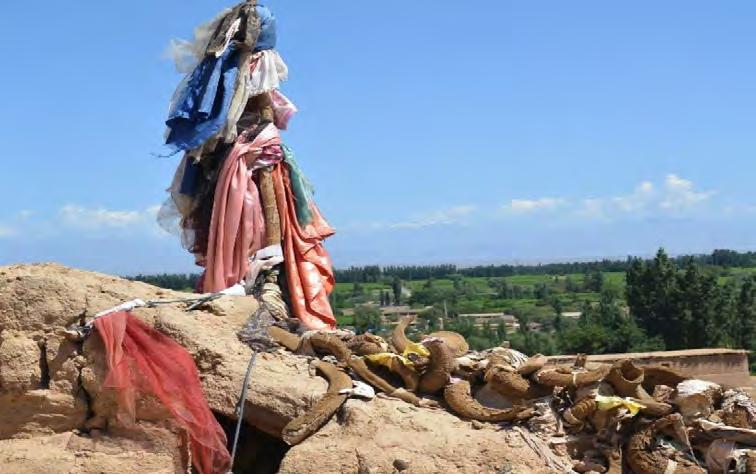
Project Description
Elaine Treharne, Professor of English, and Kathryn Starkey, Professor of German Studies
During the summer of 2022, student researchers assisted Professors Kathryn Starkey and Elaine Treharne in the compilation of data, bibliographical information, and digital resources for two new flagships courses on “Sustaining the Human Record,” which contribute to the Doerr School of Sustainability’s offerings in the coming academic years. These materials highlight the complex ways in which information is transmitted through time; the different media and writing systems that preserve the history of human effort and accomplishment; and how information is collected and archived, conserved, cataloged, and made discoverable. Our work centers on the crucial questions of what gets preserved? Whose voices are heard in the formal and informal record? And how will information/ data be transmitted and made intelligible into the future?
cesta.stanford.edu | 98
A photograph of an Uyghur Shrine for a saint, known as a Tugh-’ alam, decorated with clothes and horns. Image courtesy of Rahilä Dawut.
Connecting Sustainability and the Humanities in the Classroom
by Eren YurekThis summer I had the privilege of contributing to course design and resource creation for two classes on sustainability and the humanities which will be taught in the Doerr School of Sustainability in 2022/23.
I started by reflecting on the kinds of relationships that sustainability can have with the humanities. I realized that a key strength of humanities research is that it is able to show how seemingly singular phenomena, such as the hula dance in Hawai’i, or the use of the Hebrew language in 19th-century Europe, are materially rooted, embedded, and consequential. We need to be able to adapt this way of thinking for ecological sustainability too.
Alongside my colleague Jessica Camille Jordan (a PhD candidate in the English Department), I surveyed courses offered by schools around the world to find syllabi related to sustainability and the humanities. We also looked at how archival studies deal with questions of sustainability, how preservation and sustaining the human record are related, and we researched Indigenous ways of sustaining which have been largely forgotten. We not only focused on sustaining cultural artifacts, but on the practices and processes of sustainability implicated within them.
99 | Center For Spatial and Textual Analysis
Hula kahiko performance in Hawai’i Volcanoes National Park. Image by Ron Ardis. Licensed under CC BY-SA 2.0.
We then collected information about approximately seventy objects to be used as examples and case studies for the new classes at Stanford. These objects ranged from language revitalization projects to digital sustainability efforts, from oral literatures to shipwrecks that cannot be moved from below the sea, spanning monuments, museums, and Indigenous practices of sustainability.
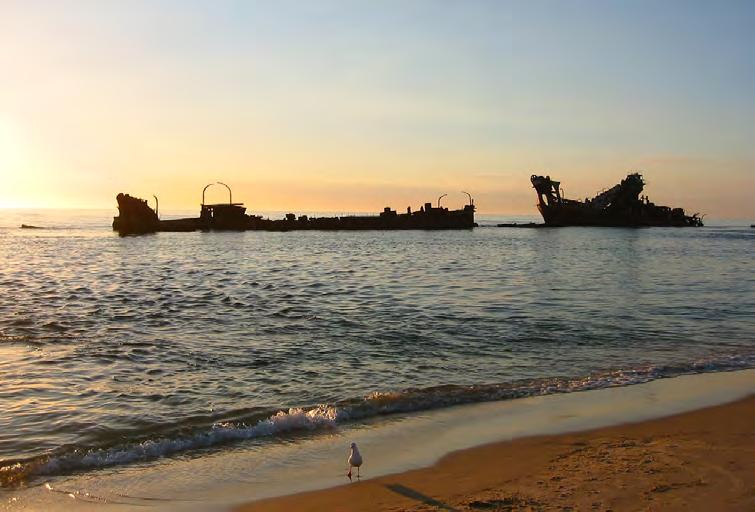
We also created an annotated bibliography of forty articles related to the objects themselves, methods of preserving them, and concepts that span both fields. I visited the Cantor Arts Museum on campus to analyze how themes are structured across rooms, how space, color, and light are used, and how objects are presented. This was useful because the Cantor is a space containing numerous kinds of history, meaning that it offers multiple examples of approaches to cultural preservation and sustainability.
The classes I contributed to will be offered this academic year: an introductory seminar for freshmen entitled “Ecologies of Communication” (Winter Quarter 2023), and an advanced undergraduate/graduate seminar called “Sustaining the Human Record” (Spring Quarter 2023). I encourage anyone interested in these topics to take these classes!
cesta.stanford.edu | 100
Student Researcher Eren Yurek
Shipwrecks off the western coast of Moreton Island, Australia. Image: “Moreton Island” by [mapu]. Licensed under CC BY 2.0.
Digital Legal Histories Project
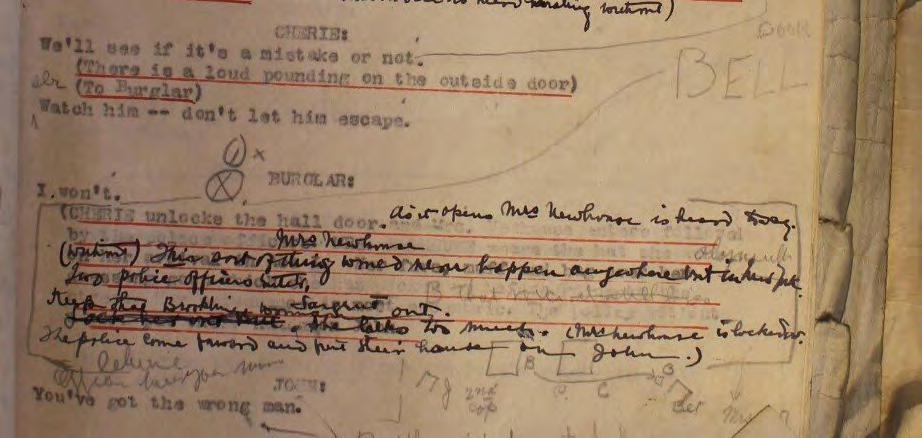
Project Description
Amalia Kessler, Professor of International Legal Studies, and Brent Salter, Fellow at the Stanford Center for Law and History (2019-22)
This project from the Stanford Center for Law and History is the first stage of a broad and innovative legal and labor history of the American performing arts. Our immediate focus is the recovery, preservation, and online presentation of a vitally important archival collection recently recovered by the Dramatists Guild of America, the trade association of playwrights, librettists, composers, and lyricists. The Dramatists Guild collection, which extends over a century, reveals an expansive history of dramatic authorship in the United States. A key goal of our project is the visual online mapping of legal, artistic, social, and economic networks over time, in order to foster a deeper understanding of diversity, inclusion, and access to the industry over the past one hundred years. The legal histories of remarkable women and artists of color engaged in dramatic authorship go largely untold, as do the legal histories of ordinary authors without dominant and enduring reputations. The project will aim to provide tools to show how underrepresented artists negotiated with stakeholders over time and how these negotiations framed their experiences as artists.
101 | Center For Spatial and Textual Analysis
Changes to a script by Lawrence Rising, “Apartment 12 K”. The archival collection studied by this project includes a corresponding contract between Lawrence Rising and Shubert Theatrical, June 1914.
The Evolution of Guild Agreements
byI worked to create digital versions of 20th-century Dramatists Guild agreements and perform a textual analysis of their contents. The first stage was creating digital transcriptions of the text. I focused on a set of nine guild agreements spanning the years 1915 to 1985.
In order to use automatic transcription tools such as optical character recognition (OCR), the pages of the agreements needed to be in a consistent format. The work I did to clean these pages included cropping out extra background, adding consistent page numbers, and renaming the files, all while maintaining records of the original page numbers and formatting.
Next, I used Google’s OCR tool to digitize these pages. This tool takes a PDF and outputs a Google Doc with transcribed text. Because some pages had low image quality, there were sections that I had to transcribe manually. After the initial OCR, I went back and read through all the pages to correct mistakes. For example, typos frequently occurred at the ends or beginnings of lines.
In a second phase, I used various Python packages to perform textual comparisons and create heatmap visualizations. I carried out these
cesta.stanford.edu | 102
A scan of a Dramatists Guild agreement from 1936. This document has been cleaned and is now ready to be converted into digital text using OCR software.
Hong Le Xuan Vo
types of analysis for the five earliest agreements. Each square on the heatmap below represents the similarity between two clauses. The darker the square, the more similar two clauses are to each other.
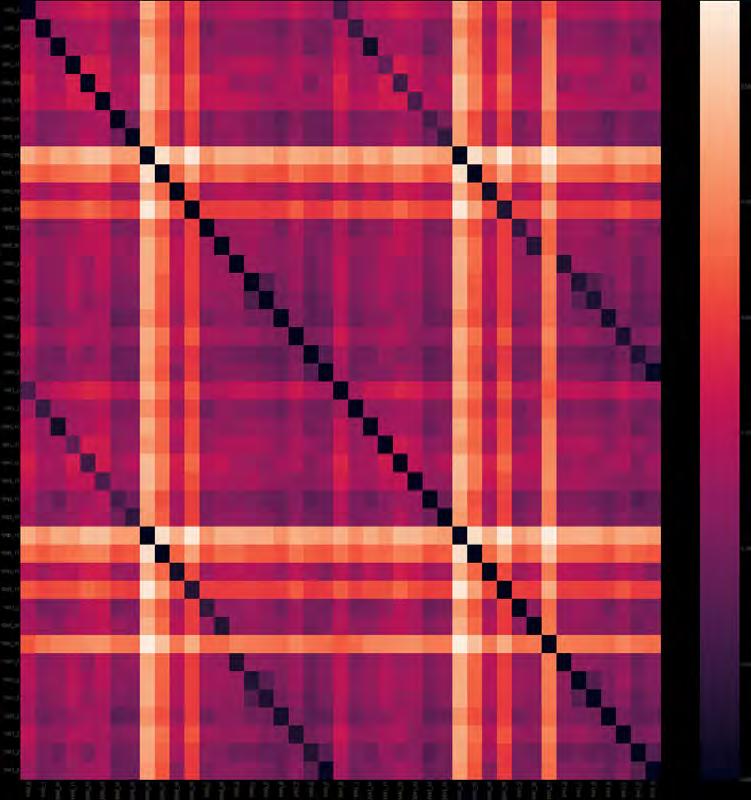
I used the heatmap visualizations as the basis for creating a list of the clauses that were most similar and most dissimilar. One notable similarity was between the Guild agreements from 1936 and 1941. The high density of dark squares on this heatmap highlights the strong correlation between these two agreements. Indeed, the documents contain much of the same text.
A heatmap of textual similarity between Dramatists Guild agreements from 1936 and 1941. Each square represents the similarity between two clauses, calculated with Euclidean distance. The darker the square, the more similar the two clauses.
 Student Researcher Hong Le Xuan Vo
103 | Center For Spatial and Textual Analysis
Mapping the Aegean
A detail from Buondelmonti’s hand-drawn map of Corfu (Athens, Gennadios, MS 71). His annotated maps of the Greek islands, which highlighted sites of historical significance, were the first of their kind and contributed to the emergence of Greek archaeology as a discipline.
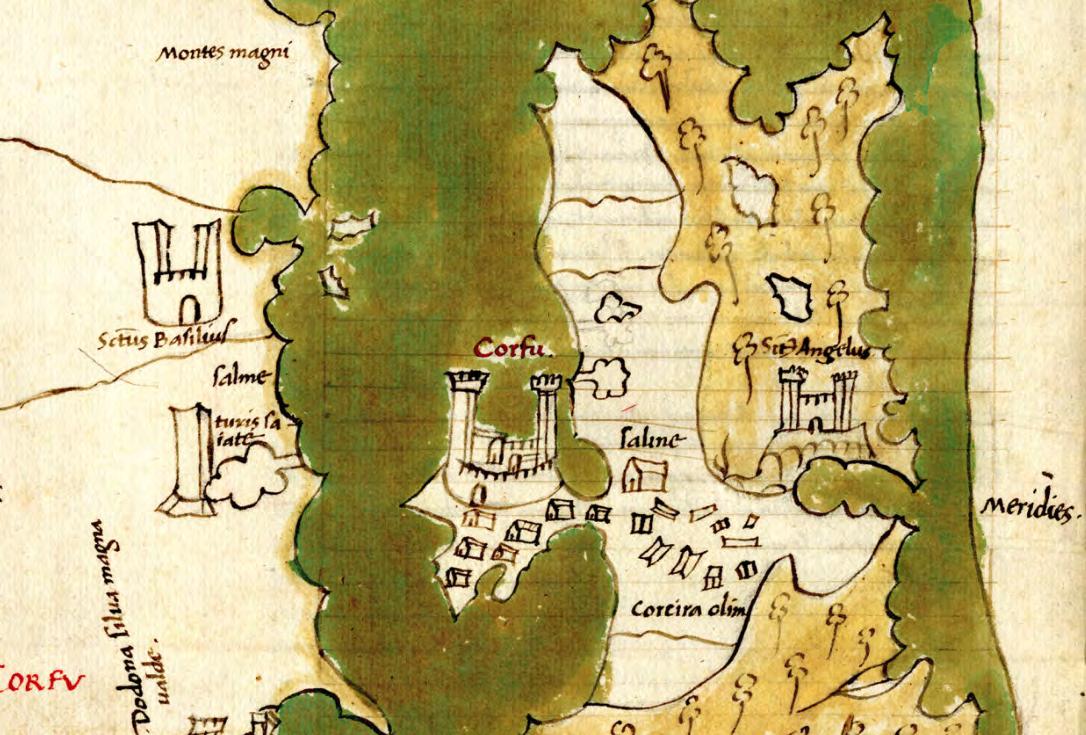
Project Description
The Liber Insularum Archipelagi (1420) by the Florentine traveler Cristoforo Buondelmonti is considered to be the first guide to the Greek islands. Each island is described with a paragraph of text and illustrated with a color map in a format which gave rise to a new genre, the isolaria (“island books”), which would subsequently enjoy great popularity in Renaissance Europe. The Liber Insularum Archipelagi was an influential text whose important role in the development of Greek archaeology has long been overlooked by scholars. This project is working to build an innovative digital edition of Buondelmonti’s book, accompanied by a new commentary, to draw attention to its groundbreaking role in the exploration of Greece and in the birth of archaeology as a discipline.
cesta.stanford.edu | 104
Benedetta Bessi, Marie SklodowskaCurie Postdoctoral Fellow, Venice Center for Digital and Public Humanities (VeDPH) and CESTA
Georeferencing a
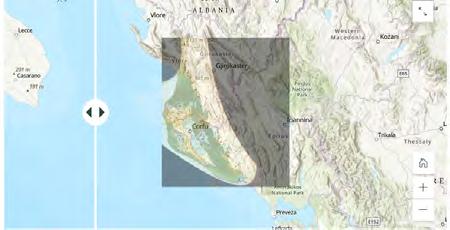
15th-Century Guide
the Greek Islands by Jennifer Luo
to
In the Liber Insularum Archipelagi, each of the Greek islands is presented to the reader with a labeled map and a descriptive text. As a proof-of-concept for the future digital edition, I used QGIS, an open-source georeferencing application, to georeference Buondelmonti’s original illustrated map of Corfu to a modern satellite map of the island.
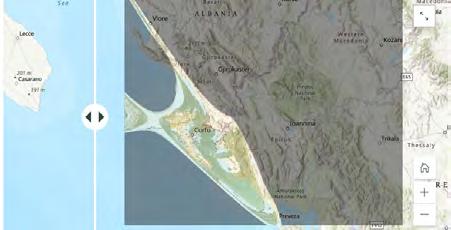
Georeferencing is the process of taking a digital image (Buondelmonti’s illustrated map) and adding geographic information (modern-day coordinates of ancient ruins and settlements) so that QGIS can ‘place’ the image in its appropriate real-world location. I used Wikidata, Pleiades, Geonames, and Topostext to locate coordinates of prominent sites in Buondelmonti’s illustrations. I then created a database of coordinates, descriptions, and links to Buondelmonti’s labeled sites.
These two screenshots show the results of georeferencing Buondelmonti’s map of Corfu using a polynomial two transformation (left) and a polynomial three transformation (below left) in QGIS. Both of these attempts at georeferencing were ultimately rejected because of the high degree of distortion to the original map.
My first attempts at georeferencing utilized high-degree polynomial transformations, which resulted in a highly-distorted map that was not useful for the purposes of the project (see the examples above).
Buondelmonti’s original map of Corfu labels various ancient ruins and settlements and pays considerable attention to the shape of Corfu’s coast. However, his map of Corfu is not to scale and presents a distorted orientation typical of the ancient and premodern cartographic tradition which tended to re-interpret the natural NW-SE alignment of Corfu and the Ionian islands in a straighter
105 | Center For Spatial and Textual Analysis
E-W direction. While the polynomial two and polynomial three transformations were based on more than 100 georeferenced points and aimed to offer a maximally accurate juxtaposition of Buondelmonti’s Corfu map with the corresponding satellite map, they ended up heavily stretching and distorting the historical map, making it difficult to recognize and hence of little use for the scope of the project.
I therefore decided to opt for a polynomial one transformation so that readers could get a general sense of the accuracy of Buondelmonti’s map of Corfu overlaid atop a modern-day satellite map of Corfu without heavy-handed distortion (see below). As an alternative way of pinpointing the specific place names present on the historical map, I used Photoshop to remove each of Buondelmonti’s original labels, georeferenced each label as a separate layer to its corresponding modern-day location, and uploaded them as a mosaic tile layer using image layers in QGIS.
Finally, I uploaded the database information to QGIS, including the descriptions of Buondelmonti’s labeled sites and links to their locations in Pleiades, Geonames, and Topostext. The final map allows users to view the ancient settlements and ruins present in Buondelmonti’s map of Corfu mapped in correspondence to their exact georeferenced location.
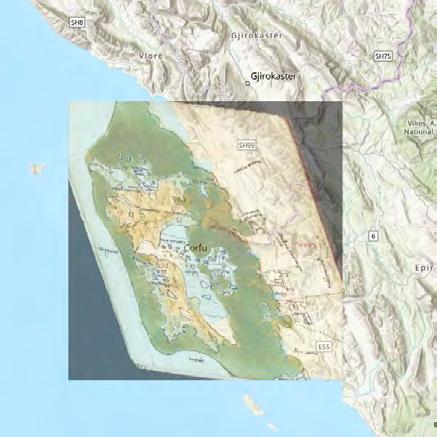
Scan the QR code to visit the project website, where you can interact with all the maps described here.
The final map of Corfu, georeferenced using a polynomial one transformation in QGIS.
cesta.stanford.edu | 106
Student Researcher Jennifer Luo
Digital Humanities Graduate Fellowship
In the ten years since its foundation, CESTA’s Digital Humanities Graduate Fellowship program has supported the research of 74 graduate students and postdoctoral fellows from 22 different programs and centers. This visualization, made in Palladio, a Stanford-developed software, shows the destinations of alumni from the program. Former fellows have go on to careers in academia and beyond.
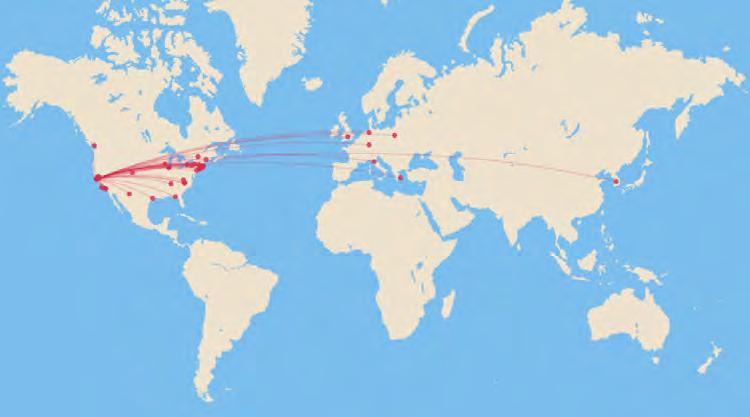
2022 saw the tenth iteration of CESTA’s Digital Humanities Graduate Fellowship (DHGF), a program designed to prepare graduate students and postdoctoral scholars in the humanities and humanistic social sciences for a future where digital methods are the norm. Over two quarters of meetings and workshops, fellows develop their skills, learn from one another, and prepare a piece of publishable scholarship using digital approaches. Many opt to receive the support of an undergraduate intern, whom they, in turn, mentor in research skills. This year’s cohort was perhaps our most diverse to date in terms of disciplinary affiliation, with ten fellows representing six departments and two centers. As the program’s directors (and researchers ourselves), supporting such a vibrant crop of projects was profoundly exciting, but perhaps equally special was seeing how the fellows became a community of their own, forming friendships that they can continue to draw on as they navigate the evolving landscape of digital humanities research. The following projects are a selection of those supported this year.
Eric Harvey and Mae Velloso-Lyons, Program Directors (2021-22)107 | Center For Spatial and Textual Analysis
Program Description
The Evolving Psalter
by Eric Harvey (ACLS Emerging Voices Fellow, CESTA)Prior to the invention of the printing press, each biblical manuscript varied from all others in ways both large and small. In the case of the book of Psalms, small changes had large consequences, as adding or omitting divisions between individual psalms created entirely new compositions. Recent work has begun to show that this type of variation was much more prevalent among medieval Hebrew manuscripts of the Psalms than previously recognized, and this project seeks to make a quantitative assessment of the available data and draw out their implications.
The first phase of the project compiled and assessed variation in a corpus of nearly 400 manuscripts. The analysis showed a stunning variety of different segmentations of the Psalms—that is, different ways the overall text of the book could be divided into constituent compositions. As such, it also revealed new psalms within the text of the familiar Psalter. In light of these findings, I proposed a new way of conceptualizing the Psalms based on population-level thinking developed in evolutionary biology—not as a single, fixed text but as a collective phenomenon whose full potential for diversity cannot be expressed in any one exemplar.
In the second phase, my research intern Chana Lanter and I expanded the dataset to correlate manuscript variation with information about the date, location, and scribe of each manuscript (where such data was available). We hope to provide deeper explanations for why and where variation occurred and where it did not. In general, the project suggests that the Psalms, far from being a closed corpus of fixed and stable compositions, are in reality formed and reformed in coordination with the communities who receive, read, and pass them on.
MS Parm 1871, a 13th-c. Italian Psalter held in the Biblioteca Palatina in Parma, Italy. Leaf 174 shows text from Psalms 113–115 surrounded by David Kimchi’s commentary. Image source: Biblioteca Palatina, Ministero per I Beni e le Attività Culturali, Italy.
cesta.stanford.edu | 108
Capturing Formal Innovation in Medieval
Fiction by Mae Velloso-Lyons (ComparativeLiterature)
In the first half of the 13th century, several long works of prose fiction were composed in French and gained immediate and widespread popularity, receiving translations and adaptations into a dozen other European languages. These texts were the first novel-like works in Western history since the fall of the Roman Empire and they inaugurated a new age for fiction, with new ways of reading, writing and sharing literature, which have influenced the ways we think about fiction today. Yet these innovative works have received surprisingly little scholarly attention outside of the field of medieval French literature. This project endeavors to build and analyze a digital corpus of medieval prose fiction, using computational methods to identify and quantify formal patterns which would otherwise be difficult to reliably observe and describe.
Building on my earlier research into the Lancelot-Grail Cycle (LGC), one of the best known of these prose fictions, I aimed to create a proof-ofconcept by using quantitative methods to test the extent to which the innovative ‘embodiment’ of character in the LGC (in particular, the way interiority is expressed through bodily language) is equally present in contemporaneous texts. While my analysis is currently focused on French prose fiction, the goal is to subsequently conduct an analysis across texts in multiple languages, and to make comparisons with fictions in verse.
To build my digital corpus, I used optical character recognition (OCR) software to extract text data from scans of older printed editions of selected works, many of which used non-standard fonts and layouts. My research assistant, Hayn Kim, assisted me with data cleaning by writing custom Python scripts. I now intend to proceed with seeded topic models and the development of a word vector model to assess the consistency of embodied character across my corpus.
This stacked bar chart shows occurrences of selected body words (heart, eye, tongue, face, etc.) in four parts of Lancelot, an early 13th-century work most likely composed by several different authors. Parts I and II, which were most widely transmitted and seem to have been most popular, have more frequent references to the heart (“cuer”), which often forms part of a contrasting pair with “cors” (body”), as a way to distinguish between the interior and exterior of a character (their heart vs. their body). Further research will investigate whether this embodied model of character is shared by other popular texts of the time.
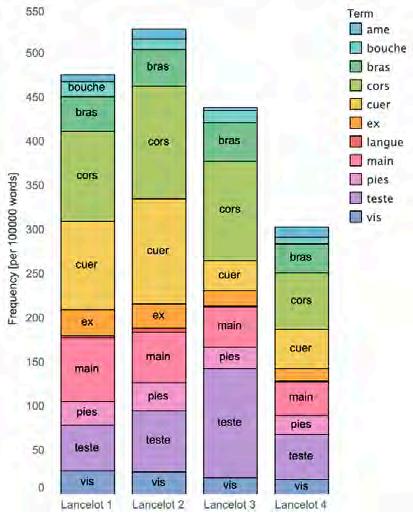
109 | Center For Spatial and Textual Analysis
Style and Language Amid the Fragments of Early Latin Literature by
Brandon Bark (Classics)
A screenshot of the index of Jackie Elliott’s Ennius and the Architecture of the Annales (Cambridge 2013), which we used as the starting point for our spreadsheet.
A screenshot of the spreadsheet of Ennian verses, the later sources who cited them, and the nature of the citation.
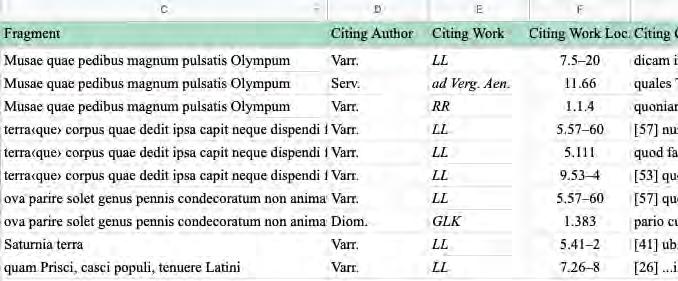
Much of ancient Greek and Latin literature survives piecemeal—in small soundbites that later authors who had some access to the original work quoted in their own writings. For example, one of the initial verses of an epic poem called the Annales by the 2nd-century Latin poet Quintus Ennius (c.239–169 BCE)—“Musae quae pedibus magnum pulsatis Olympum” (“Muses, you who beat great Olympus with your feet”)—comes to us thanks to Marcus Terentius Varro (116–27 BCE), who quotes the verse in a section of his treatise On the Latin Language (7.20) where he is discussing toponyms: “Olympus”, he argues, “is the name which the Greeks give to the sky, and which everyone calls a mountain in Macedonia…”. Our project aimed to digitally track and classify how, where, when, and why Ennius’ poetry had been transmitted over the centuries, in a way that would improve upon existing means of capturing these relationships.
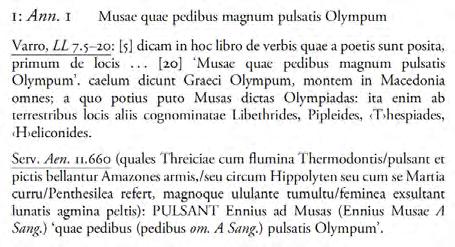
My research intern, Antony Bui, and I created a spreadsheet that first noted the Ennian verse and the later source who cited it. We then tried to capture the principal interest of the citing source: lexicological, antiquarian, scientific, literary, etc. We then asked what was the “trigger” that motivated the citation—what was it about the Ennian verse that caused a later source to quote it? Finally, we converted this verbal description of the trigger into a repeatable formula: did the quoted line “illustrate”, “corroborate”, or “augment” a point the quoting source intended to make; or did it “pose” a question he wanted to ask; or did it offer a “contrast” to his own view?
In future, we hope to extend this analysis to many other ancient literary corpora, to better understand and document the relationships between ancient intellectuals over the centuries.
cesta.stanford.edu | 110
Foundations for the Alpheios Research Lab
by Annie K. Lamar (Classics)Working with The Alpheios Project, Ltd., a non-profit organization that develops digital tools for reading ancient languages, I am researching how undergraduates use technology in their first-year ancient language courses. Developed by the Alpheios project, the Alpheios reading tool (from here on, “Alpheios”) is a Chrome extension that allows students to doubleclick on any word in ancient Greek, classical Latin, or ancient Persian on any web page and receive a full analysis and definition, alongside other information. The tool also keeps track of the words a user clicks on and allows this list to be exported, along with definitions, directly to flashcards.
The goal of this research project is to determine to what extent Alpheios is an effective tool for undergraduate learners in first-year ancient language classrooms. A tool like Alpheios, which provides immediate information about the salient features of a word, can be an invaluable resource for students. This ease-of-access may also, however, enable a student to rely on the tool as a crutch rather than a scaffold. I ask students to complete a reading task in ancient Greek or Latin using a traditional paper dictionary, and one week later to complete a similar task using Alpheios. Students then take a short quiz that measures their reading comprehension and vocabulary retention. This experiment is scheduled to begin this fall after a rigorous year of background research and experiment approval.
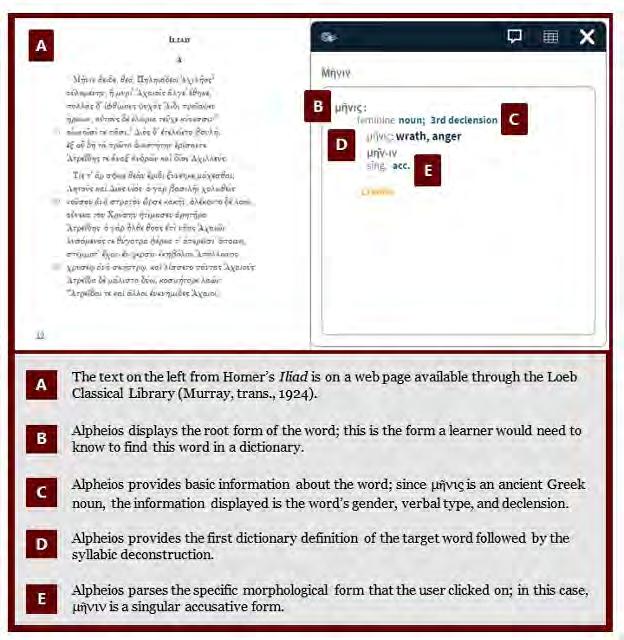
111 | Center For Spatial and Textual Analysis
A labeled screenshot showing the core functionality of the Alpheios tool.
Return to Realism? Comparing 19th- and 21stCentury Novel Forms
by Zuza Leniarska (Fulbright Visiting Scholar, English)A biplot of the topic model for 21st-century neorealist novels, divided into two categories: prizewinners (blue) and neorealist family sagas (orange). The topics overlap, but are distinct enough to suggest the thematic coherence of neorealist novels. There is also a significant difference in the vocabularies used by neorealist male authors (downward arrows) and female authors (upward arrows), reflected in the elliptical shape of the neorealist (orange) region of the biplot.
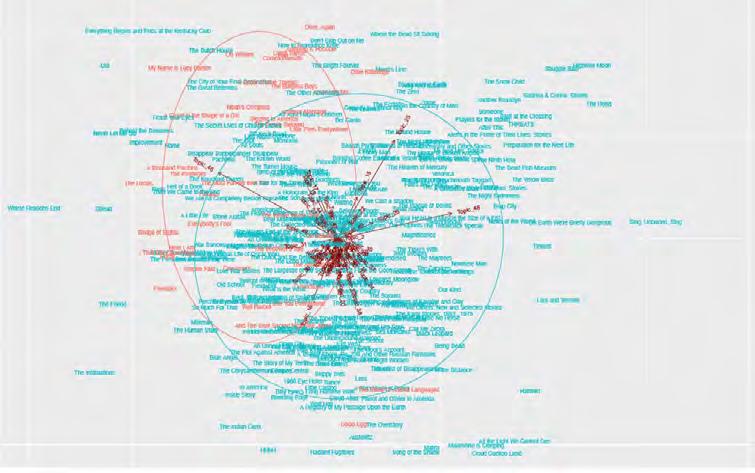
My research compares the sociopolitical circumstances that accompanied the rise of the realist novel in the 19th century with the 21st-century neoliberalism that has coincided with a return to realist narratological strategies and themes in American fiction. I use digital tools for distant reading to identify similarities and differences between 19th-century realism and 21st-century neorealism with the aim of answering questions about the connections between different forms of capitalism and realism. I use topic modeling to detect whether the subject matter of canonical 19th-century realist fiction is similar to contemporary neorealist fiction, with a special focus on gender and family roles and their vocabularies.
In order to do this, I first considered different definitions of the 19th-century realist canon and created different corpora to compare them thematically, reflecting on the image of 19th-century literature in the 21st century. I also compared various groups of 21st-century US novels—award-winners, selfidentified family sagas, and bestsellers—to investigate what vocabularies they used to describe family life and how they portrayed gender roles within middle-class everyday life. I finally analyzed the connections between descriptions of economic and family life in both time periods to reflect on the changes that occurred within realism and its ambition to portray the middle class.
cesta.stanford.edu | 112
Imperial Vocabulary: Public Political Discourse of Trans-Pacific Japan, 1868-1912
by Andrew Nelson (East Asian Languages and Cultures)In this project, I developed a model for querying word frequencies in the Hoji Shimbun Japanese Diaspora newspaper collection in order to trace occurrences of politically-related terms over the period from 1895 to 1935. The project leverages a corpus of over 623 million words extracted from over 400,000 pages of text from 10 newspapers published in San Francisco, Beijing/Dalian, Honolulu, and São Paulo.
Evaluating the accuracy of existing optical character recognition (OCR) methods was a major component of the project, and an area where I benefited from the support of my interns, Victor Cheruiyot and Sandi Khine. Since political terms are written in kanji, we were particularly interested in kanji OCR accuracy. Hand-grading a sample of approximately 25,000 OCR output characters revealed a kanji accuracy rate of approximately 80% for the best-performing OCR method. I improved baseline accuracy by removing alphanumeric characters and Western punctuation, which were almost entirely absent from the original newspaper texts, and by removing all kana characters that had become isolated when erroneous characters fragmented real words during tokenization.
Querying political terms confirmed well-known historical narratives, and invited the investigation of new questions. For example, the frequency of “modern” (現代) increases through the 1920s in both the Manshū Nichinichi and the Burajiru Nippō, which were both aligned with the Japanese metropolitan government. Frequencies of “modern” in the San Francisco and Hawai’ian newspapers parallel each other but find no parallel in the Chinese and Brazilian papers, suggesting that discourses of modernity followed their own contours in American Japanese communities.
This image shows two lines of parsed text. The upper line in each pair, shown with blue parsing lines, is the actual newspaper text reproduced manually. The lower line, shown with pink parsing lines, is the corresponding OCR output. Word count differences following punctuation and stopword removal can serve as proxies for OCR accuracy.
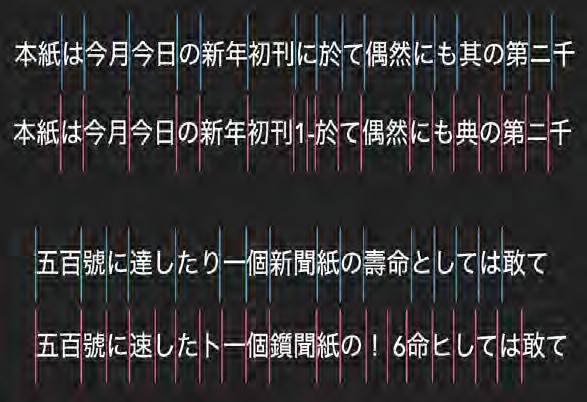
113 | Center For Spatial and Textual Analysis
Raiding the Wordhoard: Recurring Alliterative Collocations in Old Norse Eddic Poetry
by James Parkhouse (Visiting Scholar, Text Technologies)My project examined recurring alliterative collocations in Old Norse eddic poetry, a corpus of around 12,000 verses of mostly anonymous mythological and legendary poetry composed in medieval Scandinavia and associated colonies. Old Norse poetic meter was predicated on a pattern of alliterating stressed syllables per line, rather than on a fixed number of syllables. This gave rise to the repeated combination of alliterating words; as illustrated by examples in modern English such as ‘hearth and home’ or ‘life and limb’, such expressions can have rhetorical resonances beyond their semantic significance; the study of collocations in Old Norse poetry can thus offer valuable insights into the aesthetics of the texts and the worldviews of their composers and audience. However, since there are finite numbers of words beginning with any given letter, some combinations could recur by coincidence.
With the assistance of my intern, Poojit Hegde, I employed statistical testing to identify which alliterative combinations recurred more often in the corpus than would be expected by chance, indicating that these were deliberate poetic devices. (Due to time constraints, I conducted a proof-ofconcept on one important manuscript, comprising about half of the total corpus). I used Fisher’s exact test, which evaluates the independence of two variables given their observed distribution. I first compiled a spreadsheet of the alliterating stresses in each verse of the corpus. I cleaned this raw data of corrupt verses (those with defective meter or indecipherable meaning as a result of centuries of manuscript transmission), and lemmatized inflected forms to the root form. I then used Python to generate contingency tables for each collocation with a frequency of two or more, and to perform mass statistical testing.
A conservative correction to avoid false positive results gives a significance threshold of p = 0.00006; 77 collocations met this threshold, providing a springboard for literary-critical analyses of the poetic functions of these combinations. Additionally, I have begun experimenting with visualizations of wider collocational networks using the open-source graphic software Gephi, treating each collocate as the focal node of an ego network.
An example of work in progress visualizing collocational networks for the initial letter g-.
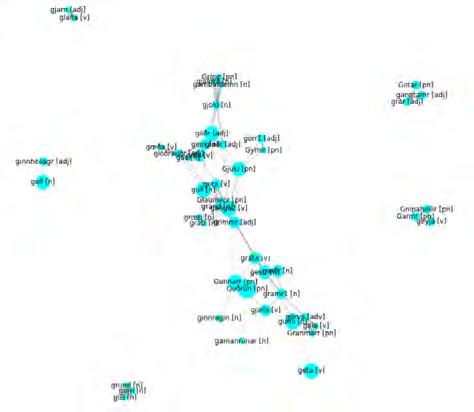
cesta.stanford.edu | 114
Fear in the Archive: Ethnographic Concepts in Immigration Judges’ Decisions
by Valentina Ramia (Anthropology)Ever since the United Nations established that a refugee is a person with a “well-founded fear of past and future persecution,” countries that are signatories to the UN Convention Relating to the Status of Refugees have developed legal instruments to identify, evaluate, and assess immigrants’ fear. My dissertation research is about how fear is interpreted in asylum law in the United States. Drawing on my experience as a policy analyst and anthropologist, I employ a combination of methods to ask questions related to the judicialization of fear (how it became a legal object), the medicalization of fear (how decision-makers differentiate legal fear from pathological fear), and the narration of fear (how it is put into a testimony format).
For this project, we focused on the medicalization of fear. Based on input from immigration lawyers and psychiatrists that I interviewed as part of my fieldwork, as well as language used by immigration judges and other authorities in legal decisions, we created a list of words that are frequently found in discussions about ‘pathological fear’ in asylum cases (e.g., phobia, paranoia, hallucinations, irrational, reasonable, etc.). Then, using a corpus of approximately 800 decisions issued by the Board of Immigration Appeals since 1998, we traced the lineage of cases cited in discussions about asylum seekers’ fear and mental competency.
We observed, for instance, how often the ethnographic terms from the word list occurred in these specific cases. We then incorporated these findings into in-depth interviews with the immigration attorneys and psychiatrists collaborating on this research. In future, we aim to expand the corpus to include immigration judges’ decisions and ask more specific questions related to temporal and geographic metadata. Special thanks to Claudia Engel and CESTA for their guidance and support, and to my research intern Miranda Liu.
This heatmap shows the frequency of co-occurrences of selected terms related to fear and health in decisions by the US Board of Immigration Appeals.
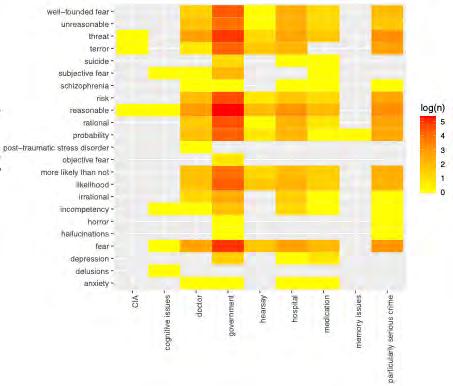
115 | Center For Spatial and Textual Analysis
A Different Kind of Chinese Empire: The City Networks of Chu (c. 350 – c. 100 BCE)
by Dewei Shen (Center for East Asian Studies)My overall research focus is on explaining the first wave of imperiogenesis in China from the mid-4th through the 2nd century BCE. For this digital humanities project, I explored the extended Chu city networks to understand how the Chu Empire operated on the ground. My dataset is the growing body of new archaeological data from South Central China, the consensual core territory of “Chu proper.” Empirically, this DH project consists of two parts.
Part one concentrates its attention on Jiangling, the capital region of Chu in modern Hubei, which was first conquered by Qin in 278 BCE and then by Han in 202 BCE. I collected data on 907 tombs (properly periodized) from 52 cemetery sites dispersed around the Chu capital and the Qin/ Han administrative headquarters in Jiangling. Fuzzy cluster analysis in R of 5411 artifacts and artifact fragments from these tombs suggests that, following the Qin and Han conquests, this Chu capital region transformed from a highly stratified society, organized around the Chu king, to one that was governed directly by local bureaucrats working for Qin/Han.
Part two collects data on 149 city sites in South Central China that were most likely under Chu control between the 4th and 3rd century BCE. Hotspot analysis in ArcGIS of these cities’ spatial distribution suggests that, surprisingly, the hotspot with 99% confidence is not located around the Chu capital region in Jiangling but far away in the Central Plains in North China. The Jiangling Chu capital was, instead, located in a place not significant for the hotspot analysis. This counterintuitive result, which was first discovered by this project, reminds us that much still needs to be learned about Chu political and economic organization. These results have the potential to contribute to our understanding of imperial models which were different from the more familiar Qin and Han models.
A hotspot analysis of the spatial distribution of 149 city sites likely to have been under Chu control between the 4th and 3rd century BCE. A striking result is that the capital city (marked with a star) is located far from the hotspot (in red), indicating that we still have much to learn about Chu imperial organization.
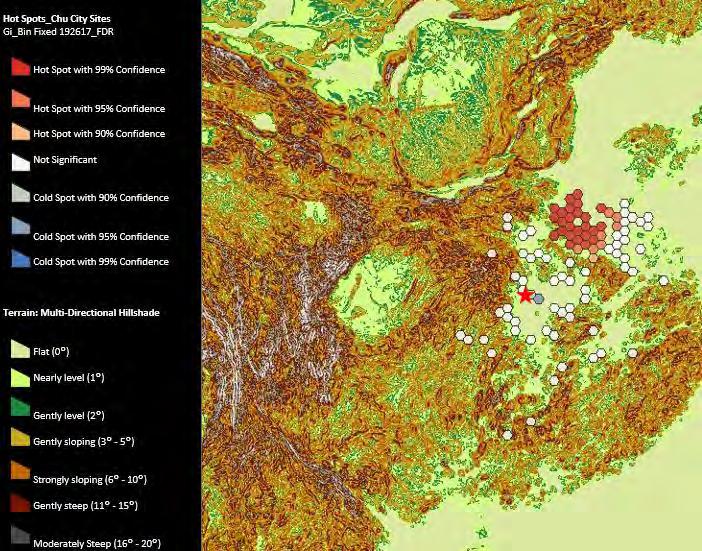
cesta.stanford.edu | 116
Subverting Imperial Narratives
by Lydia Wei, intern on Dewei Shen’s projectThe project work for my internship consisted of two main strands. First, I supported Dewei’s research on Chu city networks by using R to create visualizations from data about the locations of burial sites. Second, I worked with Dewei on a creative side project called “The Multiverse of Chinese Civilization.” Together, we aimed to subvert some of the common narratives and visual vocabulary associated with the Qin dynasty, which was the first imperial dynasty of China. I created illustrations and graphics on GIMP, using a Wacom tablet. The illustrations included terracotta warriors reimagined as women warriors, and the First Emperor scratching his back. In addition, we created a website using Wix in order to display the graphics and the context behind them.
Instead of focusing on the military strength of the First Emperor, we aimed to capture him in a more humble pose. Instead of the fearsome Right Hand of Power (left), the First Emperor scratches his back like a regular man (right). By creating this piece, we intended to show that even a deified ruler cannot avoid everyday bodily issues. “Greatness” is maintained by eliminating private, banal, and inelegant moments, but in this project we insist on revealing them.
Scan the QR code to visit the Multiverse of Chinese Civilization website, where you can learn more about this experiment with visual counterfactuals and see Lydia Wei’s illustration of “Terracotta Women Warriors”.
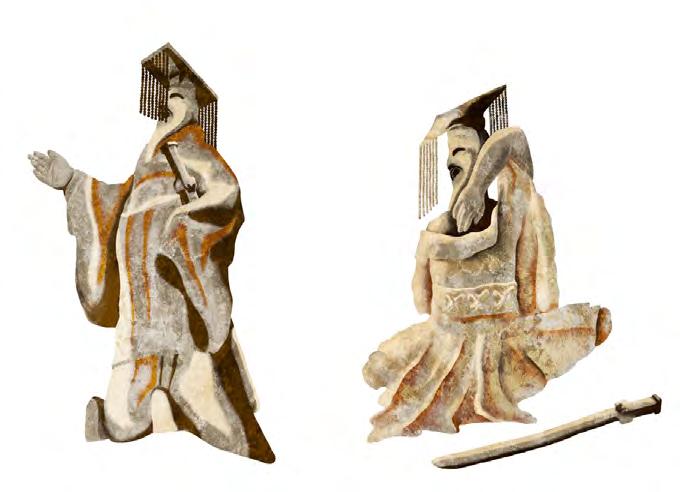
117 | Center For Spatial and Textual Analysis
Encoding the Postcolonial in Place
by Carmen Thong (English)I hypothesize that places are imbued and encoded with ideas, that some of these ideas correspond to the overall narrative structure of the nation, and that literature plays a big role in these processes of encoding. These places can either be named locations or a particular landscape; for example, the “frontier” is integral to the story of American individualism. I suspect that, for postcolonial nations, places are significantly encoded with colonial discourses. In this project, I ask: How have the nation-building projects of postcolonial nations been inhibited by, or built upon, these colonial encodings? Have these encodings changed since independence? Might knowing what has been encoded into postcolonial locales, and how, help to overwrite these encodings with new, local narratives? Can postcolonial nation-states account for these processes in their consideration of cultural, art, or tourism policies?
With the assistance of my intern, Katherine Wang, I am using computational methods, such as extracting the most distinctive words (MDWs) or most frequent collocations associated with a place, to trace the conceptual history of certain types of place or specific place names in selected postcolonial nations. At the same time, I am creating a digitized corpus of postcolonial literatures in collaboration with the Stanford Literary Lab and the Stanford Library, with the aim of making it available for other postcolonial research projects that might have been shelved due to the lack of such a corpus.
The top collocates found in a postcolonial literature corpus for three types of places.
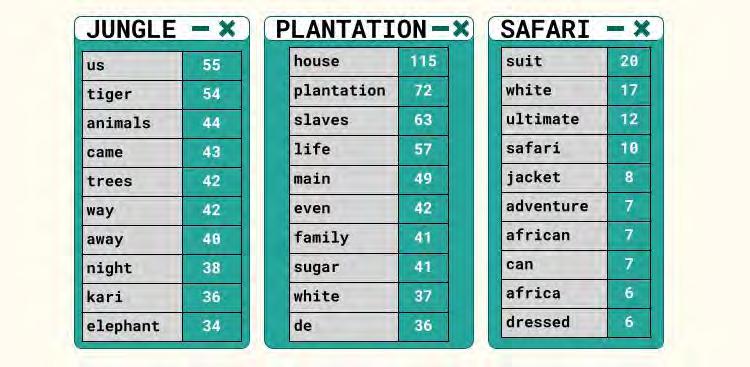
Notable collocates for Compton and Brooklyn in American rap lyrics, suggesting a narrative of place.
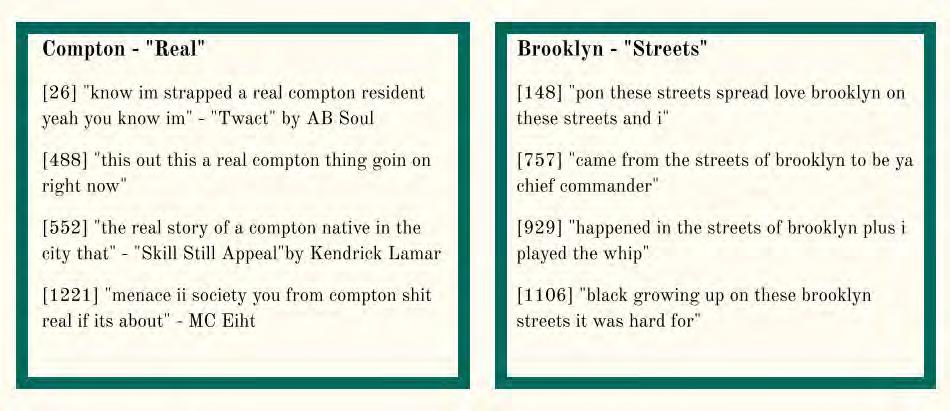
cesta.stanford.edu | 118
Updates on Other Projects and Programs


KNOW Systemic Racism: Community College Students’ Summer


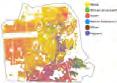
at CESTA
by Jonathan ClarkThis summer saw the second iteration of CESTA’s community college internship program, generously funded by the Office of Community Engagement. Dr. Daniel Bush collaborated with Dr. Falk Cammin of Foothill College to design and expand CESTA’s offering, more than doubling the number of student participants. This year’s interns came from De Anza College and Foothill College and had majors ranging from English to Engineering, Communications to Computer Science. The eight-week program provided them with training in digital humanities skills, including computational text analysis, spatial analysis, and data visualization, through hands-on participation in the KNOW Systematic Racism (KSR) project.
The KSR project is the creation of Felicia Smith, Stanford’s inaugural Racial Justice and Social Equity Librarian. It aims to “humanize the harm” against Black people which is often made difficult to see by statistical abstractions, obscure policy-making, and discriminatory legislation. KSR collects and analyzes data to support evidence-based documentation of systemic racism and to examine how it disproportionately segregates Black people from resources and services intended to contribute to upward mobility.
Stanford’s Digital Research Architect Nicole Coleman and History graduate student William Parish mentored the interns as they developed their own research projects under the KSR umbrella, including an investigation of the military equipment possessed by California law enforcement agencies and a historical study examining the marginalized Bayview-Hunters Point neighborhood of San Francisco.
A poster from the KNOW Systemic Racism project, created by interns Makayla Miller and Molara Mabogunje. They studied how policy-making has contributed to the marginalization of the Bayview-Hunters Point neighborhood in San Francisco.
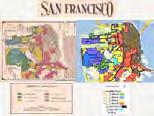
Redevelopment Plan Map for SF, Home Owners’ Loan Corporation (1937) Map of San Francisco Census (2010) (BHVP circled) KNOW Systemic Racism Researching the effects of macro-scale policies in Bayview-Hunters Point. Dept. of Humanities CESTA Intern for the K.S.R. Project The purpose of this project is to investigate how macro-scale policy in Bayview-Hunters Point in San Francisco has impacted its residents on a day-to-day level. We studied how policies such as development plans, policing, and redlining have affected the wealth, demographics, and well-being of the community. Student Researchers Makayla Miller ●Psychology → Education major ●Foothill Transfer student ●8 week intern at CESTA Percent of Population Over 25 With A High School Degree (2012) Median Household Incomes of BVHP and Parent Geographies (2013-2019) Molara Mabogunje ●Communications major ●Foothill Transfer student ●8 week intern at CESTA
119 | Center For Spatial and Textual Analysis
Literary Lab
2022 was another busy year for the Literary Lab, with ten presentations of new research and the return of the ever-popular Lab Day, where members and guests pitched new project ideas and chatted with potential collaborators over pizza and cake.
One new project which found a home in the Lab and has already shared preliminary findings is “Gender and Domestic Technology in Mid-Century Women’s Magazines,” an investigation of the postwar representation of domestic technology in a large corpus of popular fashion and lifestyle magazines. Using sentence-level MDWs, word embeddings, and dependency parsing, the project asks how the discourse of “modern conveniences” permeated writing—articles, adverts, short stories—aimed primarily at women.
The Lab also welcomed several visitors this year, including Zuza Leniarska (University of Warsaw), Svenja Guhr (Technical University of Darmstadt), and representatives of the Fabula-NET project (Aarhaus University). This summer, Lab Director Mark Algee-Hewitt was granted tenure and became the first ever “Professor of Digital Humanities” at Stanford University. Congratulations, Mark!
Considering Disability in Online Cultural Experiences
This project, which began its partnership with CESTA earlier this year, considers ways in which online cultural experiences may be rendered more inclusive for Disabled people, especially those who may not be able to engage with visual and/or auditory media without mediation through other perceptual means.
Artistic areas such as music, visual art, theater and dance were prompted by the COVID-19 pandemic to explore online experiences for both performers and audiences, through formats such as virtual museum visits or networked musical performances. These were often accessed through ad-hoc repurposing of video conferencing or video game software. While such online experiences can play a vital role in providing remote access to cultural artifacts, there is a need to further expand these experiences beyond commonly used software environments and the standard formats of a phone, tablet or computer screen and stereo sound, especially for the visually and/or hearing impaired.
The project team is working with a range of on-campus and external partners to identify Disabled people’s needs and desires for online experiences and what enhancements might be most effective in meeting those needs. In the process of making online experiences more accessible, the team hopes to propose formats and paradigms that will offer more immersive, interactive, engaging, and meaningful experiences for all.
cesta.stanford.edu | 120
CESTA is Stanford’s hub for digital humanities, where faculty and students bring the power of humanistic investigation together with new technology to document, analyze, and understand the changing human experience. Learn more at cesta.stanford.edu