
10 minute read
INTRODUCTION

from Soils and the city: man shaping the Ghent urban landscape, hydrology and soils - excursion
by soil-belgium

Geomorphology, geology and hydrology of Ghent
Contemporary land- and soilscape
Advertisement
The city of Ghent is found at an altitude ranging from about 7m to 24m a.s.l (Belgian national reference for altitude measurements determined during the ‘Tweede Algemene Waterpassing’ or ‘Deuxième Nivellement Général’). The most prominent topographic feature when consulting the Digital Terrain Model (Figure 0.1) is the ‘Blandijnberg’, a large “mountain” (Dutch: berg) which dominated the surrounding landscape of the meandering Lys (Leie) and Scheldt (Schelde) rivers. Another “mountain” called ‘Zandberg’ leans against its north-northeastern slope. Both host the most prominent buildings of the Ghent scenery: the university library (Boekentoren) at the Blandijnberg, and the three towers of Saint Nicholas’ church, the belfry and the Saint Bavo’s cathedral at the Zandberg.
The soil map of Ghent clearly illustrates the lack of survey and analytical data inside the city center, which has been mapped as “anthropogenic” (Figure 0.2, Sys and Vandenhoudt, 1963). Yet, the soil map does show how Ghent is practically surrounded by marshlands or “watermeadows” (Dutch: meersen), corresponding to Late-Glacial paleo-meanders of the Lys and Scheldt rivers. Imperfectly to poorly drained sand, loamy sand and sandy loam (Lep, Pdp, Sep) soil types are found on the levees and strongly gleyic clayey (Eep and Ufp) soil types dominate the basin deposits. In wet winters, the latter depressions are flooded. The de Ferraris (1778) map provides one of the best views on these impressive water meadows west (BourgoyenOssemeersen, Blaarmeersen, Assels), north (Wondelgemmeersen, current harbour area), and east (Gentbrugse meersen, Damvallei, Heirnis and current cloverleaf R4-E17) of Ghent.
While both Lys and Scheldt rivers have a similar discharge, the Lys meanders slowly within her rather wide, alluvial valley, while the Scheldt river valley is much narrower. Thus, two very different rivers meet in Ghent. The confluence of two rivers Lys and Scheldt, the water meadows, and hills have largely determined the structure of the city. The town of Ghent thus
originated in the flat river landscape of the Flemish Valley, near the confluence of the rivers Lys and Scheldt ànd close to a Tertiary outlier, the Blandijnberg.
However, in the currently built-up environment, much (more) of the original topography and hydrography, has been obscured – not only by tall buildings – but also by raising grounds, dumping meanders and digging new canals.
The panoramic view of the city, made by an anonymous painter around 1543 (Figure 0.3), portrays several small hills, often occupied by windmills, as well as water meadows inside the current city center. Many current street names, some being about 800 years old, refer to “mountains”. By consequence, the original geomorphology of the city was more complex than described above.
We guide you along some of these diverse geomorphological features and illustrate how Ghent converted from a river landscape into the socio-natural city environment we experience today.
Figure 0.1. Topographic map (5 m resolution) of the Ghent area (source: DHMV2, Informatie Vlaanderen). Numbered dots indicate the approximate location of our excursion stops: (1) De Smet-De Naeyerpark, (2) Citadelpark, (3) Kattenberg, (4) Sint-Pietersabdij, (5) Muinkpark, (6) Herstraat, (7) Koning Albertpark, (8) Laurentplein, (9) Reep, and (10) Zandberg

Figure 0.2. Soil map (scale 1:20000) in the Ghent area (source: Databank Ondergrond Vlaanderen, Digital Soil Map of Flanders, map sheets 22-1 Gent and 22-2 Melle) showing the unsurveyed built-up zone superimposed on a pedoscape dominated by sandy to loamy sandy soils (blue colours) and sandy loam soils (yellowish colours). Note the patches of wet and moist, clayey soils in former river meanders of the Lys (Bourgoyen-Ossemeersen, Blaarmeersen and Assels) west of Ghent, the Scheldt (Gentbrugse meersen) south and east of Ghent, and the Kale Durme (Wondelgemse meersen) north of Ghent. Numbered dots indicate the approximate location of our excursion stops: (1) De Smet-De Naeyerpark, (2) Citadelpark, (3) Kattenberg, (4) Sint-Pietersabdij, (5) Muinkpark, (6) Herstraat, (7) Koning Albertpark, (8) Laurentplein, (9) Reep, and (10) Zandberg

Figure 0.3. Panoramic view on Ghent, anonymous, year 1534 (STAM – Ghent City Museum) – Ghent seen from the east - northeast
Geological and geomorphological genesis of the Ghent area
During the early periods of the Cenozoic (previously referred to as Tertiary), the Ghent area was flooded by the sea, albeit being close to the shoreline. Relatively limited sea level fluctuations of few meters up to about ten meter, resulted in significant differences in sedimentation with alternating series of clayey (deep water) and sandy (shallow water) marine sediments (Figure 0.4).

Figure 0.4. Tertiary lithostratigraphy (1:50,000) of the Ghent area (source: Databank Ondergrond Vlaanderen). Numbered dots indicate the approximate location of our excursion stops: (1) De Smet-De Naeyerpark, (2) Citadelpark, (3) Kattenberg, (4) Sint-Pietersabdij, (5) Muinkpark, (6) Herstraat, (7) Koning Albertpark, (8) Laurentplein, (9) Reep, and (10) Zandberg
The river landscape developed in the Pleistocene epoch of the Quaternary period, which was characterized by alternation of glacials and interglacials. Upon a drastic lowering of the sea level (glacial), thick layers of the marine Cenozoic sediments were eroded and the Flemish valley developed (Figure 0.5). As the sea retreated in northern direction, a number of rivers cut deeply into the tertiary marine sediments. The center of the Flemish valley was found just north of Gent,
while its southern extensions approximately corresponded to the current valleys of the Lys and Upper-Scheldt. The remnant Cenozoic sediments of this valley became covered with quaternary fluvio-periglacial sedimentary materials of variable composition, deposited by rain or meltwater in cold, wet periods (Figure 0.6).
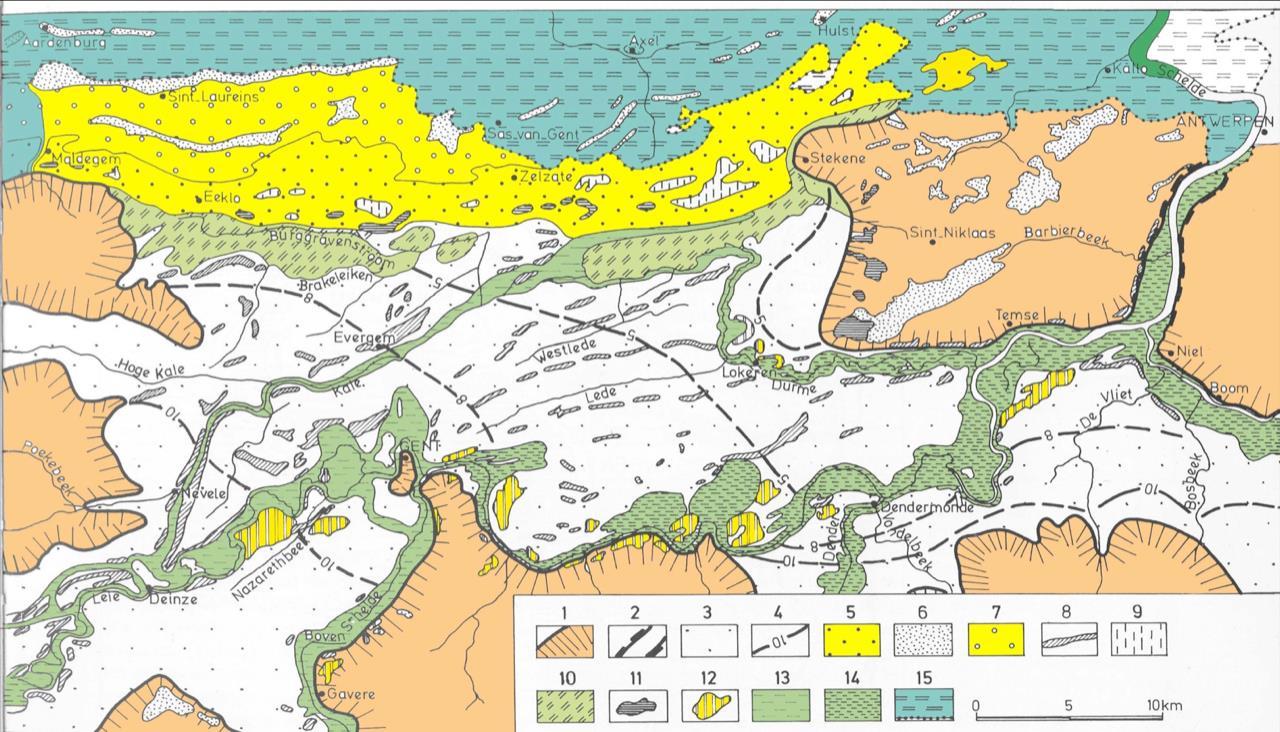
Figure 0.5. Geomorphological map of the microrelief in the surroundings of Ghent, showing the presence of cover sand ridges (n° 5, 6, 7 & 8) and shifting (land) dunes (n° 11) and river dunes (n° 12) within the fluvioperiglacial plain, intersected by the river flood zones (winter time) (source: Denis, 1992 after De Moor & Heyse, 1989, adapted by Antrop, 2016).
During the Late-Weichselian at the end of the Pleistocene, a very cold but dry period with very little vegetation, wind erosion further modified the river landscape. Formation of a large cover sand ridge named Maldegem and Stekene (with a west – east orientation) blocked the flowing down of Lys and Scheldt, turning their direction to the east, to Antwerp. The finest soil particles were blown (far) away and sand surfaces covered the landscape, constituting cover sands (dekzanden) that filled the Flemish Valley. Such aeolian deposits accumulated to cover sand ridges, perpendicular to the dominant north to northwestern winds. They consist of well sorted, fine to moderately fine sands. They typically cover a grind layer, the deflation surface. Shifting sands on these cover sand surfaces locally resulted in the formation of land dunes. While also within the dried sandy riverbeds, drifting sand could accumulate to form river dunes.
The alternation of glacials and interglacials in the Pleistocene had also affected the character of the river networks, giving rise to braided rivers affecting large areas during the glacials, and meandering rivers during the interglacials.
Finally, the permafrost disappeared and meandering rivers cut into the Weichselian sediments. The Holocene valleys however got filled with alluvial sediments following the rise of the sea level, groundwater table and change in climate.

Figure 0.6. Quaternary geological map of Ghent (scale 1:50,000, source: Databank Ondergrond Vlaanderen, Quartairgeologische kaart - Kaartblad 22 Gent, by S. Vermeire, J. Roder, S. Sammier i.s.m. G. De Moor (Haecon nv.), 1999)
The unique location of Ghent in the Flemish Valley implies that these diverse geomorphological features – the prominent tertiary outlier, the slightly elevated cover sands, and the low-lying water meadows, are and/or were also found within its territory.
Multidisciplinary data sources (old maps, paintings, accounts, toponyms, augerings, geological maps), yet of variable age and reliability, can be integrated into spatially continuous representations of this partly visible, partly hidden urban environment. Reconstructions of the original “natural” urban landscape, hydrography, geology and soilscape however remains a challenge. Figure 0.7 shows the location of the cover sands and marshlands in and around Ghent (Gelaude, 2018).

Figure 0.7. Cover sands (yellow) and water meadows (green) and Tertiary outlier ‘Blandijnberg (orange) in and around Ghent (map by F. Gelaude)
Urban soil sampling and analysis campaign in Ghent
Fifteen undisturbed soil cores were collected within the city of Ghent in the frame of a doctoral research. Sampling locations were selected by random stratified sampling based on land use and time since urbanization, using a GIS (Figure 0.8, Table 0.1). Three different land uses were considered: parks, residential zones and the aggregated land use class ‘institutional / commercial / industrial’. In addition, three city quarters were selected as proxy for time since development: ‘Wondelgem’ was developed only after 1969. ‘Station South’ was mainly urbanized in the beginning of the 20th century. Lastly, ‘Inner City’ was urbanized prior to 1884.

Figure 0.8. A) Location of Ghent in Belgium; B) Sampling locations in three city quarters (Wondelgem, Station South and Inner City) of Ghent.
Undisturbed soil cores were collected using a soil column cylinder auger (diam. 10 cm, 100 cm) mounted on gasoline driven mechanical hammer (Figure 0.9). Where possible, profiles were sampled up to a minimal depth of 125 cm (in two runs, namely 0-100 cm, 100-125 cm). The soil columns were transferred to plastic liners for transport and stored in the freezer (-20°C). Next, the frozen cores were split using a benchtop mounted diamond saw blade. Cutting planes were carefully cleaned by removing a fine layer of material, and air-dried. One soil core half was used for scanning, whereas the other soil core half was used for soil description and physico-chemical characterization.
Detailed profile descriptions were carried out on the undisturbed soil cores according to the Guidelines for Soil Description (FAO, 2006).
Soil cores were analyzed on horizon basis for a range of physical and chemical properties. Organic debris was removed and samples were hand-sieved to separate the coarse (> 2mm) from the fine (≤ 2 mm) fraction. pH was measured in 1 mol·l-1 KCl (1:5 soil:extract) using a combined glass electrode (ISO 10523:2008). Electrical conductivity was measured in a 1:5 soil:water ratio (Van Ranst et al., 1999). Soil particle size distribution (clay: 0-2 µm, loam: 2-50 µm, sand: 50-2000 µm) was determined using the Robinson-Köhn pipette method after removal of organic carbon and
carbonates. Total carbon (TC) and total inorganic carbon (TIC) was analyzed by catalytic oxidation and infrared spectrometry after acid digestion (H3PO4), respectively, using the SSM-5000A Shimadzu. Total organic carbon (TOC) equaled the difference between the measured TC and TIC concentrations. For some samples, significant amounts of technic organic carbon (OCtech) from soots, ashes or coal were expected. For these samples, OCtech was calculated by TC – TIC –OChum, the latter being humus content estimated after carbon analysis with (to destroy the humus) and without application of water peroxide (H2O2).
Table 0.1: Site characteristics for soil profiles collected in the quarters Wondelgem (C1-C5), Station South (C6-C10) and Inner City (C11-C15). Profile E1 has been collected at an archeological excavation at the former ‘Wintercircus’, located in Inner City.
Profile Land use Land cover Adress Coordinates
no. C1 Park Grass Park Buffer R4 51.096°N; 3.704°E C2 Industrial Grass Pantserschipstraat 51.094°N; 3.724°E C3 Industrial Grass Industrieweg 51.092°N; 3.690°E C4 Residential Grass Langeveld 51.091°N, 3.699°E C5 Residential Grass Marcastraat 51.085°N; 3.709°E C6 Institutional Grass Schoonmeersen 51.033°N; 3.703°E C7 Park Grass Park de Smet de Naeyer 51.033°N; 3.713°E C8 Residential Wood chips Achilles Musschestraat 51.033°N; 3.720°E C9 Residential Grass Flamingostraat 51.031°N; 3.707°E C10 Institutional Grass Campus De Sterre 51.025°N; 3.709°E C11 Park Grass Park Baudelohof 51.059°N; 3.728°E C12 Residential Gravel Onderstraat 51.056°N; 3.724°E C13 Residential Grass Willem Tellstraat 51.047°N; 3.722°E C14 Park Grass Koning Albertpark 51.045°N; 3.731°E C15 Park Grass Muinkpark 51.042°N; 3.731°E E1 Commercial Concrete Sint-Pietersnieuwstraat 51.048°N; 3.728°E
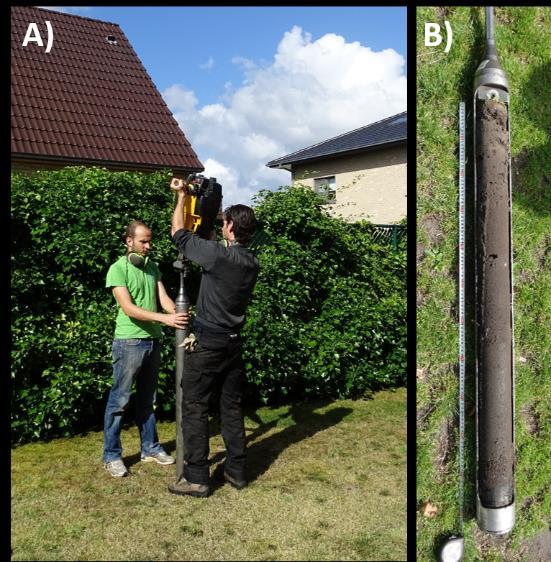
Figure 0.9. A) Sampling using soil column cylinder auger mounted on a mechanical hammer; B) Undisturbed soil core after sampling.
In addition, undisturbed soil cores were scanned using the Multi-Sensor Core Logger (Geotek Ltd.) to provide high-resolution photographs, and determine magnetic susceptibility and gamma density. The collected soil profiles strongly differ in morphological and soil physico-chemical characteristics (Figure 0.10). During the excursion, we will shed light on some of these collected soil profiles to uncover the diversity of urban soils in the city of Ghent.

Figure 0.10. Overview of soil profiles collected in the quarters Wondelgem (C1-C5), Station South (C6-C10) and Inner City (C11-C15). Profile E1 has been collected at an archeological excavation at the former ‘Wintercircus’, located in Inner City. Information on site characteristics is provided in Table 0.1.


