Signal & Image Processing: An International Journal (SIPIJ) Vol.10, No.5, October 2019
IMPROVEMENTS OF THE ANALYSIS OF HUMAN ACTIVITY USING ACCELERATION RECORD OF ELECTROCARDIOGRAPHS Itaru Kaneko1, Yutaka Yoshida 2 and Emi Yuda3 1&2Nagoya City University, Japan 3Tohoku University, Japan
ABSTRACT The use of Holter Electrocardiograph (Holter ECG) is rapidly spreading. It is a wearable electrocardiograph that records 24-hour electrocardiograms in a built-in flash memory, making it possible to detect atrial fibrillation (Atrial Fibrillation, AF) through all-day activities. It is also useful for screening for diseases other than atrial fibrillation and for improving health. It is said that more useful information can be obtained by combining electrocardiograph with the analysis of physical activity. For that purpose, the Holter electrocardiograph is equipped with heart rate sensor and acceleration sensors. If acceleration data is analysed, we can estimate activities in daily life, such as getting up, eating, walking, using transportation, and sitting. In combination with such activity status, electrocardiographic data can be expected to be more useful. In this study, we investigate the estimation of physical activity. For the better analysis, we evaluated activity estimation using machine learning as well as several different feature extractions. In this report, we will show several different feature extraction methods and result of human body analysis using machine learning.
KEYWORDS Wearable, Biomedical Sensors, Body Activity, Machine Learning
1.INTRODUCTION In this report, the improvement of the physical activity estimation method using the built-in acceleration sensor of the Holter electrocardiograph is described. The authors' group is conducting applied research on Holter Electrocardiograph (Holter ECG) [1] [2]. With the Holter electrocardiograph worn on the chest, it can measure electrocardiograms for 24 hours and detect atrial fibrillation in daily life. Its use is increasing due to the growing interest in health and cost reduction of equipment. More importantly, we can use data from electrocardiograph for further analysis to get other valuable health-related statistics. If the national electronic health record (National HER) is provided in full scale in the future, it is also beneficial to include electrocardiograph as part of database [3] [4]. In that case, the usefulness of the analysis of electrocardiograms will be further enhanced if it is possible to know the physical activity together. Therefore, the Holter electrocardiograph has not only with an electrocardiograph but also a heart rate and acceleration DOI: 10.5121/sipij.2019.10504
39
Signal & Image Processing: An International Journal (SIPIJ) Vol.10, No.5, October 2019 sensor function. It can be expected that more useful information for analysing the health condition can be obtained by recording them together. Physical activity is related to the incidence of arrhythmia. In addition to arrhythmia, it is well known that physical activity affects diabetes, metabolic syndrome, cardiovascular disease, cancer, and maintenance of functional levels. Therefore, a more accurate reading of physical activity from acceleration data is a beneficial challenge. In this paper, we will evaluate the estimation method of human activity using acceleration data. Although it is limited information, it can be used to estimate physical activity in daily life such as wake-up time, meals, walking, transportation, and sitting work. In combination with these, it can be expected that the electrocardiograph data can be applied to a more advanced analysis of health conditions. In the following sections, we will explain the objective of the research in Section 2. Section 3 will show some results of the evaluation of the acceleration sensor in electrocardiograph. Which is necessary to ensure the enough precision of the estimation of activity. Section 4 will describe the experimental condition to the acquisition of the acceleration data through a different activity. In the section 5, we compare various feature extraction methods. In the section 6, we show the result using machine learning. And we summarize the report in section 7.
2. OBJECTIVE OF RESEARCH The objective of the research is the evaluation of the estimation method of physical activity using the acceleration sensor of the Electrocardiograph. We evaluate several feature extraction methods and get a useful assessment of those. We will also show the result of the discrimination experiment using machine learning.
3. EXPERIMENTAL EQUIPMENT’S 3.1 Acceleration sensor devices In the first, we will examine the nature of information can be obtained from Holter ECG data. We start from examine the characteristics of the built-in sensor. The Holter electrocardiograph has a built-in 3-axis accelerometer. The sampling frequency is about 30Hz. Table 1 shows the general acceleration sensor specifications to show the specification of acceleration information that can be obtained. Table 1. Acceleration sensor devices.
Part ID
Sampling Freq
Acceleration Rannge
Precision
Kionix MM8452 Analog Devices
-800Hz
2G
8bit
3200Hz
16G
10bit at 100Hz,
5000Hz
16G
12bit
ADX345 ~ ST LIS3DH
An accelerometer with a 12-bit accuracy using MEMS is generally used in those devices. When the range of acceleration is about 4G (G for gravitational acceleration) at 100Hz, the accuracy is about 13bit and the accuracy is about 1mG (milli G). 40
Signal & Image Processing: An International Journal (SIPIJ) Vol.10, No.5, October 2019 The price of the device is about $50 on the sample base, and it is thought that it will be under several tens of yen in mass order because the MEMS device could be the very low price in massproduction. A gyro sensor detects angular changes in addition to acceleration. The gyro sensor requires more complex parts, and the price is higher. Therefore, it is not built-in many electrocardiographs, but it is built-in smartphones. If gyro sensors give merit in the analysis of physical activity, then it will gives strong reason to build it into the electrocardiograph. The sampling frequency of the acceleration sensor element is about 100Hz, and the sampling frequency of acceleration recording of electrocardiograph used this time is about 30Hz. We checked whether this sampling frequency is enough for our estimation. Figure 1 shows the frequency distribution of the measured acceleration signal. Since the power of the spectrum is distributed below 10Hz, which is far below Nyquist frequency, the sampling frequency of the measurement is sufficient.
[Hz]
[Hz]
[Hz] Figure 1. Frequency Distribution of the signal
Next, we confirmed the cumulative error of the estimated position derived from measurement error. The error is 0.75LSB at 100Hz in 4G amplitude, which is the specification of one of the typical devices, ADX345. This corresponds to an error of about 1mG (1/1000 of gravitational acceleration). If this maximum error is accumulated, the error of the position may have an error of 0.5 mm after 1 second and 50 mm after 10 seconds. However, when trying to reproduce the position from the acceleration, the polarization of the error becomes a bigger problem. If the high-frequency component of acceleration is small and the amplitude of acceleration change is about 1 LSB or less, simple rounding quantization will 41
Signal & Image Processing: An International Journal (SIPIJ) Vol.10, No.5, October 2019 cause the quantization noise to be negative if the pre-quantization value is less than 0 to 0.5, for example. , It causes the polarization to increase accumulated error when the integration operation is performed. To avoid this, it is desirable to add Âą 0.5LSB as noise before quantization. Figure 2 shows waveform of acceleration and its detailed waveform where almost no signal. Looking at the plot of the lower figure, which represents waveform where amplitude is around LSB, noise with an amplitude of about Âą 0.7LSB is always present in the small-amplitude signal area. Therefore, it is estimated that noise shaping is being applied to prevent accumulated errors. The accumulated error in the same direction position should less than about 50mm per second with an error of 0.75LSB, but with noise shaping, an accumulated error should be much smaller than that.
1=LSB
[s]
1=LSB
[s] Figure 2. Near LSB noise signal
4. EXPERIMENTAL CONDITION 4.1 Subjects The subjects were 10 subjects who agreed with the purpose of this experiment and the use of data. Wearable electrocardiographs were attached to 10 healthy subjects in their 20s (2 men and 8 women), and acceleration was obtained from a 3-channel acceleration sensor.
4.2 Experimental protocol Each subject took physical activity in the order shown in Figure 3 and was periodically switched to the next state. The state was held for 110 seconds and transferred to the next physical activity in 10 seconds.
42
Signal & Image Processing: An International Journal (SIPIJ) Vol.10, No.5, October 2019 Figure 4 shows the experimental layout. With such an arrangement, subjects are staying at each location in 110 seconds and moving to the next location in 10 seconds. Table 2 shows test patterns for conducting experiments on multiple subjects in parallel.
Figure 3. List of physical activity
Figure 4. Experimental layout (Floor layout)
43
Signal & Image Processing: An International Journal (SIPIJ) Vol.10, No.5, October 2019 Table 2. Test pattern for supine, sitting, standing and walking
SGK001 SGK002 SGK003 SGK004R SGK005 SGK006 SGK007 SGK008 SGK009 SGK011 SGK012
(1) (3)
(5) (7) (9) (12) (1) (3)
(5) (9) (12)
(2) (4) (6) (8) (11) (13) (2) (4) (6) (11) (13)
(3) (5) (7) (9) (12) (1) (3) (5) (7) (12) (1)
5. ANALYTIC EXPERIMENT 5.1 Random forest b discrimination method In the random forest discrimination method, we used statistical value based on acceleration data for the four patterns of sitting, sitting, standing and walking. The triaxial acceleration value was re-sampled at 2 Hz with [Eq 1] as an absolute value. [Eq. 1] We grouped time series of G every 10 seconds and we calculated mean and standard deviation as the basic statistic index. In addition, we included the maximum and minimum median as additional indexes. This was identified and verified by the K-division cross-validation method. In the random forest method, even if there are many explanatory variables, significant explanatory variables are automatically selected from them. The method is known to be relatively efficient and robust. On the other hand, because decision tree-based identification, decision tree identification is a threshold for each variable. The selection of explanatory variables is important, and it is necessary to prepare explanatory variables suitable for identification purposes.
5.2 CNN based method In the random forest discrimination using statistical value, the distinction between standing and sitting positions is expected to be difficult. So we also evaluated other feature extraction methods. The difference between the center of gravity is large between standing and sitting, but the average center of gravity is difficult to read from the acceleration. This is because if the relative motion of the body is the same, the temporal change in acceleration of the body will be also the same or very similar even if the height of the body is different between “standing” and “sitting”. Therefore we tried to distinct the context of acceleration across multiple physical activities. In that case, the change in the height of the center of gravity is thought to be concentrated at a certain point in the boundary such as sitting-> standing position, supine-> sitting position. In order to distinguish these patterns, CNN (Convolutional Neural Network) is might be more
44
Signal & Image Processing: An International Journal (SIPIJ) Vol.10, No.5, October 2019 suitable compared to using the random forest discrimination method, because it can avoid location dependency of the extracted feature. Therefore, we examined the case where acceleration is applied to CNN without pre-processing and the case where acceleration is pre- processed and applied to CNN. The CNN process consists of the following steps. First, features are extracted from the signal in the Convolution layer. Next, the polling layer accumulates the features and reduces the number of samples. Finally, the optimal weight to discriminate from the obtained features is learned by the back propagation algorithm in the fully connected layer.
5.3 Cepstrum transfer as a feature Several conversions of acceleration changes are possible as pre-processing of CNN. As one example, cepstrum is calculated as Figure 5. By calculating cepstrum, movement invariance, one of the features of CNN, can be realized at the feature extraction stage.
Figure 5. cepstrum
Figure 6. Acceleration Data – before LPF
45
Signal & Image Processing: An International Journal (SIPIJ) Vol.10, No.5, October 2019
Figure 7. Acceleration Data – before LPF (0.066Hz, Wl=15s)
5.4 Low pass filter A low pass filter is a simple tool to extract signals in low frequency [5][6]. Figure 6 and Figure 7 show the results of applying acceleration data and 0.066Hz LPF, respectively. It can be expected that the noise included in the acceleration data can be effectively reduced by applying 0.066Hz LPF. We will also check whether the above-mentioned processing improves the recognition rate by
5.5 Time-Frequency Distribution A temporal signal such as acceleration of body movement can be represented also as timefrequency distribution as shown in Figure 8. To derive time-frequency distribution, we tried to convert the acceleration signal to 28 by 28 matrix. Each column corresponds to the 10 seconds overlapped window and each raw corresponds to the 0.1Hz frequency band. Upper half 14 lines correspond to the symmetric component and the lower half 14 lines correspond to the asymmetric components. Those are expected to be useful to identify rising or falling of the center of gravity in the temporal progression of acceleration data.
Figure 8. Time-Frequency distribution of the transition from round chair to standing position
46
Signal & Image Processing: An International Journal (SIPIJ) Vol.10, No.5, October 2019
6. RESULT Currently, random forest discrimination is giving the best result in our comparison. Table 3 shows the results. A reproducibility of 94% or more was achieved in the standing position, standing position, and walking, but the standing position was misidentified as the sitting position. However, since valuable characteristics are seen in the other feature extraction method, we are continuing the effort to get a better result from other feature extraction methods combining other discrimination methods. Table 3. Experimental Estimated result of Supine/Sitting/Walking
Supine Sitting Standing Walking
Supine 394 14 0 2
Sitting 4 473 91 4
Standing 0 6 8 1
Walking 2 7 0 193
N 400 500 99 200
Reproduce rate 0.98 0.94 0.08 0.96
7. SUMMARY In this report, the evaluation of the several estimation method of the physical activity using the built-in acceleration sensor of the Holter electrocardiograph was described. Regarding the estimation method of physical activity, the various feature extraction method was compared. To extract the clearest feature from the acceleration data, a low pass filter having a 0.066Hz low pass filter derived the most preferable result. We also showed the result of the discrimination experiment using a machine learning technique. The method shows a reasonable discrimination ratio. However, it has some drawbacks in discrimination of standing and sitting. We expect that it is because of the lack of features to show the difference between those two statuses, e.g. sitting and standing. For better discrimination, we are going to integrate machine learning methods with other feature extraction methods.
ACKNOWLEDGEMENTS Acknowledgments We would like to express our gratitude to the research staff in Nagoya City University Graduate School of Medicine and Medical and Medical Education for their efforts to collect data for this study. In conducting the experiment, the volunteers of the test subjects cooperated, and in analysing the data, we received the cooperation of many people, including those of the Suzuken Kenz Division, I am very grateful to you.
REFERENCES [1] Yuda E, Hayano J, Menstrual Cycles of Autonomic Functions and Physical Activities, 2018 9th International Conference on Awareness Science and Technology (iCAST 2018), September 19- 21, (2018) [2]
Hayano J, Introduction to heart rate variability. In: Iwase S, Hayano J, Orimo S, eds Clinical assessment of the autonomic nervous system. Japan.
[3]
Yuda E, Furukawa Y, Yoshida Y, Hayano J, ALLSTAR Research Group, Association between Regional Difference in Heart Rate Variability and Inter-prefecture Ranking of Healthy Life Expectancy: ALLSTAR Big Data Project in Japan, Proceedings of the 7th EAI International Conference on Big Data Technologies and Applications (BDTA), Chung-ang University, Seoul, South Korea, November 17-18 (2016)
47
Signal & Image Processing: An International Journal (SIPIJ) Vol.10, No.5, October 2019 [4]
YOSHIHARA Hiroyuki, gEHR Project: Nation - wide EHR Implementation in JAPAN, Kyoto Smart city Expo, https://expo.smartcity.kyoto/2016/doc/ksce2016_doc_yoshihara.pdf (captured on 2016)
[5]
J Jaybhay, R Shastri, A study of speckle noise reduction Filters‖ Signal & Image Processing, SIPJ Vol. 6,2015
[6]
Mrs V.Radhika1 & Dr G. Padmavathi , Performance of various order statistics filters in impulse and mixed noise removal for rs images, SIPIJ, Vol. 1, No. 2, December 2010
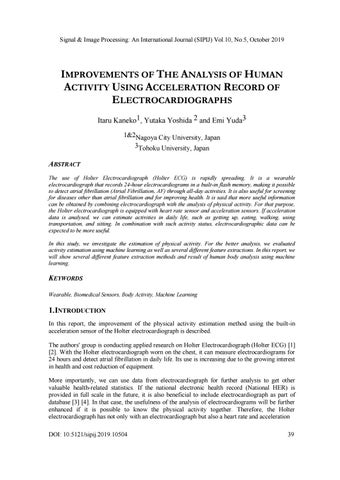
AUTHORS Itaru Kaneko Visiting Associate Professor, HBSL, Department of Medical Education, Nagoya City University Graduated.
Emi Yuda Assistant Professor, Dept. of Electrical Engineering, Tohoku University Graduate School of Engineering.
Yutaka Yoshida Research Engineer, HBSL, Department of Medical Education, Nagoya City University Graduated.
48