KEYSTONE POTTER GP-USA DERONDA DURHAM JESSIE VG-88-3YR-USA DOM
02-03 2X Lifetime:
305
26,850 3.9% 1,034 3.3% 34,299 3.9% 1,338 3.3%
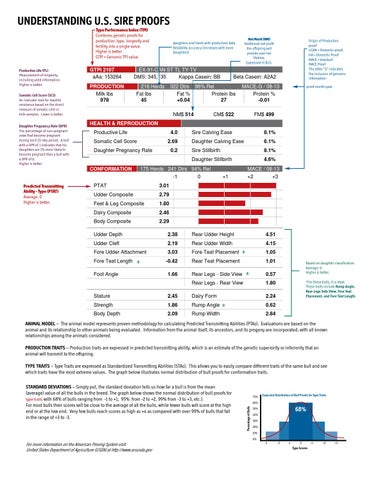
UNDERSTANDING U.S. SIRE PROOFS
REGANCREST ELTON DURHAM EX-90-USA GM WILCOXVIEW LEE JAMIE 05-05 2X 305 46,041 4.1% 1,898 Type Performance Index (TPI) EX-91-6YR-USA GMDfor DOM Lifetime: 99,650 4.1% 4,134 Combines genetic proofs production, type, longevity and daughters and herds with production data fertility into a single value. Reliability accuracy (increases with more Higher is better. daughters) GTPI = Genomic TPI value
Productive Life (PL) Measurement of longevity, including yield information. Higher is better. Somatic Cell Score (SCS) An indicator trait for mastitis resistance based on the direct measure of somatic cells in milk samples. Lower is better. Daughter Pregnancy Rate (DPR) The percentage of non-pregnant cows that become pregnant during each 21-day period. A bull with a DPR of 1 indicates that his daughters are 1% more likely to become pregnant than a bull with a DPR of 0. Higher is better.
GTPI 2107 aAa: 153264 PRODUCTION Milk lbs 978
EX-91-CAN ST TL TY TV DMS: 345,135 Kappa Casein: BB 216 Herds Fat lbs 45
Net Merit (NM) Additional net profit the offspring will provide over her lifetime. Expressed in $US.
Origin of Production proof USDA = Domestic proof; HA = Domestic Proof MACE = Interbull MACE Proof The letter “G” indicates the inclusion of genomic information proof month-year
MACE-G / 08-13 Protein % -0.01
CM$ 522
FM$ 499
HEALTH & REPRODUCTION Productive Life
4.0
Somatic Cell Score
2.69
Daughter Pregnancy Rate
CONFORMATION
0.2
Sire Calving Ease
8.1%
Daughter Calving Ease
6.1%
Sire Stillbirth
8.1%
Daughter Stillbirth
4.6%
175 Herds 241 Dtrs 94% Rel -1
Predicted Transmitting Ability - Type (PTAT) Average: 0 Higher is better.
1,715 lbs 3,541 lbs
Beta Casein: A2A2
322 Dtrs 96% Rel Fat % Protein lbs +0.04 27 NM$ 514
3.7% 3.6%
882 lbs 1,142 lbs
PTAT
3.01
Udder Composite
2.79
Feet & Leg Composite
1.80
Dairy Composite
2.46
Body Composite
2.29
0
MACE / 08-13 +1
+2
+3
Udder Depth
2.38
Rear Udder Height
4.51
Udder Cleft
2.19
Rear Udder Width
4.15
Fore Udder Attachment
3.03
Fore Teat Placement
-0.42
Rear Teat Placement
1.66
Rear Legs - Side View
Fore Teat Length
*
Foot Angle
*
1.05 1.01
*
0.57
Rear Legs - Rear View
1.80 2.24
Stature
2.45
Dairy Form
Strength
1.86
Rump Angle
Body Depth
2.09
Rump Width
Based on daughter classification. Average: 0 Higher is better.
*
*For these traits, 0 is ideal. These traits include Rump Angle, Rear Legs Side View, Fore Teat Placement, and Fore Teat Length.
0.62 2.84
ANIMAL MODEL – The animal model represents proven methodology for calculating Predicted Transmitting Abilities (PTAs). Evaluations are based on the animal and its relationship to other animals being evaluated. Information from the animal itself, its ancestors, and its progeny are incorporated, with all known relationships among the animals considered. PRODUCTION TRAITS – Production traits are expressed in predicted transmitting ability, which is an estimate of the genetic superiority or inferiority that an animal will transmit to the offspring. TYPE TRAITS – Type Traits are expressed as Standardized Transmitting Abilities (STAs). This allows you to easily compare different traits of the same bull and see which traits have the most extreme values. The graph below illustrates normal distribution of bull proofs for conformation traits.
70%
Expected Distribution of Bull Proofs for Type Traits
60%
Percentage of Bulls
STANDARD DEVIATIONS – Simply put, the standard deviation tells us how far a bull is from the mean (average) value of all the bulls in the breed. The graph below shows the normal distribution of bull proofs for type traits with 68% of bulls ranging from -1 to +1, 95% from -2 to +2, 99% from -3 to +3, etc.). For most bulls their scores will be close to the average of all the bulls, while fewer bulls will score at the high end or at the low end. Very few bulls reach scores as high as +4 as compared with over 99% of bulls that fall in the range of +3 to -3.
68%
50% 40% 30% 20% 10% 0%
For more information on the American Proving System visit: United States Department of Agriculture (USDA) at http://www.arsusda.gov
-3
-2
-1
0
Type Scores
+1
+2
+3