C10
02/08/2011
18:0:3
Page 381
CHAPTER 10
THE FUNDAMENTALS OF CAPITAL BUDGETING
the project’s discounted and cumulative discounted cash flows. Note that the first year’s cash flow is D 20 000 and its discounted value is D 18 182 (D 20 000 0.9091); the second year’s cash flow is also D 20 000 and its discounted value is D 16 529 (D 20 000 0.8264). Now, looking at the cumulative discounted cash flows row, notice that it turns positive between two and three years. This means that the discounted payback period is two years plus some fraction of the third year’s discounted cash flow. The exact discounted payback period computed value is 2 þ (D 5289/D 15 026) ¼ 2 þ 0.35 ¼ 2.35. As expected, the discounted payback period is longer than the ordinary payback period (2 < 2.35), and in 2.35 years the project will reach NPV ¼ 0. The project NPV is positive (D 9737); therefore, we should accept the project. But notice that the payback decision criteria are ambiguous. If we use 2.0 years as the payback criterion, we reject the project and if we use 2.5 or 3.0 years as criterion, the project is accepted. The lack of a definitive decision rule remains a major problem with the payback period as a capital budgeting tool.
Evaluating the Payback Rule In spite of its lack of sophistication, the standard payback period is widely used in business in part because it provides an intuitive and simple measure of a project’s liquidity risk. This makes sense because projects that pay for themselves quickly are less risky than projects whose paybacks occur
further in the future. There is a strong feeling in business that ‘getting your money back quickly’ is an important standard when making capital investments. Probably the greatest advantage of the payback period is its simplicity; it is easy to calculate and easy to understand, making it especially attractive to business executives with little training in accounting and finance. When compared with the NPV method, however, the payback method has some serious shortcomings. First, the standard payback method does not use discounting; hence, it ignores the time value of money. Second, it does not adjust or account for differences in the riskiness of projects. Another problem is that there is no economic rationale for establishing cut-off criteria. Who is to say that a particular cut-off, such as two years, is optimal with regard to maximising shareholder value? Finally, perhaps the greatest shortcoming of the payback method is its failure to consider cash flows after the payback period, as illustrated by projects D and E in Exhibit 10.6. This is true whether or not the cash flows are discounted. As a result of this feature, the payback method is biased towards shorter-term projects, which tend to free up cash more quickly. Consequently, projects for which cash inflows tend to occur further in the future, such as research and development investments, new product launches and entry into new lines of business, are at a disadvantage when the payback method is used. The accompanying table summarises major features of the payback period.
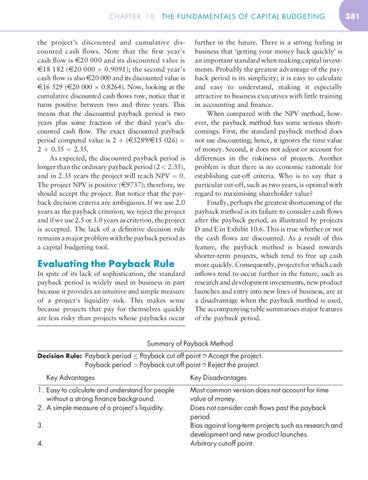
Summary of Payback Method Decision Rule: Payback period Payback cut off point ò Accept the project. Payback period > Payback cut off point ò Reject the project. Key Advantages 1. Easy to calculate and understand for people without a strong finance background. 2. A simple measure of a project’s liquidity. 3. 4.
Key Disadvantages Most common version does not account for time value of money. Does not consider cash flows past the payback period. Bias against long-term projects such as research and development and new product launches. Arbitrary cut-off point.
381