Stueck, M. & Villegas, A. • Overview an biodanza research – an 8-aspect-approach
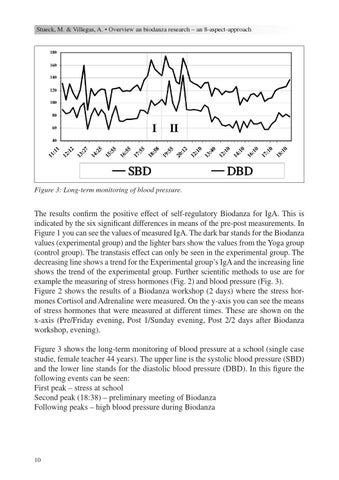
Figure 3: Long-term monitoring of blood pressure.
The results confirm the positive effect of self-regulatory Biodanza for IgA. This is indicated by the six significant differences in means of the pre-post measurements. In Figure 1 you can see the values of measured IgA. The dark bar stands for the Biodanza values (experimental group) and the lighter bars show the values from the Yoga group (control group). The transtasis effect can only be seen in the experimental group. The decreasing line shows a trend for the Experimental group’s IgA and the increasing line shows the trend of the experimental group. Further scientific methods to use are for example the measuring of stress hormones (Fig. 2) and blood pressure (Fig. 3). Figure 2 shows the results of a Biodanza workshop (2 days) where the stress hormones Cortisol and Adrenaline were measured. On the y-axis you can see the means of stress hormones that were measured at different times. These are shown on the x-axis (Pre/Friday evening, Post 1/Sunday evening, Post 2/2 days after Biodanza workshop, evening). Figure 3 shows the long-term monitoring of blood pressure at a school (single case studie, female teacher 44 years). The upper line is the systolic blood pressure (SBD) and the lower line stands for the diastolic blood pressure (DBD). In this figure the following events can be seen: First peak – stress at school Second peak (18:38) – preliminary meeting of Biodanza Following peaks – high blood pressure during Biodanza
10