2 minute read
➢ Consolidating Gains


• Achieve continuous improvement by analyzing the success stories individually and improving from those individual experiences.
Anchoring Change in the Corporate Culture
Advertisement
• Discuss the successfulstories related to change initiatives on every given opportunity.
• Ensure that the change becomes an integral part in your organizational culture and is visible in every organizational aspect.
• Ensure that the support of the existing company leaders as well as the new leaders continue to extend their support towards the change.
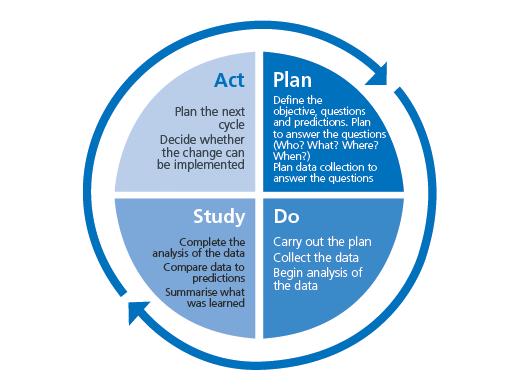
• PDSA
• The four stages of the PDSA cycle are:
• Plan – the change to be tested or implemented
• Do – carry out the test or change
• Study – based on the measurable outcomes agreed before starting out, collect data
• before and after the change and reflect on the impact of the change and what was learned
• Act – plan the next change cycle or full implementation.
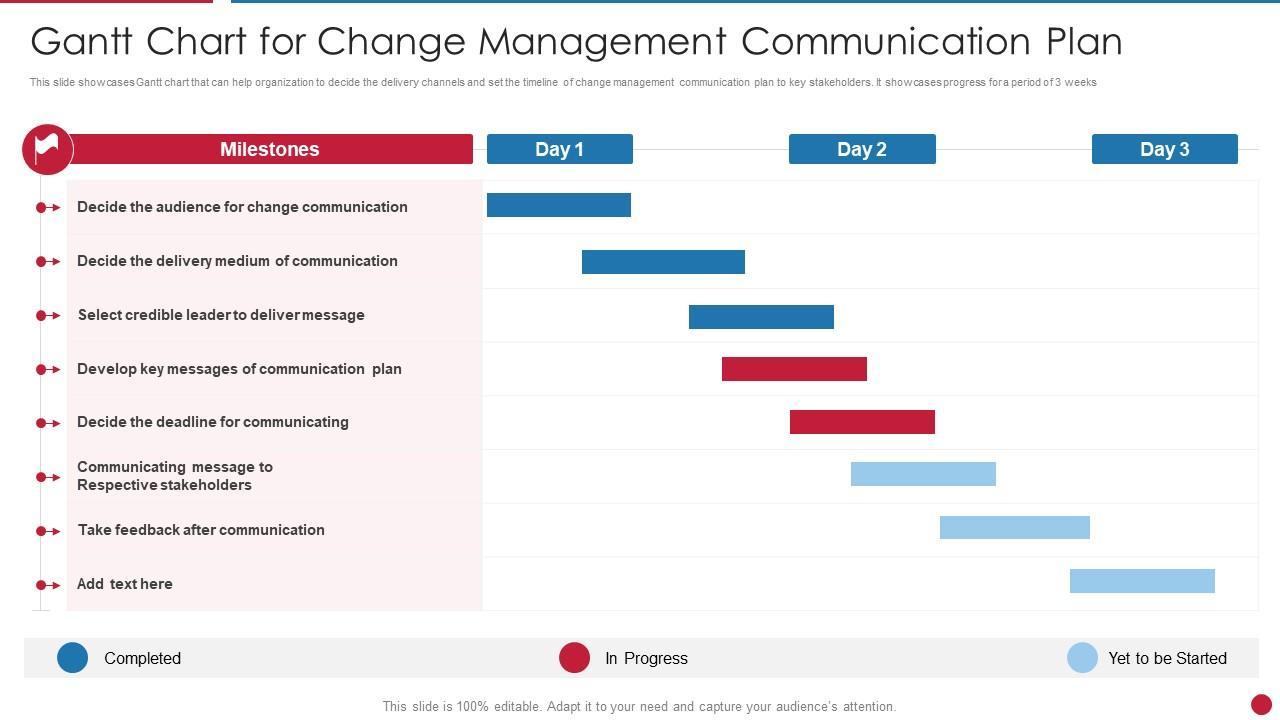
GANTT charts-planning Activities
• A Gantt chart is a project planning tool that can be used to represent the timing of the tasks required to complete a project. Because they are simple to understand and easy to construct they are used by most managers for all but the the most complex projects.
Construction of Gantt chart
• Each task takes up one row
• Dates run along the top in increments of days ,weeks or months
• The expected time for each task is represented by a horizontal bar whose left end marks the expected beginning of the task and the right end marks the expected completion date.
• Task may run sequentially in parallel or overlapping

The Main Benefits of Gantt Charts

➢It Provides a High-Level Overview
• A Gantt chart provides an overall perspective of a project and its timeline for both those who are deeply involved and those with less participation, such as executives and other stakeholders.
➢A Gantt chart is visually appealing and easy to understand.
• It provides critical information about tasks at a glance, including the order in which they begin and their duration.
• It Improves Efficiency and Helps Manage Resources
• A Gantt chart can help ensure that leaders and workers manage their time and resources effectively. Project leaders can use it to set realistic schedules and allocate resources based on those schedules, including assigning the right people to the right tasks. It can also help project members come up with workarounds for potential problems before a project starts.
It Allows for Better Tracking:
A Gantt chart enables project leaders and members to closely track tasks, benchmarks, and overall workflow. The chart can reveal possible constraints or issues and allow project leaders and members to adjust accordingly.
It Illustrates Overlaps and Dependencies
• A Gantt chart clearly communicates how tasks in a project might overlap. It also shows how the beginning of one task can be dependent on the completion of another task. That kind of information allows project leaders to schedule work and provide resources in a way that doesn’t impede the progress of a project.