http://www.sajs.co.za
South African Journal of Science
80
0.47
0.27
0.38 0.60
0.35
0.48
0.17
0.52
0.74
1.88
0.02
0.14
0.70
0.46
0.04
0.33
0.64
0.28
0.38
0.30
4.70
0.10
0.68
0.08
0.28
1.38
1.12
1.98
2.78
2.01
Marikana RSA (2008 – 2009) Maximum 3-month averages, PM10
0.13 – 1.94
0.07 – 1.12
0.00 – 1.67
0.00 – 0.73
0.11 – 1.68
0.16 – 2.39
0.02 – 14.53
0.00 – 0.07
0.00 – 0.37
0.15 – 2.27
0.00 – 1.59
0.00 – 0.16
0.00 – 1.08
0.04 – 1.48
0.01 – 0.80
0.02 – 1.92
0.01 – 2.42
0.42 – 19.01
0.01 – 0.16
0.01 – 1.26
0.00 – 0.40
0.01 – 0.45
0.43 – 4.53
0.03 – 3.25
0.31 – 2.86
0.09 – 13.57
0.13 – 7.23
Marikana RSA (2008 – 2009) Concentration range of 72-h samples, PM10
0.42
0.34
0.21
0.77
9.76
4.39
1.37
0.16
0.18
Rustenburg, RSA (2006) PM1016
0.04
0.00
0.00
0.09
0.05
0.04
1.28
0.12
0.05
0.00
0.02
1.30
1.00
2.80
Vaal Triangle, RSA (2006, 2007) PM1012
TSP, total suspended particulates
° 3-month limit value
* WHO guideline for Cr(VI) concentrations associated with an excess lifetime risk of 1:1 000 000
24-h limit value
0.0645
0.00041
0.273
0.0295
0.00315
1.18
0.0255
0.00432
5.34
1.47
Urban/industrial area in La Plata City, Argentina (1993) TSP34
WHO air quality guidelines for Europe11, b European Commission Air Quality Standards35, c National Ambient Air Quality Standards of the United States Environmental Protection Agency36, d National Air Quality Act of the South African Department of Environmental Affairs37
0.067
0.0086
0.0005
0.039
0.038
0.00012
0.35
0.03
0.043
0.132
8.80
0.185
1.90
0.10
1.70
Industrial area in Lisbon, Portugal (2001) PM1033
#
0.0149
0.000486
0.00
0.00030
0.00069
0.0545
0.0153
0.00256
0.510
0.0141
0.00355
0.002
24 Urban and industrial sites in the UK (2009) PM1032
a
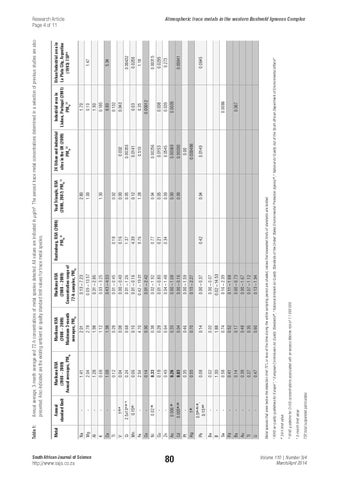
Metal species that were below the detection limit 75% or less of the time during the entire sampling period are shaded; values that exceeded limits of standards are bolded.
-
-
Tl
U
0.14
-
-
Ba
Au
0.58
0.41
-
-
0.02
Se
0.35
0.03
Pd
-
1.30
0.005(a),(b)
Cd
Pt
0.26
-
0.006 (b)
As
0.49
-
-
Zn
0.18
0.33
Be
-
Cu
B
0.02 (b)
Ni
0.14
0.08
-
Co
2.54
Pb
-
Fe
0.06
0.55
0.15(a)
Mn
0.24
0.04
1(a)
2.5x10⁴ (a) *
Cr
0.5(a),(b),(d), 0.15(c)°
1(b) #
V
0.12
1.08
Hg
-
Ti
0.68
-
-
K
Ca
1.28
-
Al
1.41
2.04
-
-
Na
Marikana RSA (2008 – 2009) Annual averages, PM10
Annual standard limit
Annual average, 3-month average and 72-h concentrations of metal species detected. All values are indicated in µg/m3. The aerosol trace metal concentrations determined in a selection of previous studies are also presented. Also indicated are the existing ambient air quality standard limit values for trace metal species.
Mg
Metal
Table 1:
Research Article Page 4 of 11 Atmospheric trace metals in the western Bushveld Igneous Complex
Volume 110 | Number 3/4 March/April 2014