Review Article Page 4 of 5
Shale gas and coal for electricity generation in South Africa
Comparing electricity from shale gas and coal in South Africa
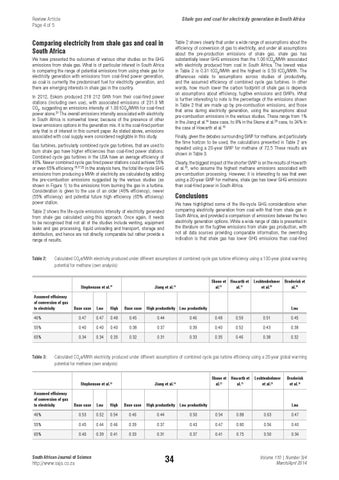
Table 2 shows clearly that under a wide range of assumptions about the efficiency of conversion of gas to electricity, and under all assumptions about the pre-production emissions of shale gas, shale gas has substantially lower GHG emissions than the 1.06 tCO2/MWh associated with electricity produced from coal in South Africa. The lowest value in Table 2 is 0.31 tCO2/MWh and the highest is 0.59 tCO2/MWh. The differences relate to assumptions across studies of productivity, and the assumed efficiency of combined cycle gas turbines. In other words, how much lower the carbon footprint of shale gas is depends on assumptions about efficiency, fugitive emissions and GWPs. What is further interesting to note is the percentage of the emissions shown in Table 2 that are made up by pre-combustion emissions, and those that arise during electricity generation, using the assumptions about pre-combustion emissions in the various studies. These range from 1% in the Jiang et al.14 base case, to 8% in the Skone et al.23 case, to 34% in the case of Howarth et al.13
We have presented the outcomes of various other studies on the GHG emissions from shale gas. What is of particular interest in South Africa is comparing the range of potential emissions from using shale gas for electricity generation with emissions from coal-fired power generation, as coal is currently the predominant fuel for electricity generation, and there are emerging interests in shale gas in the country. In 2012, Eskom produced 218 212 GWh from their coal-fired power stations (including own use), with associated emissions of 231.9 Mt CO2, suggesting an emissions intensity of 1.06 tCO2/MWh for coal-fired power alone.21 The overall emissions intensity associated with electricity in South Africa is somewhat lower, because of the presence of other lower emissions options in the generation mix. It is the coal-fired portion only that is of interest in this current paper. As stated above, emissions associated with coal supply were considered negligible in this study.
Finally, given the debates surrounding GWP for methane, and particularly the time horizon to be used, the calculations presented in Table 2 are repeated using a 20-year GWP for methane of 72.5 These results are shown in Table 3.
Gas turbines, particularly combined cycle gas turbines, that are used to burn shale gas have higher efficiencies than coal-fired power stations. Combined cycle gas turbines in the USA have an average efficiency of 46%. Newer combined cycle gas fired power stations could achieve 55% or even 65% efficiency.13,17,22 In the analysis here, the total life-cycle GHG emissions from producing a MWh of electricity are calculated by adding the pre-combustion emissions suggested by the various studies (as shown in Figure 1) to the emissions from burning the gas in a turbine. Consideration is given to the use of an older (46% efficiency), newer (55% efficiency) and potential future high efficiency (65% efficiency) power station.
Clearly, the biggest impact of the shorter GWP is on the results of Howarth et al.13, who assume the highest methane emissions associated with pre-combustion processing. However, it is interesting to see that even using a 20-year GWP for methane, shale gas has lower GHG emissions than coal-fired power in South Africa.
Conclusions We have highlighted some of the life-cycle GHG considerations when comparing electricity generation from coal with that from shale gas in South Africa, and provided a comparison of emissions between the two electricity generation options. While a wide range of data is presented in the literature on the fugitive emissions from shale gas production, with not all data sources providing comparable information, the overriding indication is that shale gas has lower GHG emissions than coal-fired
Table 2 shows the life-cycle emissions intensity of electricity generated from shale gas calculated using this approach. Once again, it needs to be recognised that not all of the studies include venting, equipment leaks and gas processing, liquid unloading and transport, storage and distribution, and hence are not directly comparable but rather provide a range of results.
Table 2:
Calculated CO2e/MWh electricity produced under different assumptions of combined cycle gas turbine efficiency using a 100-year global warming potential for methane (own analysis)
Stephenson et al.19 Assumed efficiency of conversion of gas to electricity
Skone et al.23
Jiang et al.14
Howarth et al.13
Lechtenböhmer et al.20
Base case
Low
High
Base case
46%
0.47
0.47
0.48
0.45
0.44
0.46
0.48
0.59
0.51
0.45
55%
0.40
0.40
0.40
0.38
0.37
0.39
0.40
0.52
0.43
0.38
65%
0.34
0.34
0.35
0.32
0.31
0.33
0.35
0.46
0.38
0.32
Table 3:
High productivity Low productivity
Broderick et al.18
Low
Calculated CO2e/MWh electricity produced under different assumptions of combined cycle gas turbine efficiency using a 20-year global warming potential for methane (own analysis)
Stephenson et al.19 Assumed efficiency of conversion of gas to electricity
Skone et al.23
Jiang et al.14
Howarth et al.13
Lechtenböhmer et al.20
Broderick et al.18
Base case
Low
High
Base case
High productivity
Low productivity
46%
0.53
0.52
0.54
0.46
0.44
0.50
0.54
0.88
0.63
0.47
55%
0.45
0.44
0.46
0.39
0.37
0.43
0.47
0.80
0.56
0.40
65%
0.40
0.39
0.41
0.33
0.31
0.37
0.41
0.75
0.50
0.34
South African Journal of Science
http://www.sajs.co.za
34
Low
Volume 110 | Number 3/4 March/April 2014