Review Article Page 3 of 5
Shale gas and coal for electricity generation in South Africa
Different studies have produced diverging results on the amount of methane emitted during the flowback period. Howarth et al.13 suggest that the gas emitted during this flowback period can be estimated from the well’s initial production rate, and Jiang et al.14 support this view, assuming that the rate of methane release during flowback is the same as that for the first 30 days of production. Cathles et al.15, however, argue that the amount of methane produced during flowback is lower and cannot be estimated from initial production rates.
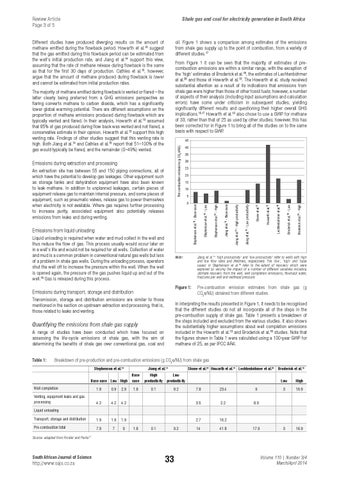
oil. Figure 1 shows a comparison among estimates of the emissions from shale gas supply up to the point of combustion, from a variety of different studies.17 From Figure 1 it can be seen that the majority of estimates of precombustion emissions are within a similar range, with the exception of the ‘high’ estimates of Broderick et al.18, the estimates of Lechtenböhmer et al.20 and those of Howarth et al.13. The Howarth et al. study received substantial attention as a result of its indications that emissions from shale gas were higher than those of other fossil fuels; however, a number of aspects of their analysis (including input assumptions and calculation errors) have come under criticism in subsequent studies, yielding significantly different results and questioning their higher overall GHG implications.15,17 Howarth et al.13 also chose to use a GWP for methane of 33, rather than that of 25 as used by other studies; however, this has been corrected for in Figure 1 to bring all of the studies on to the same basis with respect to GWP.
The majority of methane emitted during flowback is vented or flared – the latter clearly being preferred from a GHG emissions perspective as flaring converts methane to carbon dioxide, which has a significantly lower global warming potential. There are different assumptions on the proportion of methane emissions produced during flowback which are typically vented and flared. In their analysis, Howarth et al.13 assumed that 85% of gas produced during flow back was vented and not flared, a conservative estimate in their opinion. Howarth et al.13 support this high venting rate. Findings of other studies suggest that this venting rate is high. Both Jiang et al.14 and Cathles et al.15 report that 51–100% of the gas would typically be flared, and the remainder (0–49%) vented.
30 25 20 15 10
Broderick et al.18 - High
Broderick et al.18 - Low
Lechtenbohmer et al.20
Howarth et al.13
Skone et al.23
Jiang et al.14 - Low productivity
Emissions from liquid unloading
Jiang et al.14 - High productivity
0
Jiang et al.14 - Base case
5 Stephenson et al.19 - High
An extraction site has between 55 and 150 piping connections, all of which have the potential to develop gas leakages. Other equipment such as storage tanks and dehydration equipment have also been known to leak methane. In addition to unplanned leakages, certain pieces of equipment release gas to maintain internal pressure, and some pieces of equipment, such as pneumatic valves, release gas to power themselves when electricity is not available. Where gas requires further processing to increase purity, associated equipment also potentially releases emissions from leaks and during venting.
35
Stephenson et al.19 - Low
Emissions during extraction and processing
40
Stephenson et al.19 - Base case
Pre-combustion emissions (g CO2e/MJ)
45
Liquid unloading is required when water and mud collect in the well and thus reduce the flow of gas. This process usually would occur later on in a well’s life and would not be required for all wells. Collection of water and mud is a common problem in conventional natural gas wells but less of a problem in shale gas wells. During the unloading process, operators shut the well off to increase the pressure within the well. When the well is opened again, the pressure of the gas pushes liquid up and out of the well.16 Gas is released during this process.
Note:
Emissions during transport, storage and distribution
Figure 1: Pre-combustion emission estimates from shale gas (g CO2e/MJ) obtained from different studies.
Transmission, storage and distribution emissions are similar to those mentioned in the section on upstream extraction and processing, that is, those related to leaks and venting.
In interpreting the results presented in Figure 1, it needs to be recognised that the different studies do not all incorporate all of the steps in the pre-combustion supply of shale gas. Table 1 presents a breakdown of the steps included and excluded from the various studies. It also shows the substantially higher assumptions about well completion emissions included in the Howarth et al.13 and Broderick et al.18 studies. Note that the figures shown in Table 1 were calculated using a 100-year GWP for methane of 25, as per IPCC AR4.
Quantifying the emissions from shale gas supply A range of studies have been conducted which have focused on assessing the life-cycle emissions of shale gas, with the aim of determining the benefits of shale gas over conventional gas, coal and Table 1:
Jiang et al.14 ‘high productivity’ and ‘low productivity’ refer to wells with high and low flow rates and lifetimes, respectively. The ‘low’, ‘high’ and ‘base cases’ in Stephenson et al.19 refer to the extent of recovery which were explored by varying the impact of a number of different variables including ultimate recovery from the well, well completion emissions, flowback water, fractures per well and wellhead pressure.
Breakdown of pre-production and pre-combustion emissions (g CO2e/MJ) from shale gas Stephenson et al.19 Base case Low High
Well completion
1.8
0.9
2.9
Venting, equipment leaks and gas processing
4.2
4.2
4.2
Transport, storage and distribution
1.9
1.9
1.9
Pre-combustion total
7.9
7
9
Jiang et al.14 Base case 1.8
Skone et al.23 Howarth et al.13 Lechtenböhmer et al.20
High Low productivity productivity 0.1
9.2
7.8
23.4
9
3.5
2.2
8.9
2.7
16.2
14
41.8
Broderick et al.18 Low
High
3
16.9
3
16.9
Liquid unloading
1.8
0.1
9.2
17.9
Source: adapted from Forster and Perks17
South African Journal of Science
http://www.sajs.co.za
33
Volume 110 | Number 3/4 March/April 2014